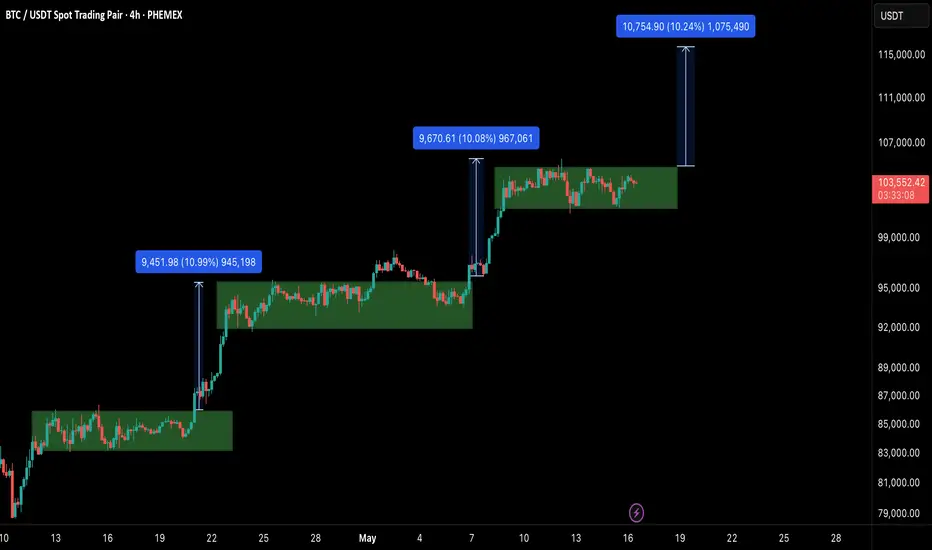
BTC: Next Big Move is Brewing – $116K Target Locked!🚀 Hey Traders! 👋
If you’re finding value in this analysis, smash that 👍 and hit Follow for high-accuracy trade setups that actually deliver! 💹🔥
Bitcoin has been following a highly consistent rally-consolidation-breakout pattern over the last few weeks — each time breaking out with nearly +10% upside moves after forming solid accumulation zones. 📈
📊 Observational Pattern:
Let’s break it down:
Phase 1 (April 19–21)
Accumulation range: GETTEX:82K –$84K
Breakout: ~11% gain to ~$93K
Phase 2 (April 25–May 7)
Range: ~$91K–$94K
Breakout: ~10% rally to ~$103.5K
Phase 3 (Current Zone: May 9–Now)
Range: ~$101K–$104K
Price is consolidating, showing signs of continuation.
🧠 What the Chart is Telling Us:
Bitcoin is forming a bullish continuation structure (like a stepping staircase) — a pattern often seen in strong trending markets.
Each green box (marked in chart) represents a clear demand zone followed by a breakout.
If this pattern repeats, we can expect a move towards $114K–$116K.
Invalidation Level: A daily close below $101K would break the rising support and flip sentiment short-term bearish.
✅ Summary:
Target: $114K–$116K
Invalidation: Daily close < $101K
⚠️ Trade with discipline. Let the chart confirm before aping in.
We’ll keep updating as the setup evolves — pin this for reference. 🧠
Bullishpattern
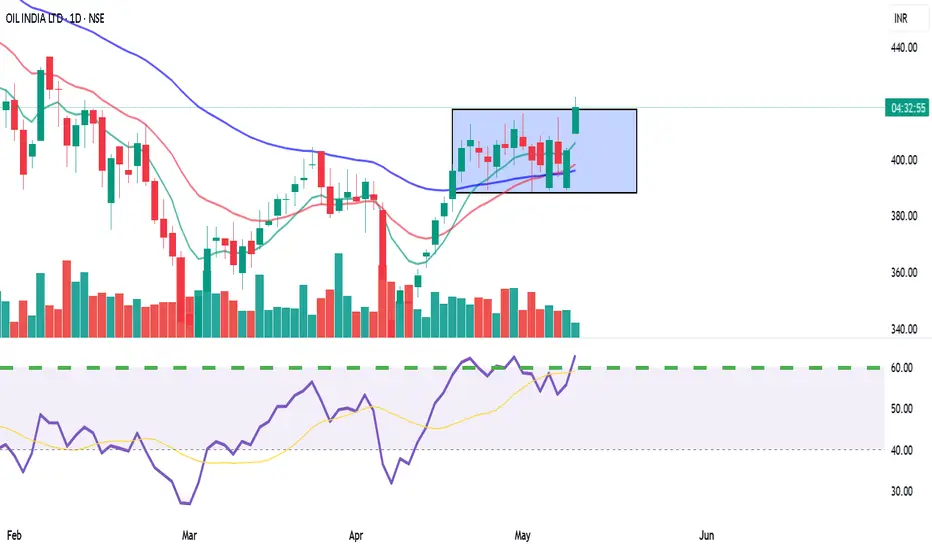
OIL – Oil India Ltd | Target: ₹429.00🟢 Trade Details:
LTP: ₹417.30
Recommended Buy Range: ₹415.50 – ₹416.00
🎯 Target: ₹429.00
🛑 Stop Loss: ₹408.70
🔍 Technical Snapshot:
✅ Strong bullish candle with volume confirmation
✅ EMA crossover supports the uptrend (9 EMA > 13 EMA)
✅ RSI at 62.22 shows healthy momentum
✅ Breakout above previous range box visible on Daily & 1H TF
📊 BB %B at 0.82 – still room before overbought levels
💼 Strategy:
Suitable for short-term MTF holding (2–5 days)
Risk-Reward ~1:1.5
Trail SL to cost once ₹424+ is breached
Use smaller timeframes (15m / 1H) to confirm entry with volume
For Education Purposes Only
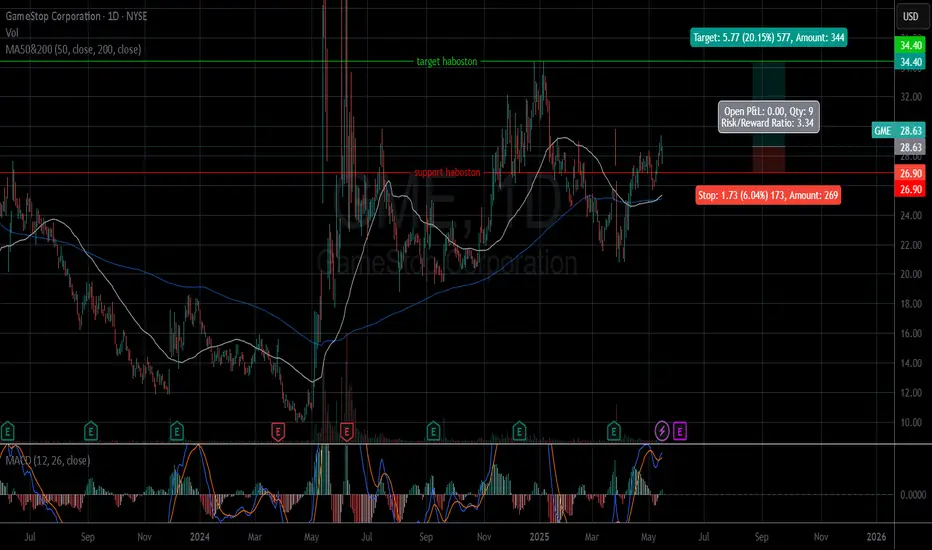
GME bullish with Golden crossGME bullish right now with:
- Golden cross in Day frame chart.
- Dragongly doji today maybe bullish if the volume higher tomorrow.
- MACD bullish .
- Pre Golden cross in Week frame chart too.
Today (05/15/2025) price closed: $28.63.
Entry now, R/R: 3.34.
Price target: $34.40.
Stop-loss: $26.90.
IMO.
AUD/USD 4H | Wave 2 Pullback in MotionAUD/USD is currently completing a corrective Wave (2) within a larger impulsive structure. After the peak of Wave (1) at 0.65145, price has been in a healthy retracement phase, now nearing key fib confluence zones.
🟣 EMA Confluence:
Price is reacting near the 100 & 200 EMA (0.6373–0.6394), which has acted as dynamic support throughout this structure.
We are currently holding above the 0.382 level, with the golden zone (0.618–0.705) sitting just below.
🔄 Bullish Continuation Scenario:
If the pair holds above 0.6285 and we see bullish confirmation candles, we may begin the next leg higher — Wave (3) — targeting 0.66250–0.66766 as initial projection zones.
📊 RSI:
The RSI is hovering just below the 50 level, showing temporary bearish pressure, but has room to recover if structure holds.
🧠 Plan:
📍 Watching 0.6285–0.6214 for final support
📍 Wave (3) target zone: 0.66500+
📍 Invalidation: Clean break and close below 0.6015
🔔 Wave (2) entries are where the patient traders shine. Eyes on structure, and let price do the heavy lifting.
@WrightWayInvestments
@WrightWayInvestments
@WrightWayInvestments

Bullish Divergence on DTF.
Bullish Divergence on DTF.
Important Resistance is around 52.50
However, sustaining this level will
expose 55 - 60 zone.

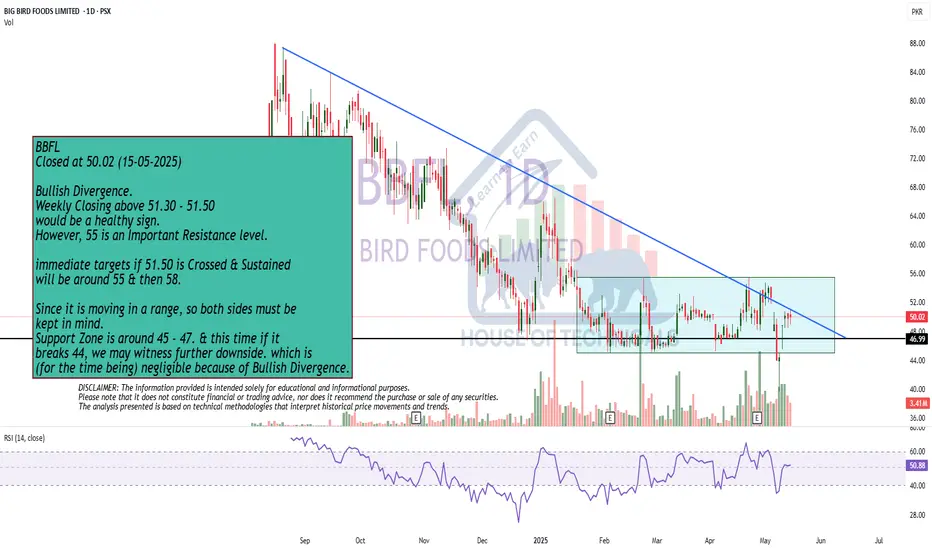
Bullish Divergence.
Bullish Divergence.
Weekly Closing above 51.30 - 51.50
would be a healthy sign.
However, 55 is an Important Resistance level.
immediate targets if 51.50 is Crossed & Sustained
will be around 55 & then 58.
Since it is moving in a range, so both sides must be
kept in mind.
Support Zone is around 45 - 47. & this time if it
breaks 44, we may witness further downside. which is
(for the time being) negligible because of Bullish Divergence.
Inverse H&SBeautiful Inverse H&S pattern in place.
Sustaining 42 may lead it towards 48 & then 50 - 54.
39 - 40 can be an immediate Support.
However, breaking 36 may bring more Selling pressure.

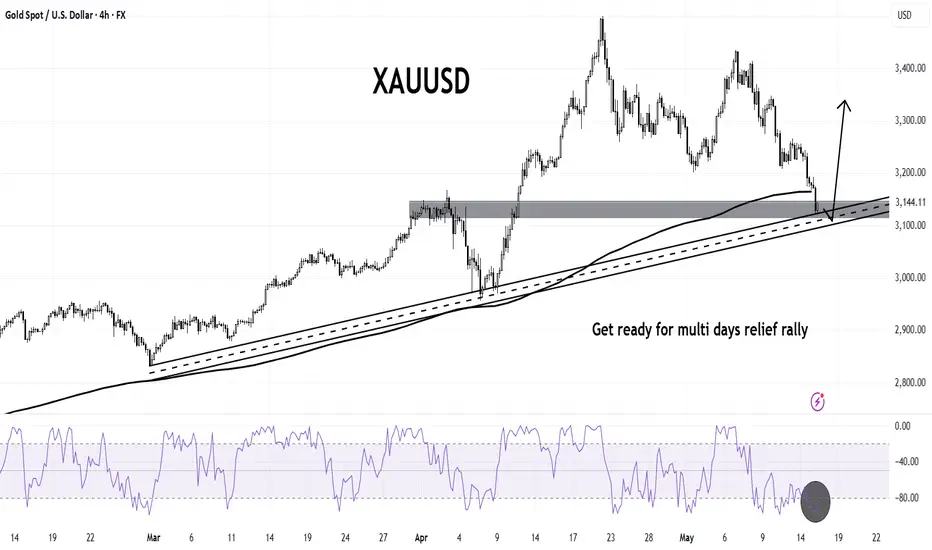
XAUUSDGOLD is been pushed down very hard and now is trading at very crucial level, horizontal and at trendline support.
William percentage range is at over sold level which is also suggesting a relief rally in gold.
Its about the big picture. BUY SKLZImo this sklz stock is an easy buy and hold buy more and hold.
Volume profile on weekly at 11.53 is similar to the volume at 156$ a share
Volume of the passed is all this is missing. Avg down people who have been stuck like me no more 3.80$ buys.

Crossed over 6.05 SKLZSklz will be over 10$ next year mark my words!!!
Daily booming primed for a breakout of the oldest bearish trends dating back to the reverse split… been holding and buying for years got stuck in and now we are bullish with a good avg price waiting for half sell off north off 11.53$ riding the rest.
16.7m shares i own 3.1k

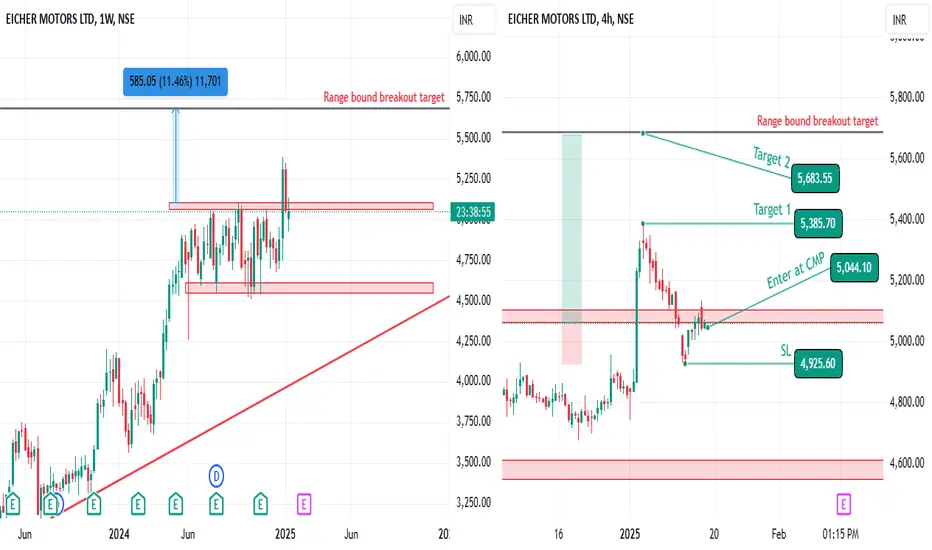
Weekly Range bound | 4H swingFellow trader,
Eicher motors has broken the range bound market in weekly timeframe, and now the market is re-testing.
Aggressive entry : Whoever enter the market immediately after the breakout
Conservative entry : Whoever enter after the market re-test.
The weekly range bound breakout target is 5684 & the SL for the same is 4548
Now in the re-test, there is a clear formation of a swing in 4H/1D timeframe, after a inverted H&S pattern breakout in 1H timeframe consider to enter the trade based on this swing.
Considering the pattern of Weekly or 4H time frame trade can be taken, the SL and Targets are in the chart.
The Risk : Reward ratio for the swing is 1:4.47
Sensibull : sbull.co
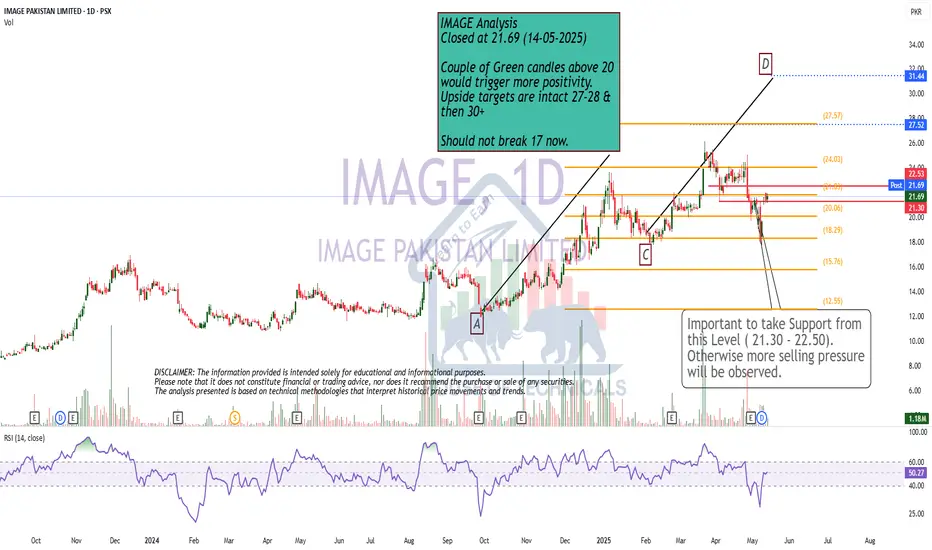
ABCD still intact..Couple of Green candles above 20
would trigger more positivity.
Upside targets are intact 27-28 &
then 30+
Should not break 17 now.
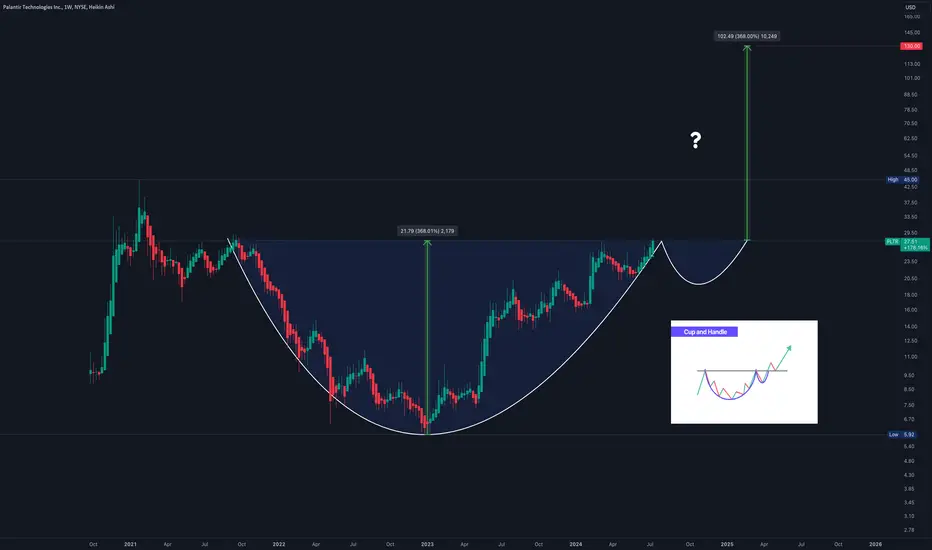
$PLTR - Bullish Cup and Handle Pattern on the Weekly ChartNYSE:PLTR Hello everyone! I've been analyzing the weekly chart and noticed a bullish cup and handle pattern that I think is worth sharing with you. This pattern suggests a potential price target of $130 for next year if it follows through as expected. I find this pattern quite interesting and will keep a close eye on it for potential trading opportunities.
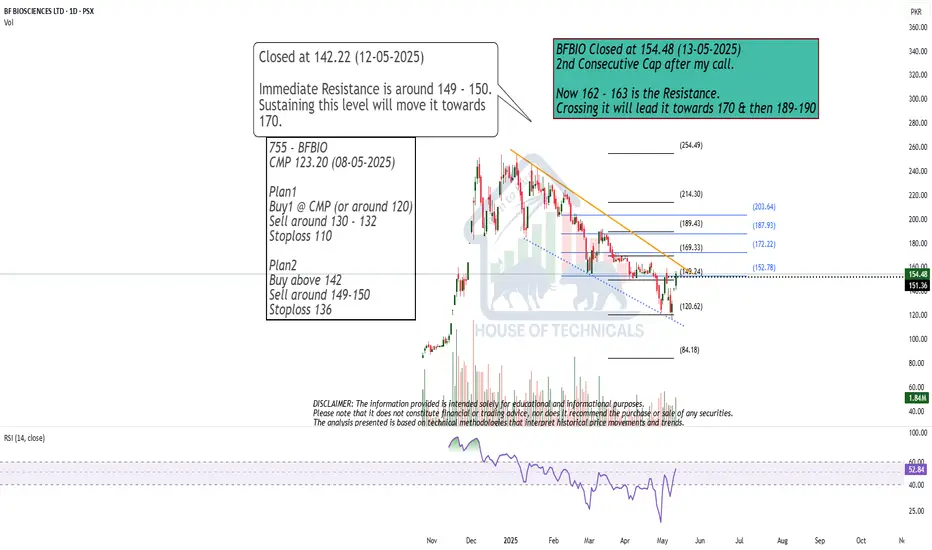
2nd Consecutive Cap after my call.
2nd Consecutive Cap after my call.
Now 162 - 163 is the Resistance.
Crossing it will lead it towards 170 & then 189-190
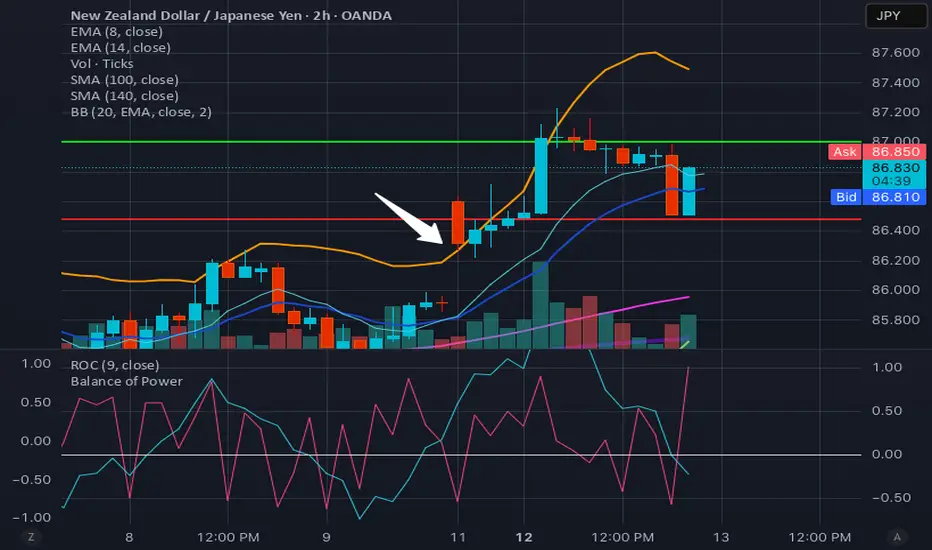
RISING WINDOW!As you can see at the big white arrow, we have an open window; A rising window. This is a very bullish indication, not to mention the bullish candlestick next to the previous candlestick, which is red. This is also very bullish. Be sure to set up your horizontal trend lines (as seen in this idea). Happy trading!
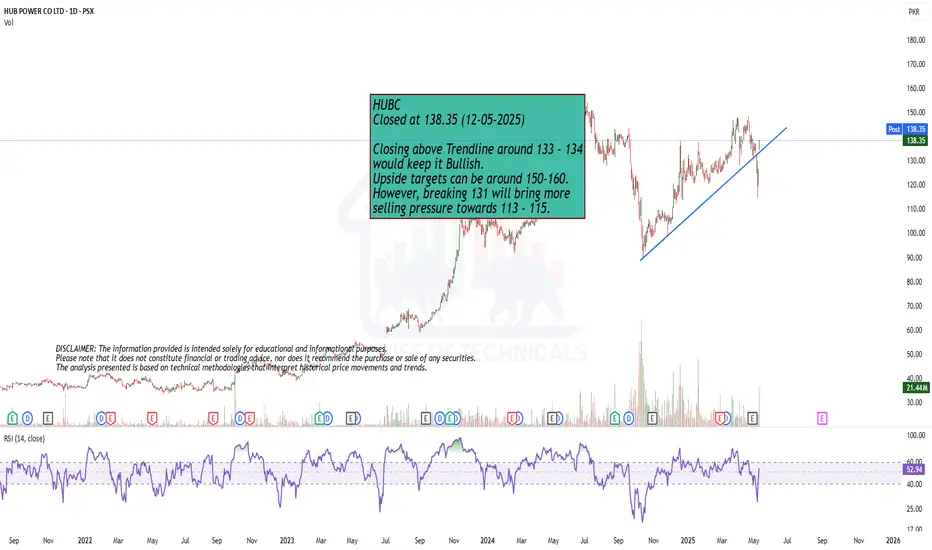
Bullish Momentum
Closing above Trendline around 133 - 134
would keep it Bullish.
Upside targets can be around 150-160.
However, breaking 131 will bring more
selling pressure towards 113 - 115.
Still Potential to Move Up.It still has the Potential to Move Further Up.
It was Capped today with Huge Volumes.
Potential Target is around 380+

Still Positive
Immediate Resistance is around 149 - 150.
Sustaining this level will move it towards
170.

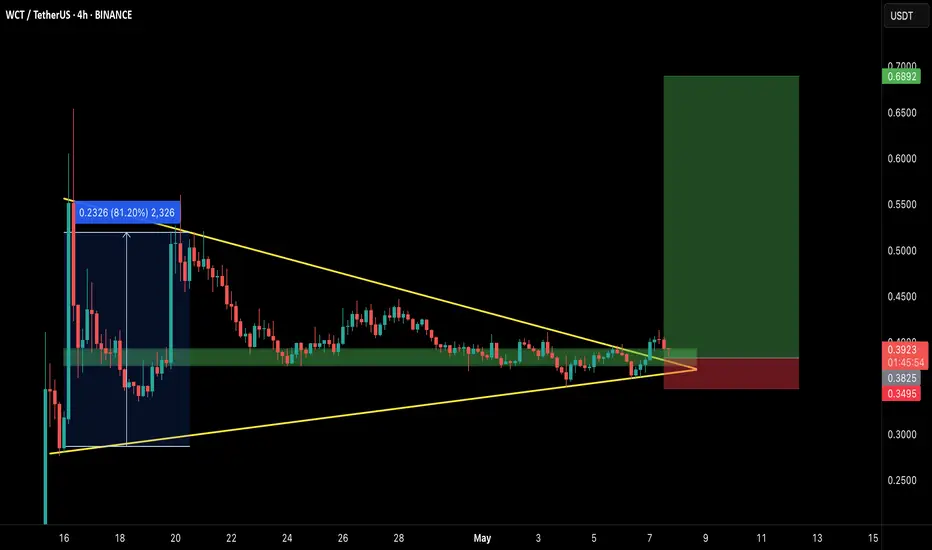
WCT Breakout Confirmed – Ready for Lift-Off?🚀 WCT Breakout Alert – 80% Potential Incoming?! 👀🔥
Hey Traders! If you're all about high-conviction plays and real alpha, smash that 👍 and tap Follow for more setups that actually deliver! 💹💯
WCT has finally broken out of its long-standing symmetrical triangle on the 4H timeframe 🔥. After weeks of consolidation, we’re seeing a fresh move building up, hinting at strong momentum ahead.
🔎 Chart Insights:
✅ Breakout above resistance zone ✔️
📈 Retest happening around the breakout zone ✔️
📊 Previous pump: 81% surge! Will history repeat?
Trade Idea:
Entry: Current Market Price (CMP) and add more in dip
Targets: $0.44/$0.48 / $0.56 / $0.68 🎯
Stop Loss: $0.35 🚨
Lev: Use low leverage (Max 5x)
The chart looks clean with solid structure—keep an eye as this can build up for a big move 💥.
💬 What’s your take? Drop your analysis or ride along with this setup!
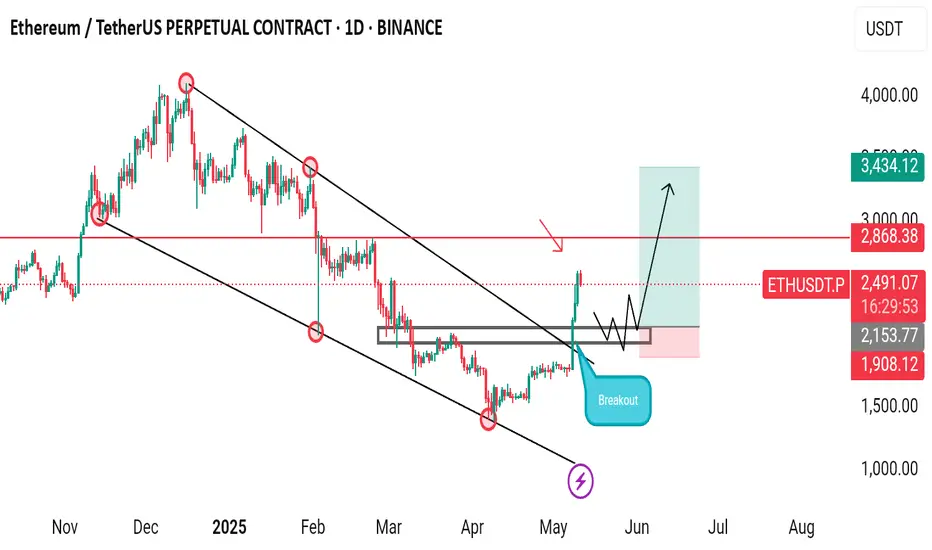
Is ETH - Next 3,000?ETHUSDT – Market Insight & Price Structure
Ethereum has been shaping a falling wedge pattern over the past 2 to 3 months—a structure that typically suggests a bullish reversal. Recently, price action confirmed a breakout above the key resistance zone between $2034 and $2040, along with a clean break of the upper trendline of the wedge. These movements point to a strong bullish signal, suggesting potential continuation to the upside.
Currently, Ethereum is approaching a significant resistance level around $2860. If price reaches this zone, we’ll be watching closely for confirmed reversal signals to consider a potential short/sell setup.
On the other hand, the primary bullish trend trade remains valid near the $2160–$2150 support range. A long position will only be considered upon confirmation, such as a bullish engulfing candlestick pattern, market structure shift (MSS), or other trusted technical signals.
Disclaimer: This is not financial advice. Always do your own research (DYOR).
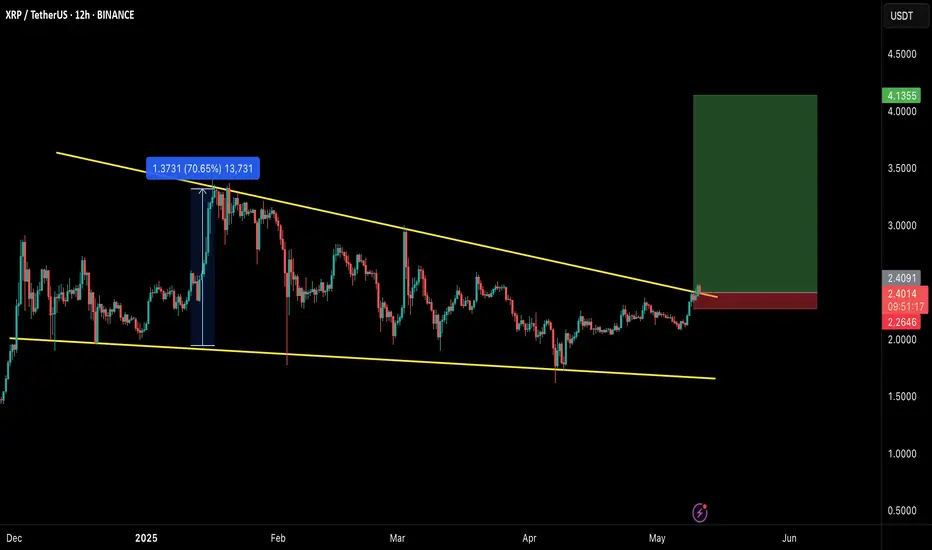
Breakout Confirmed: XRP on the Move Toward $4+🚀 XRP Breakout Alert – 70% Potential Incoming?! 👀🔥
Hey Traders! If you're all about high-conviction plays and real alpha, smash that 👍 and tap Follow for more setups that actually deliver! 💹💯
📈 XRP/USDT – Breakout Alert! 🚀
XRP is breaking out from a long-term falling wedge pattern on the 12H timeframe, signaling the potential for a strong bullish move ahead!
🔹 Entry: CMP $2.39 – Add more up to $2.32
🔹 Targets:
• TP1: $2.85
• TP2: $3.32
• TP3: $3.78
• TP4: $4.13
🔻 Stop-Loss: $2.09
⚙️ Leverage: Up to 5x (Trade responsibly)
This structure mirrors the previous 70%+ pump from the same wedge formation. History might just be ready to repeat. 👀
Let’s ride this breakout with tight risk management! 💥
#SEIUSDT remains in bullish continuation mode📉 LONG BYBIT:SEIUSDT.P from $0.2747
🛡 Stop loss: $0.2640
🕒 Timeframe: 4H
✅ Market Overview:
➡️ Falling Wedge pattern has played out — confirmed breakout to the upside.
➡️ A strong Inverse Head and Shoulders pattern is visible — neckline broken with momentum.
➡️ Volume increases on upward impulse — bullish confirmation.
➡️ Current price is consolidating slightly — likely preparing for the next leg up.
➡️ POC at $0.1697 is far below — market structure flipped bullish.
➡️ Clear upward projection toward the $0.2810–$0.2910 range.
🎯 TP Targets:
💎 TP 1: $0.2810
💎 TP 2: $0.2870
💎 TP 3: $0.2910
📢 Holding above $0.2740 confirms bullish structure.
📢 Watch for minor resistance near TP1, then potential continuation to TP2 and TP3.
📢 Secure partial profits at TP1, and let the rest ride toward higher targets.
📢 It’s advisable to partially take profits near the specified resistance levels.
📢 A retest of the breakout zone (around $0.22) is possible — this can be used for adding to the position.
🚀 BYBIT:SEIUSDT.P remains in bullish continuation mode — targets still active!

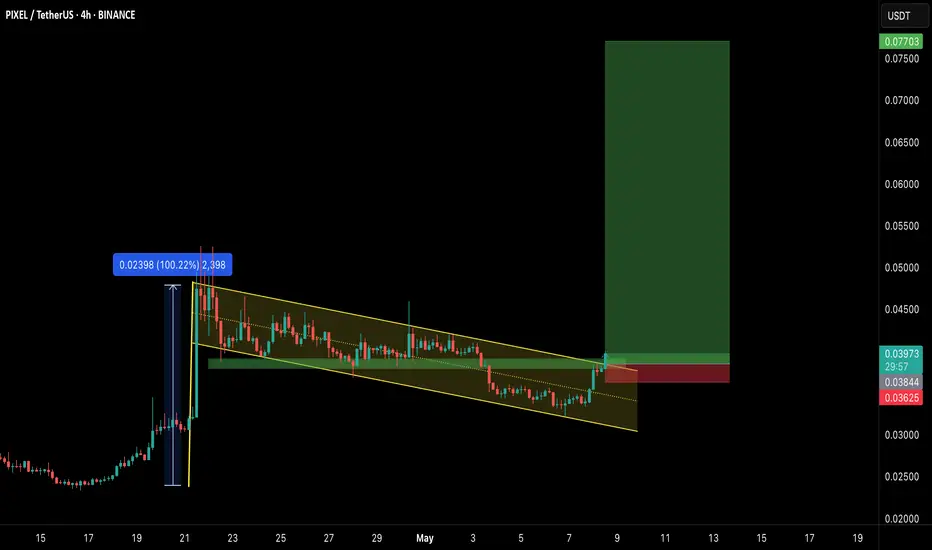
PIXEL Breakout Alert: Ready for the Next Leg Up?🚀 PIXEL Breakout Alert – 100% Potential Incoming?! 👀🔥
Hey Traders! If you're all about high-conviction plays and real alpha, smash that 👍 and tap Follow for more setups that actually deliver! 💹💯
PIXEL has broken out from a bull flag on the 4H timeframe after consolidating for weeks. This clean breakout signals a potential trend reversal with strong upside momentum building. 💥
Trade Setup:
👉 Entry: $0.0380–$0.0400 (post-breakout zone)
🎯 Targets:
$0.0455
$0.0520
$0.0630
$0.0770
🛡 Stop-loss: $0.0360 (below channel re-entry)
Why I Like It:
Clear breakout of the falling channel
Strong volume surge confirms momentum
Previous 100% move shows solid potential
If BTC stays stable, this one looks set for a strong run! 🚀 Keep it on your radar.