SONIC | (Previously Fantom) | HUGE BULLISH PatternFTM has now officially been replaced on most exchange and is now trading as Sonic.
At first we saw an initial drop, typical "sell the news" actions, but now there is a bullish pattern forming in the 4h timeframe.
SONIC is bullish because:
✅ Upwards trendline trading
✅ Higher Lows
✅ Bullish chart pattern: W-Bottom
_______________
BYBIT:SONICUSDT
Bullishpattern

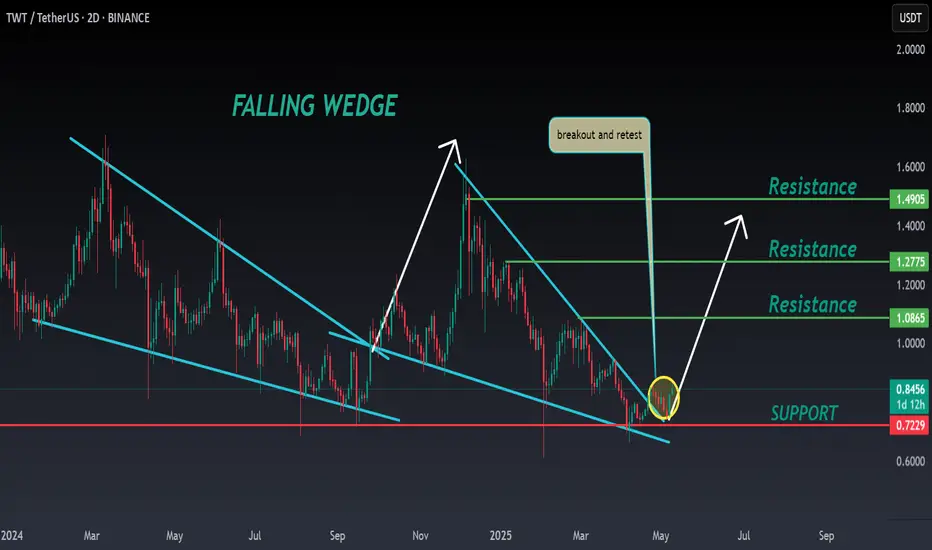
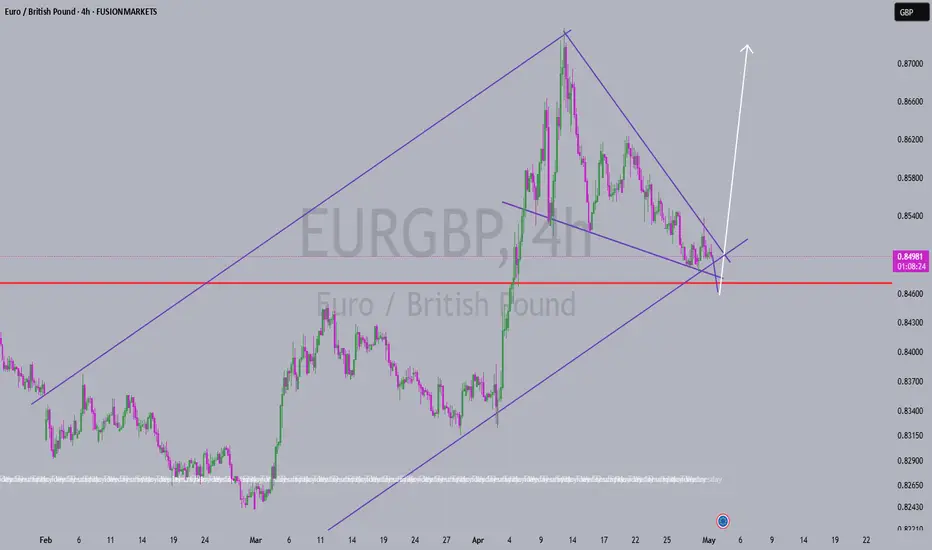
TWT ANALYSIS🚀#TWT Analysis :
🔮As we can see in the chart of #TWT that there is a formation of "Falling Wedge Pattern". Some time ago the same structure was made and it performed well and this time also the same is happening with a perfect breakout
🔰Current Price: $0.8464
🎯 Target Price: $1.0865
⚡️What to do ?
👀Keep an eye on #TWT price action. We can trade according to the chart and make some profits⚡️⚡️
#TWT #Cryptocurrency #TechnicalAnalysis #DYOR
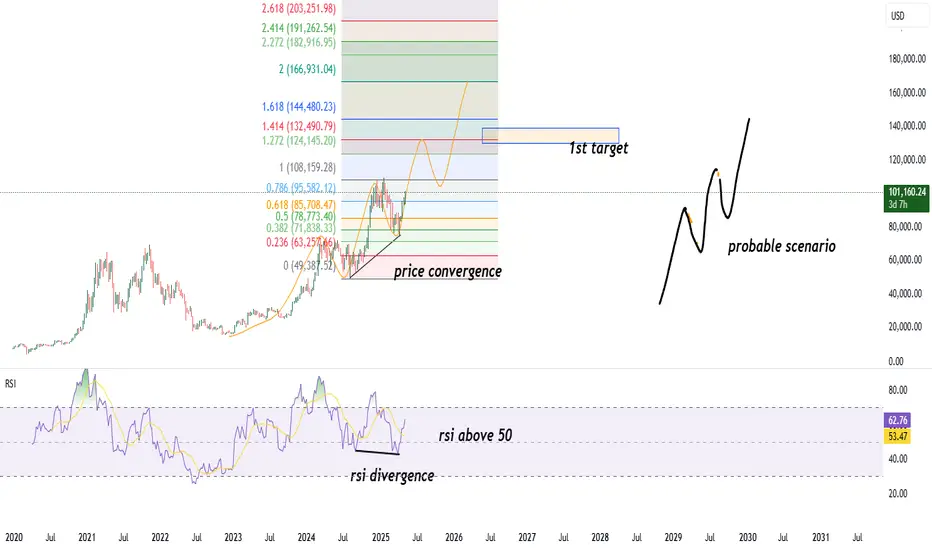
Bitcoin bullish rsi can lead to 133kbitcoin can lead to 133k without any stop as bullish convergence and diversion has been identified with RSI above 50 there is no stopping.
MA & EMA BOTH ARE SHOWING GOLDEN CROSS OVER .
Probable higher high ,lower low pattern can form for more push to 200k
CELH - Golden cross bullishWith Day frame chart, we have Golden cross and MACD bullish.
The price today (05.06.25) closed at $35.52 (up 4.81% with ER fell !!!).
The price after hours: $35.39.
If entry right now. R/R: 2.91.
Price target: $42.52.
Stop loss: $32.94.
IMO, amateur trader.

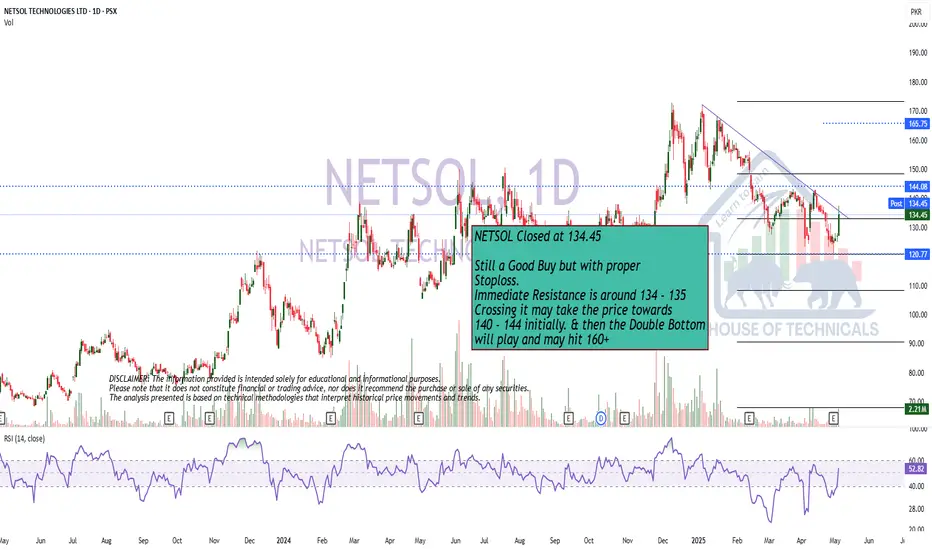
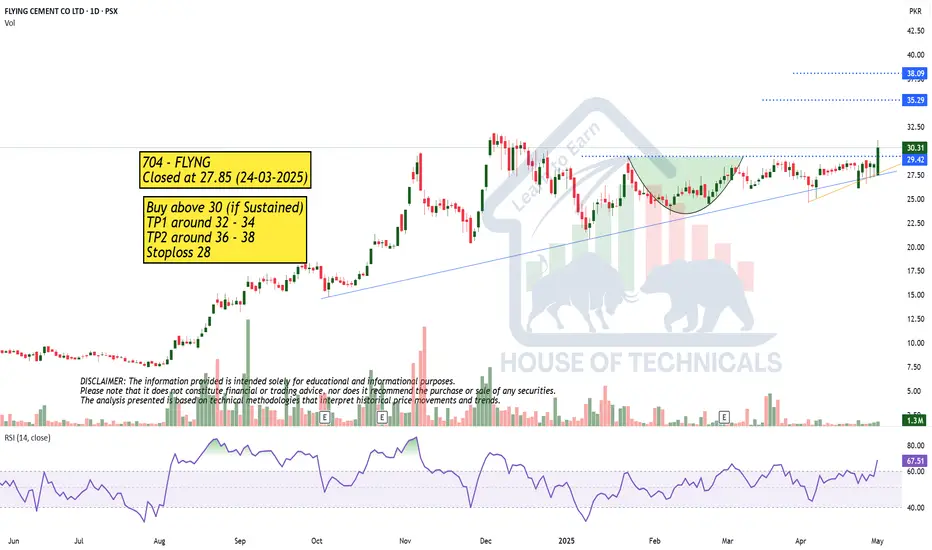
Still a Good Buy but with proper Stoploss.Still a Good Buy but with proper
Stoploss.
Immediate Resistance is around 134 - 135
Crossing it may take the price towards
140 - 144 initially. & then the Double Bottom
will play and may hit 160+
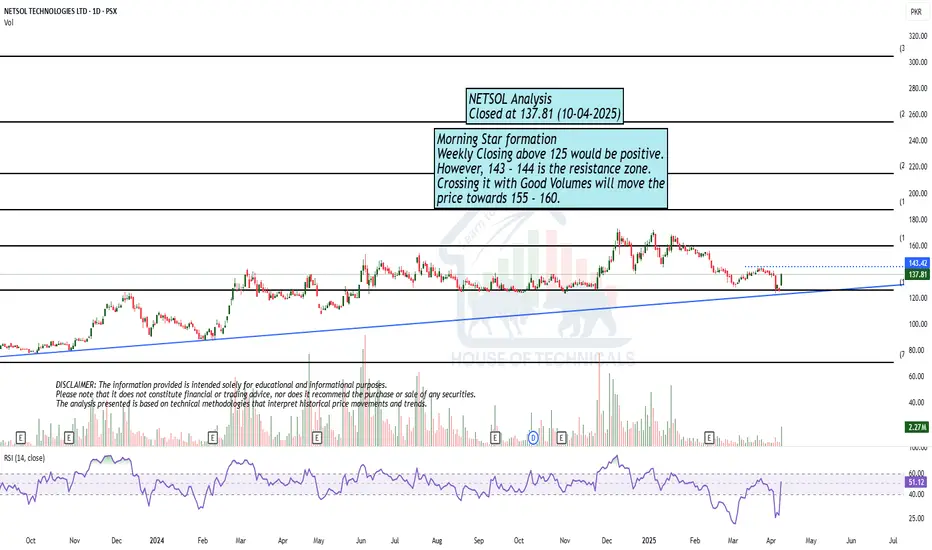
Morning Star formationMorning Star formation
Weekly Closing above 125 would be positive.
However, 143 - 144 is the resistance zone.
Crossing it with Good Volumes will move the
price towards 155 - 160.
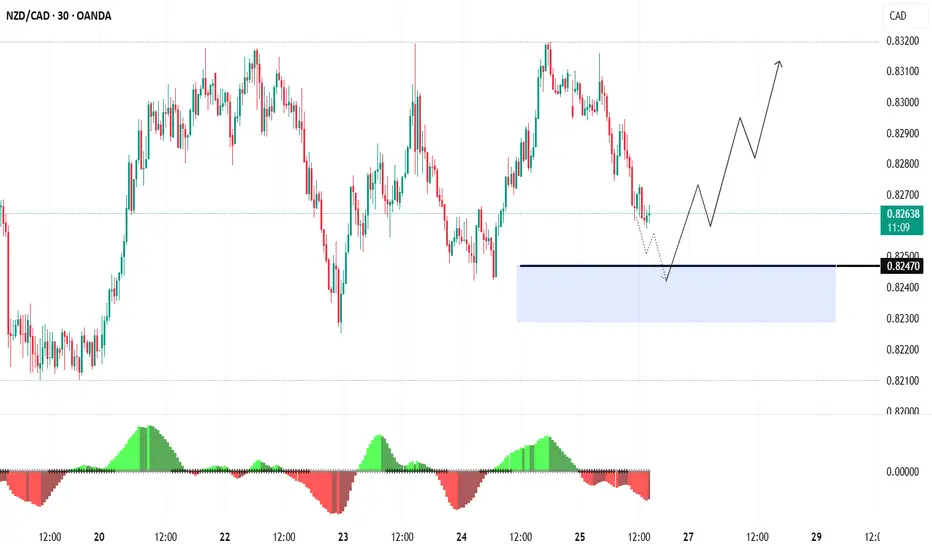
Short-Term Trade Setup: NZDCAD Eyes 0.82898–0.83110 TargetsGood day Traders,
Trust you are well.
Below is my analysis of NZDCAD.
Overview:
NZDCAD is retracing from the recent high at 0.83050, currently trading around 0.82628. Price action is approaching a key support zone between 0.82470 – 0.82285, an area that previously triggered bullish reactions. Momentum indicators are showing bearish pressure, with red histogram bars visible on the chart.
Idea:
Although bearish momentum is present, the histogram shows a slight decrease in selling pressure, hinting at a potential slowdown in the current downtrend. If the pair holds above the 0.82287 level, it could signal a potential reversal or bounce. This would open room for bullish targets at: 0.82898, 0.83039 and 0.83110.
However, a confirmed break below 0.82287 could expose the next support around 0.82100.
Conclusion:
The pair is at a critical support zone, with decreasing momentum suggesting that sellers may be losing strength. A bounce from current levels could provide a short-term buying opportunity, while a break below 0.82287 would invalidate the bullish outlook.
Cheers and happy trading!
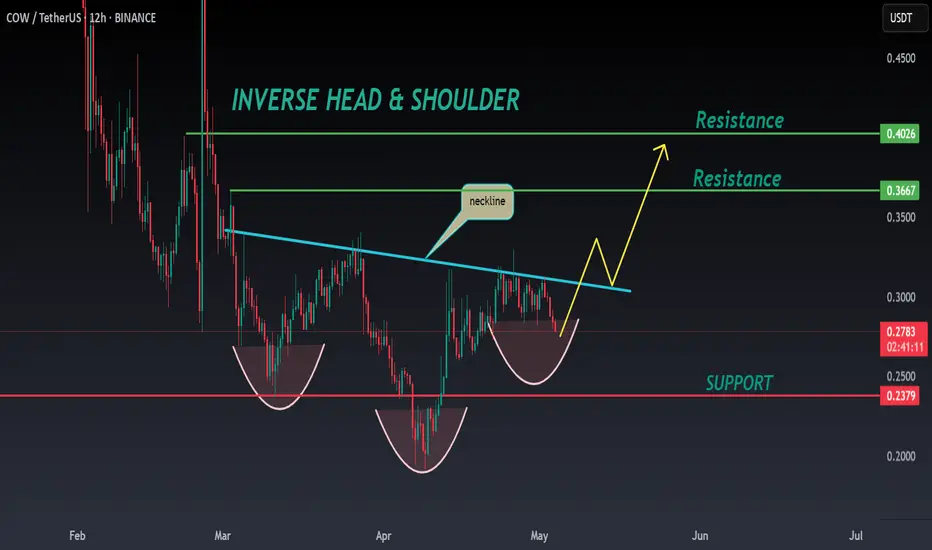
COW ANALYSIS🚀#COW Analysis : Pattern Formation
🔮As we can see in the chart of #COW that there is a formation Inverse Head And Shoulder Pattern and it's a bullish pattern. If the candle breaks and sustain above the neckline then a bullish move could be confirmed✅
🔰Current Price: $0.2790
⚡️What to do ?
👀Keep an eye on #COW price action. We can trade according to the chart and make some profits⚡️⚡️
#COW #Cryptocurrency #TechnicalAnalysis #DYOR
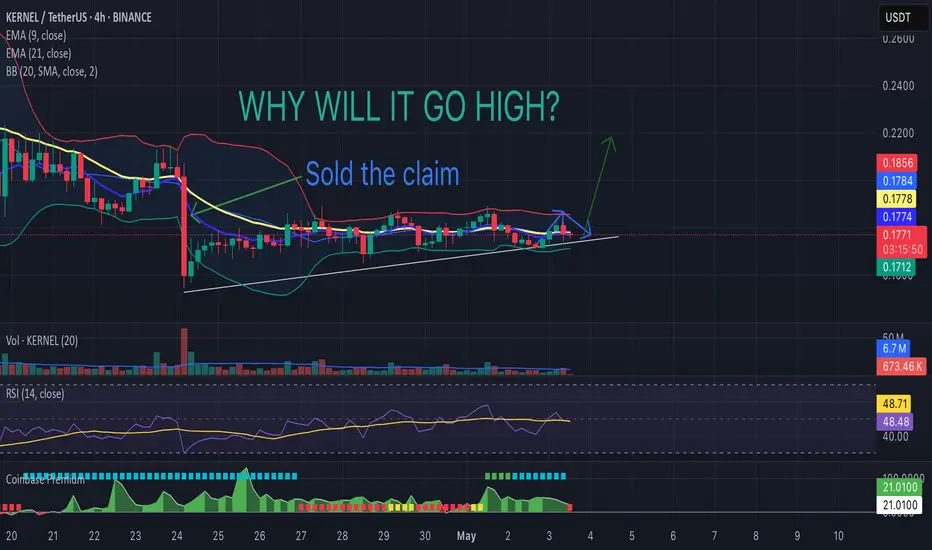
WHY WILL IT GO HIGH?Reasons indicating strong potential:
- Large and active community on social media
- High scammer activity
- Trap for inexperienced users: selling on DEX at 3x lower price than on CEX due to low DEX liquidity
Let me know if you'd like it even more formal or formatted for a report.
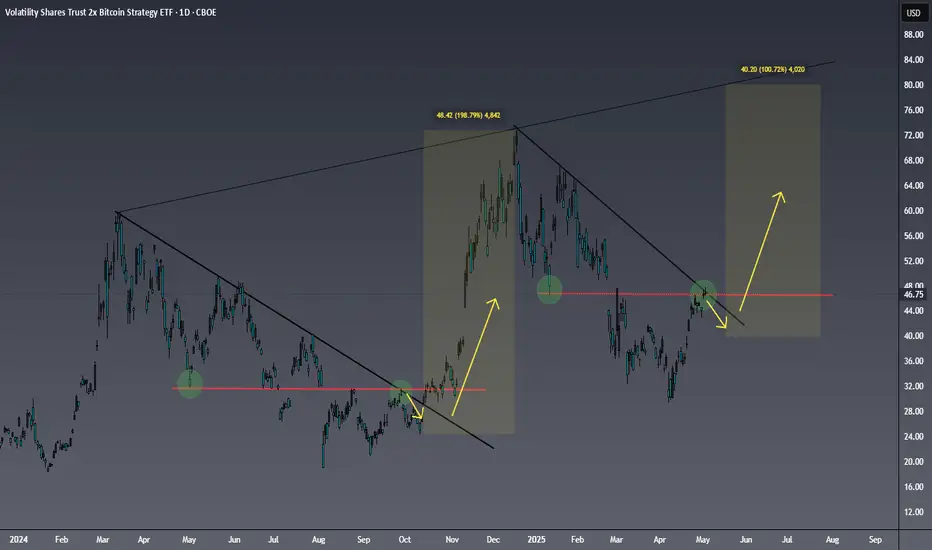
Bitcoin (BITX) getting ready for a parabolic move? Here is a chart of probably my favorite swing trade for the year.
I am keeping it simple with this chart though. I am a firm believer in simple when it comes to trading. I think the previous descension and breakout is playing out very similarly to the current one. Both had a double top rejecting from their respective trendlines following the initial breaks of structure. BITX is currently making its second tap of the the trendline. If it plays out like the previous structure did that would suggest w could see one more low in store.
I don't believe this to be the case but if it is this run could be postponed until the end summer/beginning of fall. I think it is more important to point out the relative strength in Bitcoin as of late, the weakness in the US dollar, as well as global liquidity having broke out months ago.
I think the most likely scenario is a pullback from this point which will be followed by a higher low printing. I will say I also expect this pullback to be steeper than the one from the previous descension. Bitcoin and Indices are a lot more overextended than they were last time around and the structure in indices is a lot weaker than before.
All this being said I am expecting a breakout to occur over the next several weeks just based off probabilities. It all depends on if BTC and indices and hold their respective demand/support levels. Bitcoin needs to hold 85k in order for a summer breakout to occur. For the S&P equivalent level this could be somewhere around 5200-5300.
If these assets are not able to hold these levels my confidence will shift pretty dramatically. I would still expect a major rally to take place around the Q4 timeframe but I would be expecting a lot less upside. Price would likely have to chop around for a while before deciding if it wants to continue to the upside. I am basing this off market structure/Dow theory. It is important to take all possibilities into account and ultimately let the charts do the talking.
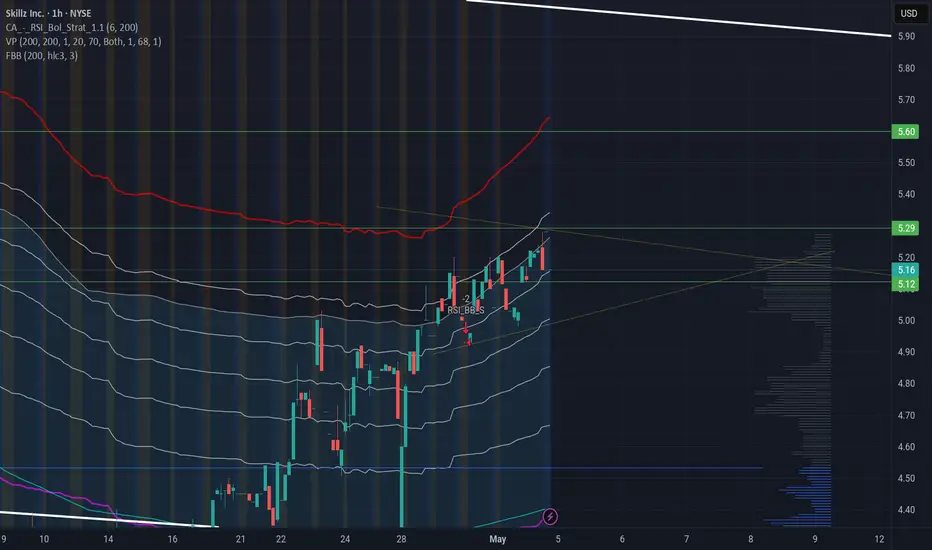
Sklz bull pendant!?5.60 by weds could be Monday if proper momentum
Let's go paradise and skillz holdinglong been here since 2020 and I. Not FKN leaving sklz to moon weekly chart Goals 156usd per share
Where my longs at! Not financial advice
AGL - Bowl chart with a Golden cross- AGL is in a long-term uptrend.
- AGL made a golden cross on 04.08.2025 (MA50 & MA200).
- The price chart is forming a bowl of patterns.
- Price now (05.01.2025): $3.93.
- Price target: $7.62.
If the bowl pattern fails, cut loss when the intraday price is below $3.66.
IMO, amateur trader.

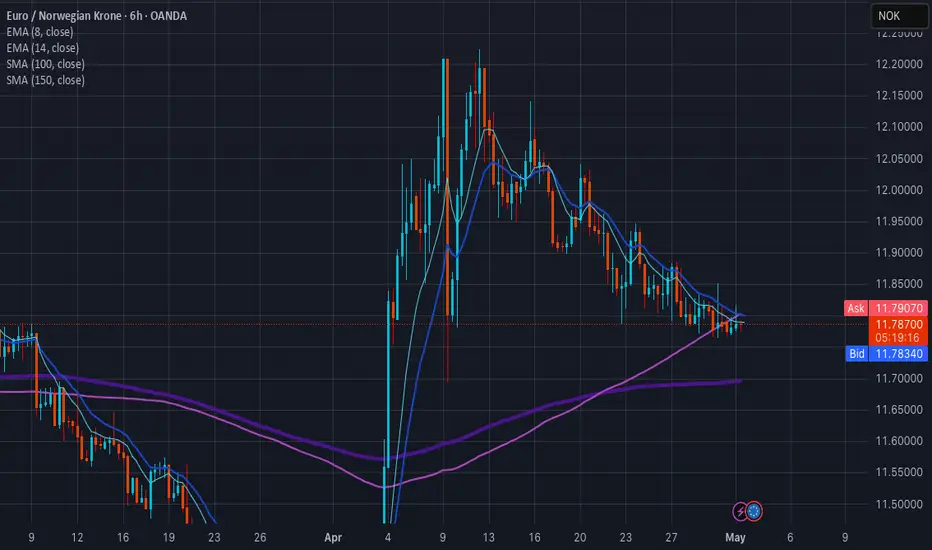
CONFUSION SETS IN.....Hello! You are looking at a 6 hour chart, here.
Starting out, we can see the 100 day moving average starting to ascend above the 14 day moving average, which indicates bearish momentum is building!
On the other hand, we can also see what appears to be a bullish pennant forming, which indicates bullish momentum to the upside.
As a disclaimer, I have not taken into account volume or any oscillators, but it appears this pair will be bullish for the short term, but bearish in the long term.
Depending on whether you are a long term or short term trader, I personally like what I am seeing from this 6 hour chart! Let me know if this was helpful for you! I love to read comments. Thank you for reading. Trade wisely.
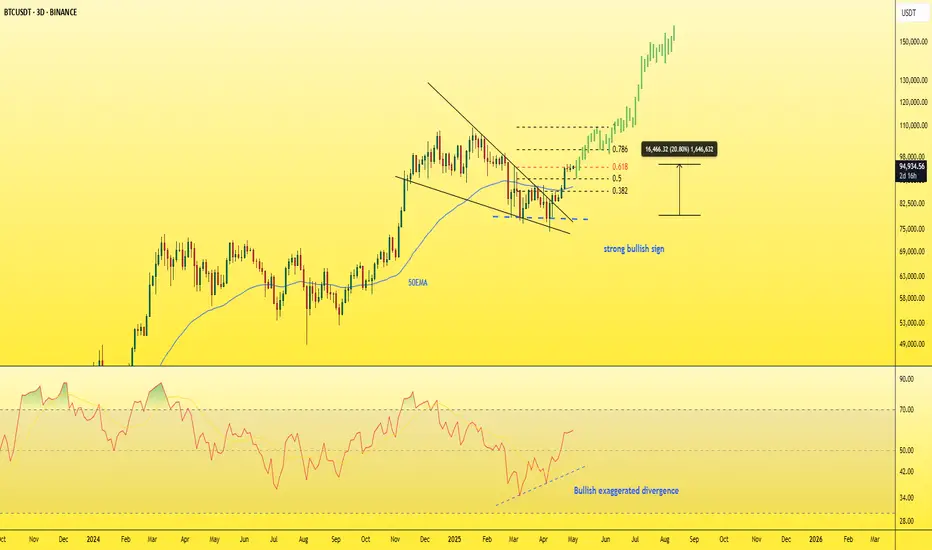
BITCOIN - A real bullish sign!3D chart shows a Bullush exaggerated Divergence on RSI indicator.
Bullish Exaggerated Divergence happen when:
1- Price: Forms a double bottom (two equal lows).
2- RSI: The second low is higher than the first.
- Implication: Momentum is picking up despite flat price, hinting at a possible upward reversal.
It's called exaggerated because price looks stable (same lows), but RSI reveals a hidden shift in momentum.
There’s also a breakout from a falling wedge pattern and a perfect break above the 50 EMA with a massive green candle.
We are now at the beginning of Bitcoin’s true bullish rally.
Best regards Ceciliones🎯
Wedge bullish breakoutl'm anticipating an upward breakout out of the wedge pattern but before the market buy im looking forward to see a false breakout to the downward and then reverse to the upward
Extremely Bullish.
Extremely Bullish.
Took Support from a very Important level around 136 - 140.
Hidden Bullish Divergence has appeared.
176 - 182 is a Resistance Zone.
Crossing & Sustaining 201, lead it towards 235 - 237.
On the flip side, 170 & 161 - 162 seems to be a Good Support level.

SUI A&E or pullback firstAs BTC is keeping the line it looks lik it will pump towards 100K. In that level we can see a pull back to cool off the RSI.
SUI is looking strong and made u huge revovery from the $1,70 level from the 7th of april. In teh 4 h Charts we cab see an Bull Flag pattern, wit a deviation of the high in this pattern.
We need to see the recovery of the $3,86 level that must get support in orde to stay bullisch on the short term. Isn't this leven in soon then we can expect more retracement in the price alle the way towards the MA100 around $2,95 or even the MA200 at a level of $2,55.

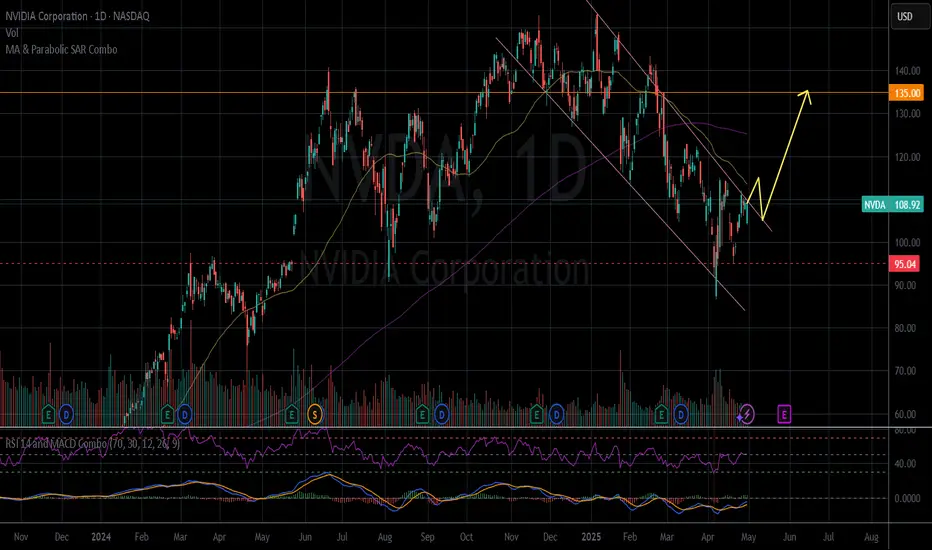
NVDA - BullishForecast a break-out up as the price increased by 3.3% in the after hours.
- The price area in a falling wedge, almost a descending channel.
- The MACD indicator in the Weekly frame shows an uptrend after a rare day of oversold (04.04.2025).
The price today (04.30.2025): $108.92.
Price target: $135.00.
Stop loss: $95.00.
IMO, amateur trader.
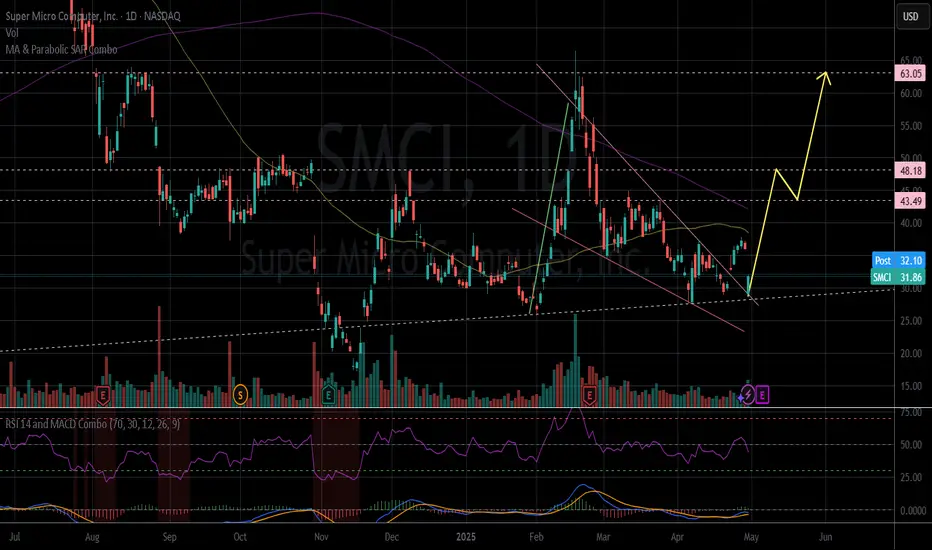
SMCI - Bullish Wedge Flag patternBullish Wedge Flag pattern
The price broke out on last week and has retested today.
In the chart of the week frame, the price is on the MA200 line.
The price now (Closed on 04.30.2025): $31.86.
Price target: $48.18/ $63.05
IMO, amateur trader.
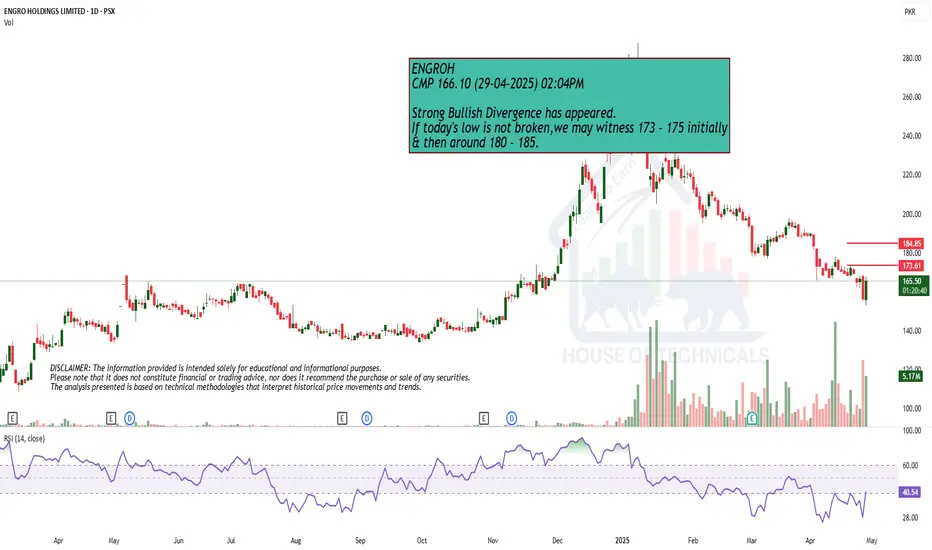
Strong Bullish DivergenceStrong Bullish Divergence has appeared.
If today's low is not broken,we may witness 173 - 175 initially
& then around 180 - 185.
KFin Technologies LtdCompany Snapshot:
Sector: Financial Services (Mutual Fund Services, RTA)
Market Cap: ₹21,000 Cr
Current Price: ₹1,239.20
Debt-to-Equity: 0.06 (very low)
ROE: 39% | ROCE: 49%
Financial Highlights:
Revenue Growth (3Y CAGR): ~22%
Profit Growth (3Y CAGR): ~32%
EBITDA Margin: ~48%
P/E Ratio: ~35x (TTM)
Industry Avg P/E: ~30-32x
Recent Price Action:
Stock broke out sharply in April 2025.
Support: ₹1,180 | Resistance: ₹1,300
RSI near 70 (mildly overbought, but momentum strong).
Key Strengths:
Dominant RTA player with 70%+ MF asset share.
Consistent cash flows and expanding international footprint.
High operating leverage driving margin expansion.
Key Risks:
Regulatory changes (SEBI reforms) could pressure fees.
High client concentration risk with top AMCs.
Valuation & Recommendation:
DCF Estimated Fair Value: ₹1,280–₹1,350
Recommendation: BUY on Dips / Accumulate
12-month Target Price: ₹1,320
Investment Horizon: 1–2 years
📈 Verdict: Strong business fundamentals, steady growth, and low debt make KFin Technologies attractive for long-term investors. Minor corrections can offer better entry points.
For Education Purposes only

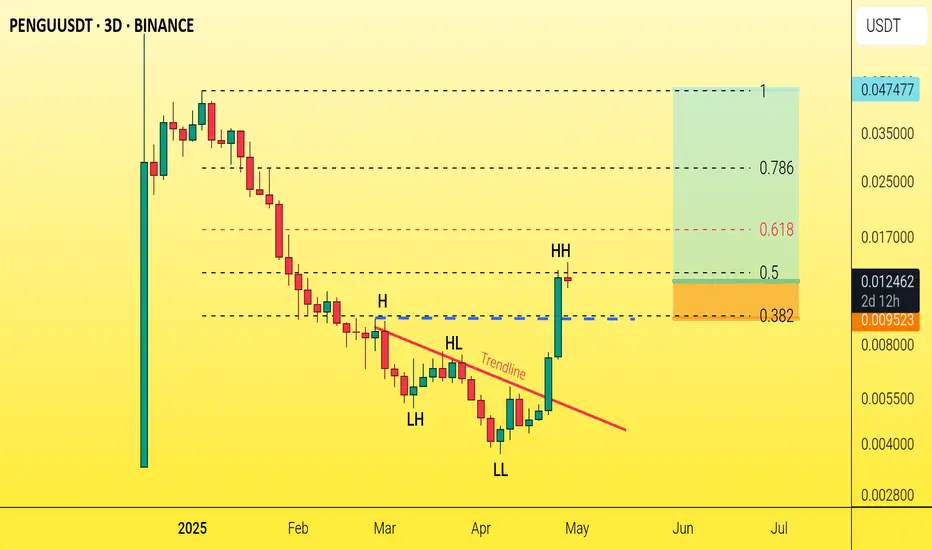
PENGUUSDT - strong signal to buy!PENGU is giving a very strong buy signal on the 3-day timeframe.
The main trend has been bearish for almost a full year, and this is the first time the coin shows a solid signal of a trend reversal — the red trendline has been broken, and the previous high (marked on the chart) has been taken out.
Breaking the trendline with a massive green candle is a strong confirmation for buyers' momentum in this area.
Taking out the high indicates a shift from a downtrend to an uptrend.
It’s crucial that the blue line (the broken high) does not get lost to the downside.
Best regards Ceciliones 🎯