Bullish Pennant on EUR/USD @ D1A bullish pennant has formed on the daily chart of EUR/USD. It can be used for an upside breakout setup. The pennant and its pole are shown with the yellow lines. My potential stop-loss level is marked with the red line (1.12662), it is placed at the low of the pennant area. My potential take-profit level is marked with the green line (1.17921), it is placed at the pole's length above the stop-loss. I will wait for a significant close above the pennant's border to consider trading this breakout.
Bullish Pennant

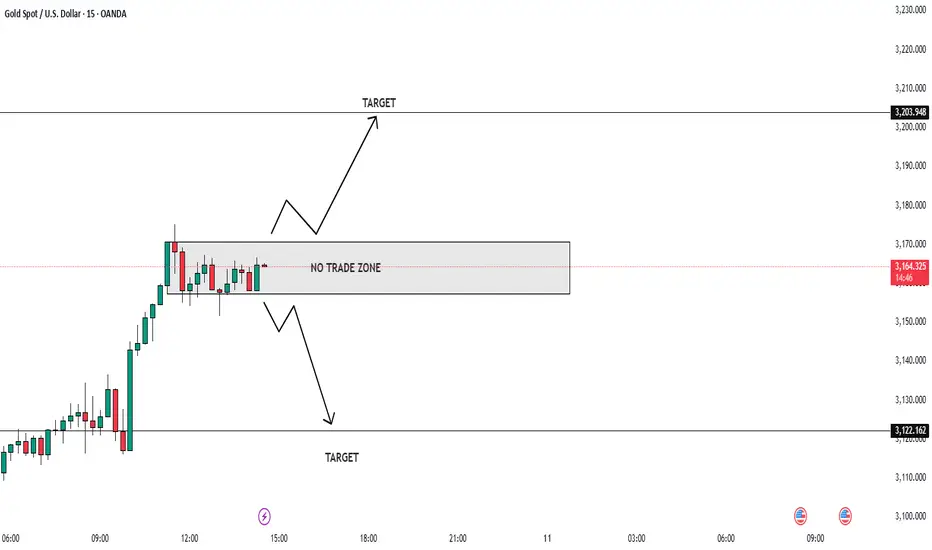
XAUUSD Alert: Critical Zones in Play — Trade Smart, Trade Safe!📊 XAUUSD Market Insight 🌍
Gold is heating up once again, currently testing a tight range between 3160 and 3174. A breakout in either direction could set the tone for the next big move.
🔻 If price breaks below, we may see a slide toward 3150 and 3130—potential areas to watch for bearish momentum.
🔺 However, a strong push above 3174 could spark bullish energy, aiming for short-term targets at 3200 and 3227.
💡 Trade Smart
The market is full of opportunity, but don’t forget: risk management is key. Use proper position sizing, set clear stop-losses, and never overexpose your capital. Stay sharp, trade safe, and let the market come to you. 🧠💼
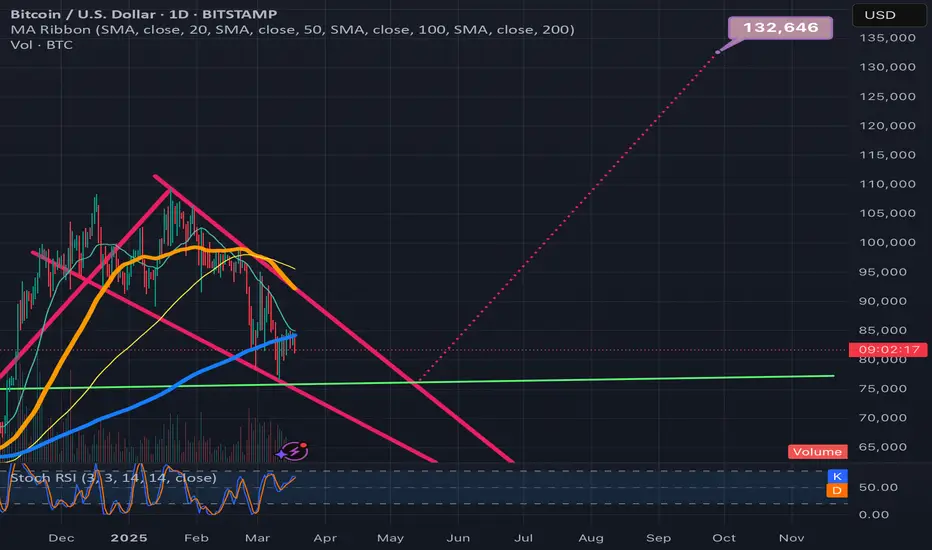
1day chart fallingwedge/bullish pennant on bitcoinI just posted a weekly version of this same pennant in the previous idea which I will link below, i wanted to also post the version of it on the 1day timeframe as well because the top trendline of the wedge on the 1day time frame has a different trajectory which lengthens the wedge considerably. With this longer wedge we can see that if it is the more valid for the 2 versions, that we probably wouldn’t be expecting a breakout until June at the earliest. Not quite sure yet which version of this wedge is ore valid so I’m posting both versions for now to keep and eye on them. For the weekly charts pattern to be the more valid of the 2, we will likely need to see the weekly 50ma continue to maintain support. *not financial advice*

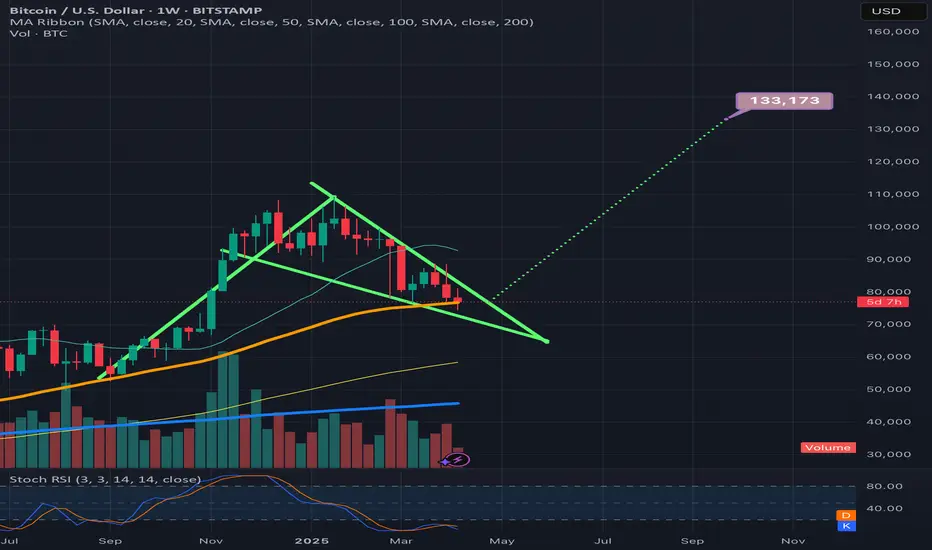
BTCUSD. Weekly bull pennantThe daily failing wedge’s top trendline is not as sharp of a trajectory as the the weekly timeframe’s and due to this, the daily time frames wege is noticeably longer, so I thinkI am going to post a follow p idea to this one that shows the longer version of the wedge, not sure which one is more valid yet at this current time. If the weekly 50ma(in orange) can hold support then we should break up from this wedge right around where I have placed the dotted measured move lne, in which case the breakout target would be around 133k, if the longer version of the wedge on the daily time frame is the more valid of the two then we will likely have to correct longer before we see a breakout. Will post the longer version n the very next idea post. *not financial advice*
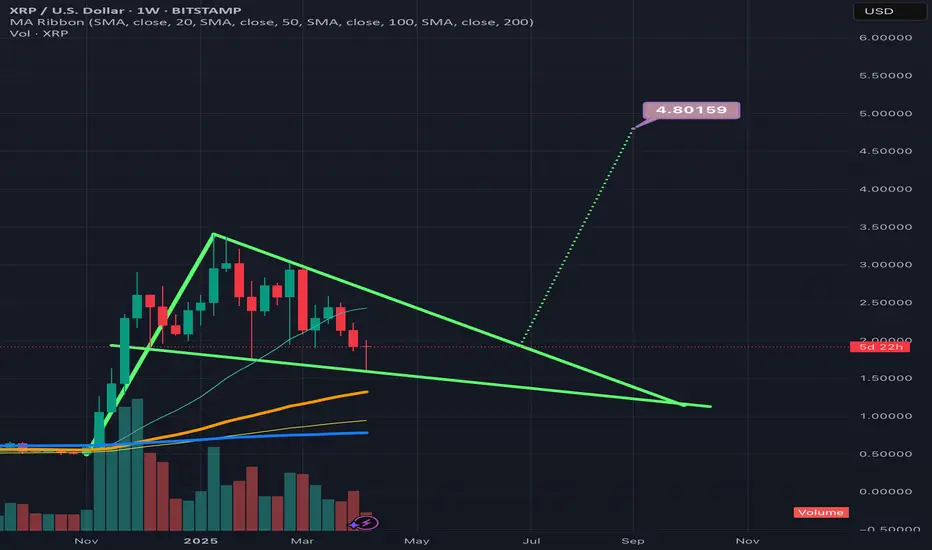
XRP just found bounce support on the bttm trendline of the wedgeLooking like a very valid pattern on the weekly hart. My guess is it will break upward somewhere around where I have arbitrarily placed the dottedmeasuredmove line, in which case the breakout target would be somewhere around $4.80 always a chance we retest the bottom trendline and even send a wick below. It before confirming a break upward though. *not financial advice*
XAU/USD Bullish Pennant Breakout - Trade Setup Toward Target📊 Overview:
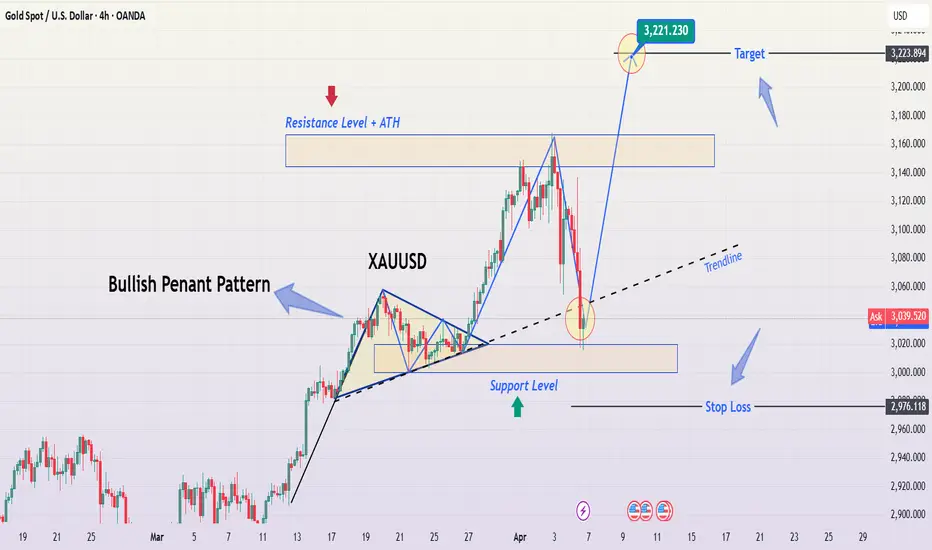
This 4-hour chart of Gold Spot (XAU/USD) presents a clean bullish pennant breakout followed by a corrective pullback to key support, offering a high-probability trading setup for bullish continuation traders.
Gold recently surged above the psychological $3,000 level, but after testing the previous resistance zone / ATH, it retraced back into a critical confluence of support. From a technical perspective, the structure remains bullish, supported by strong trendline dynamics, clean price action, and a well-defined pennant formation.
🔍 Step-by-Step Breakdown:
1. Bullish Pennant Formation
A bullish pennant is a continuation pattern that typically occurs after a strong upside rally (the "flagpole"). In this chart:
The flagpole began around March 13, with gold moving vertically from ~$2,630 to ~$2,950.
This was followed by consolidation between March 19–27, forming a symmetrical triangle pattern with converging trendlines (the pennant body).
Volume (if added) would typically decrease during this consolidation phase.
On March 27–28, price broke above the pennant, confirming the bullish bias.
📌 This breakout signals that buyers are ready to resume control after taking a breather.
2. Rally & Retest Phase
Following the breakout:
Price surged to challenge the resistance zone and all-time high (ATH) area, marked between $3,150 – $3,160.
A natural pullback occurred due to profit-taking and overbought conditions.
This retracement brought price back into the support zone at ~$3,000, intersecting perfectly with:
The rising trendline from the pennant breakout
A horizontal demand zone (former resistance turned support)
A key psychological level ($3,000)
💡 This zone acted as a confluence area, attracting buyers and creating a strong bounce — visible as a bullish engulfing candle.
3. Support & Resistance Analysis
✅ Support Level:
$2,990 – $3,010
Marked by previous highs before the breakout
Validated by the trendline and price reaction
🚫 Resistance / ATH Level:
$3,150 – $3,160
Historic resistance zone that capped the recent rally
Price must break this level for further continuation toward the target
4. Trendline Dynamics
The dotted trendline acts as a rising support structure.
Trendlines in bullish continuations are crucial as they confirm upward momentum.
As seen on the chart, price respected the trendline during the recent dip and bounced with strong momentum — a bullish signal.
5. Trade Setup & Risk Management
A trade based on this structure should follow strict risk-to-reward discipline.
🛒 Entry Zone:
Ideal re-entry lies between $3,030 – $3,040, after confirming the bounce from support.
❌ Stop Loss:
Below $2,976, which is under the support zone and trendline. If price breaches this level, the pattern is invalidated.
🎯 Target:
Measured move (height of the flagpole) projected from breakout zone gives us a target of around $3,221.
The chart also marks this clearly as the "Target" zone.
📈 Risk-to-Reward Ratio: Approximately 1:3, which is attractive for swing trades.
6. Market Psychology & Trader Sentiment
The bullish pennant represents temporary indecision, but ultimately market confidence remains strong.
The pullback to support reflects healthy profit-taking, not bearish reversal.
The bounce from support shows buy-the-dip mentality, a sign that bulls remain in control.
7. Macro & Fundamental Backdrop
While the chart is technical, it's wise to factor in macro catalysts:
🏦 Federal Reserve policy: If the Fed holds or cuts rates, gold typically rallies due to lower opportunity cost.
📉 Inflation Data: Rising inflation or expectations can push gold higher as a hedge.
🌍 Geopolitical tensions: Conflicts or economic instability drive safe-haven flows into gold.
Staying updated on these events can help validate or hedge your technical outlook.
✅ Conclusion:
This chart presents a technically sound bullish continuation setup backed by:
A breakout from a bullish pennant
A retest and bounce from a confluence support zone
A clearly defined risk (stop loss) and reward (target)
Traders looking for medium-term opportunities in XAU/USD can consider this as a high-probability setup with logical structure and strong momentum potential.
🔔 TradingView Tag Suggestions:
#XAUUSD #Gold #TechnicalAnalysis #BullishPennant #PriceAction #SwingTrade #Forex #TradingSetup #Commodities #GoldBreakout
NFP BIG BULL SETUP BREAKOUT ALERT!🔥 Market Update for Traders! 🔥
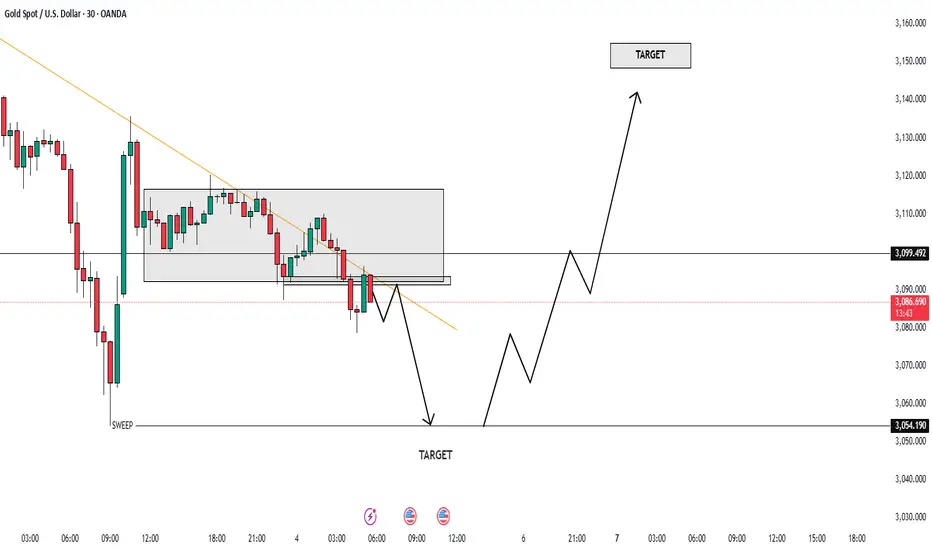
Right now, the market is showing BEARISH momentum, and it's looking like we're heading for a dip. We could see the market fall and sweep the area around 3052 👀. Once that happens, expect a *huge* bounce back as the market could be getting ready to **shoot to the moon 🚀🌕!
🛑 KEY BUY LEVEL: 3130 - This is where you want to be ready to go long! 📈
🎯 First Target: Once we hit 3130, eyes on the ATH (All-Time High) for the retest! 🙌 And from there, we're eyeing a target at 3200 🚀🔥.
💥 NFP News Incoming! 💥
After Trump's speech, gold could *fall* around 1000 pips ⬇️, but **NFP could trigger a huge pump 📊💥. Stay sharp and trade with caution.
💡 Risk Management is KEY! Always follow your plan, set stop losses, and protect your capital. Don't let emotions drive your decisions! 📉🔑
Trade smart, stay sharp, and let's get those gains! 💸💥
#BearishMomentum #BullishReversal #RiskManagement #GoldPrice #NFPAlert
Gold (XAU/USD) Bullish Breakout: Next Target $3,181?"Key Observations:
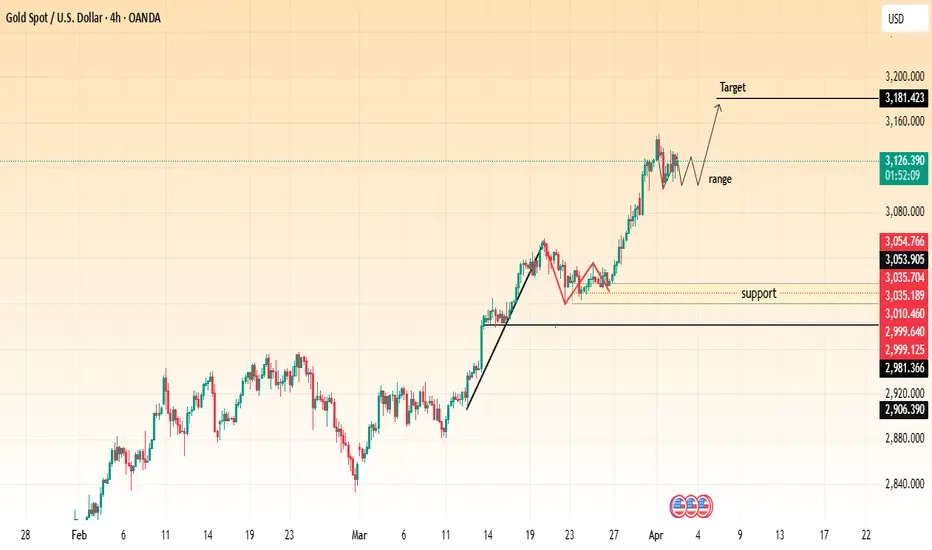
Current Price: Gold is trading at $3,127.450 at the time of the chart.
Trend: The chart exhibits a strong uptrend, with higher highs and higher lows.
Support Levels: Several support levels are marked in the $3,010 - $2,999 range, extending down to around $2,906.
Resistance and Target:
The immediate price range is highlighted, suggesting possible consolidation.
A breakout above this range could lead to a target around $3,181.
Chart Annotations:
A retracement (red structure) indicates a short-term correction before continuation.
A breakout structure (black lines) suggests a previous significant upward movement.
The range and possible continuation are marked, indicating that the price may consolidate before attempting to reach the target.
Trading Perspective:
If price holds above the range, we may see bullish continuation towards $3,181.
A break below support levels could signal a deeper pullback towards $3,010 or lower.
This chart suggests a bullish outlook, with potential for more upside if momentum continues. Traders might look for confirmations before entering long positions.
Gold Spot (XAU/USD) Analysis: Bullish Pennant Breakout to Target1. Overview of the Chart
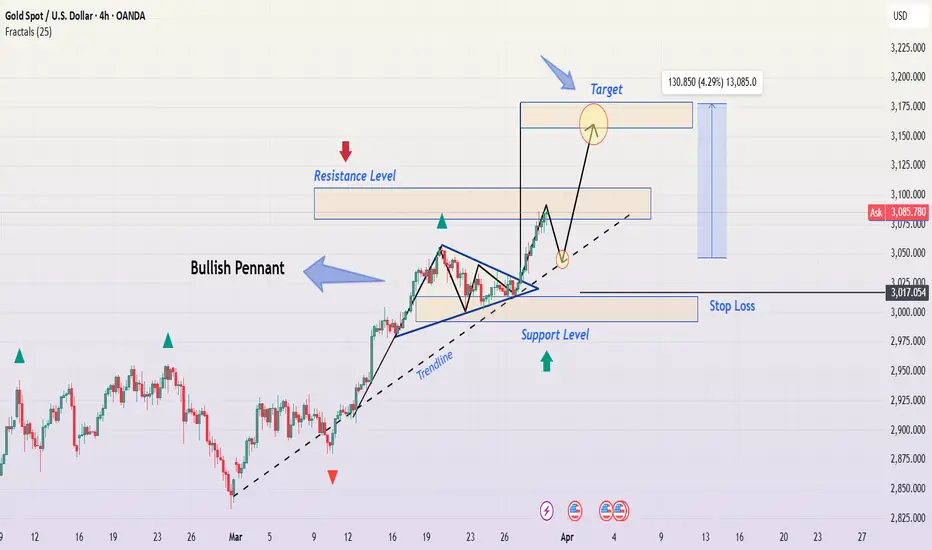
This 4-hour chart of Gold Spot (XAU/USD) presents a bullish pennant pattern, which is a strong continuation formation, indicating that the price is likely to continue its upward trajectory. The price action has followed a clear trend structure, and we can identify key support and resistance levels, breakout points, and potential profit targets.
This analysis provides a comprehensive breakdown of the chart setup, including:
The technical pattern formation
Key support and resistance zones
Trade setup with an ideal entry, stop loss, and profit target
Risk management considerations
Market conditions and external factors to monitor
2. Breakdown of the Chart Pattern: Bullish Pennant Formation
Understanding the Bullish Pennant Pattern
A bullish pennant is a continuation pattern that occurs after a strong upward movement (known as the "flagpole"). The market then consolidates within a small triangular shape, forming the pennant. This consolidation is seen as a temporary pause before the next bullish move.
Key Characteristics of the Pennant in this Chart
Flagpole Formation:
The steep rally before the pennant formed represents a strong bullish impulse, driven by increased buying pressure.
This rapid price increase set the foundation for the pennant pattern.
Consolidation (Pennant Formation):
Price action moved within converging trendlines, forming a symmetrical triangular pattern.
The market temporarily paused, as some traders took profits while others awaited further momentum.
This type of consolidation is common before the price resumes its trend.
Breakout from the Pennant:
The bullish breakout above the upper trendline of the pennant confirms the continuation of the uptrend.
A strong breakout suggests renewed buying interest, likely pushing prices toward the next resistance level.
3. Key Technical Levels on the Chart
A. Resistance Level (Potential Selling Zone)
A critical resistance zone is marked between $3,100 - $3,125, where selling pressure could emerge.
If the price faces rejection in this zone, a temporary retracement could occur before another push higher.
A breakout above this resistance level would further strengthen the bullish case, possibly pushing gold toward the $3,175 - $3,200 range.
B. Support Level (Demand Zone)
The support zone is around $3,025 - $3,017, which is the last significant swing low.
This level represents a strong buying area where traders may look for re-entry on a pullback.
A break below this support could invalidate the bullish setup, signaling a shift in market sentiment.
C. Trendline Support (Dynamic Support)
The dashed black trendline represents an uptrend support.
If price retraces toward this level and holds, it may offer another buying opportunity before resuming its uptrend.
A break below this trendline would be a warning signal, suggesting a weakening of bullish momentum.
4. Trade Setup and Execution Strategy
A. Entry Strategy
The ideal entry point was upon the confirmed breakout above the pennant, around $3,075 - $3,085.
Aggressive traders may have entered at the breakout itself.
Conservative traders may wait for a pullback to retest the breakout zone before entering, ensuring confirmation.
B. Stop Loss Placement (Risk Management)
A stop loss is placed below the support zone at $3,017 to minimize downside risk.
This placement protects against false breakouts or unexpected market reversals.
Keeping a tight stop loss allows for a higher risk-to-reward ratio while maintaining a disciplined approach.
C. Profit Target Projection (Expected Price Movement)
The target price is determined using the measured move approach, where the height of the flagpole is added to the breakout point.
The expected profit target is in the range of $3,175 - $3,200, offering a potential upside of 4.29% from the breakout level.
If price maintains its bullish momentum, further gains could be expected beyond the target zone.
5. Risk Management & Considerations
A. Risk-to-Reward Ratio (RRR)
This trade setup provides a favorable risk-to-reward ratio (RRR).
With an entry near $3,085, a stop loss at $3,017, and a target around $3,175, the trade offers a reward-to-risk ratio of approximately 3:1.
This ensures that even if the trade does not succeed, the risk is controlled while allowing significant upside potential.
B. Factors That Could Invalidate the Setup
Failure to sustain the breakout: If price falls back below the pennant, the setup may be invalid.
Break below the support zone ($3,017): This would signal a possible trend reversal.
Weak volume on breakout: A lack of volume could indicate a false breakout, leading to price retracement.
C. Alternative Trade Scenarios
Scenario 1: Retest & Continuation:
If price pulls back to retest the breakout zone ($3,075 - $3,085) and holds, traders can look for another buying opportunity.
Scenario 2: False Breakout & Reversal:
If price falls below the support level ($3,017), traders should exit long positions and re-evaluate market conditions.
6. Market Conditions & External Factors to Monitor
A. Gold’s Correlation with USD & Interest Rates
Stronger USD → Downward Pressure on Gold
Weaker USD → Bullish Gold Trend
Interest rate decisions from the U.S. Federal Reserve play a significant role in gold prices.
B. Economic Events & News Impact
Inflation Reports: Higher inflation often supports gold prices.
Geopolitical Tensions: Political instability can lead to increased demand for gold as a safe-haven asset.
Stock Market Movements: A weaker stock market can drive capital into gold.
7. Conclusion: Bullish Outlook with Cautious Optimism
Key Takeaways:
✔ Bullish pennant breakout confirmed – strong continuation signal.
✔ Price is above key support & trendline – maintaining bullish structure.
✔ Clear trade plan with entry, stop loss, and target levels.
Trading Plan Summary:
Entry Stop Loss Target Risk-Reward Ratio
$3,075 - $3,085 $3,017 $3,175 - $3,200 3:1
📌 Final Recommendation:
Maintain a bullish bias as long as price holds above the support zone ($3,017).
Watch for volume confirmation to ensure the breakout is valid.
Adjust stop loss or secure profits if price reaches key resistance levels ($3,100 - $3,125).
If you need further clarification or alternative trade scenarios, let me know! 🚀
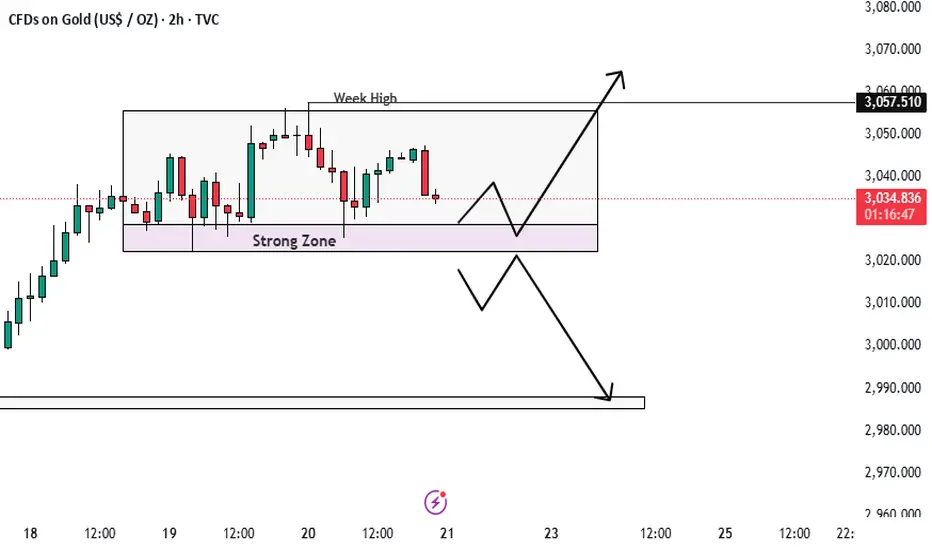
STRONG REVERSAL COMMING FROM NEW ATH ALERT!📈 Description:
This is a 2-hour timeframe analysis of Gold, the market is currently consolidating between a strong support zone 📉 and a weekly high resistance level 📈. Two possible breakout scenarios can be expected:
✅ Bullish Scenario: If the price holds the strong zone at 3028 and gains momentum, it may break out above the weekly high 🚀.
❌ Bearish Scenario: If the price breaks below this strong support zone i.e 3028, it could trigger a downward move toward a lower support level 📉.
👀 Traders should watch for breakout confirmations before entering trades! 📊📉📈
follow risk management
The THETA chart sure has a story to tell!*"Here is a copy of my latest THETA chart, which I recently covered. There is a lot of information to be discovered simply by looking at it and drawing the proper conclusions. This will be one to watch as we move forward into the 'April flash crash' thesis I have been widely discussing.
Even if it doesn't materialize as I've theorized, there are still some interesting developments that could be coming regarding the future of this asset.
Good luck, and always use a stop loss!
Another look at the wedge/pennant I just postedI decided to do a second chart idea on the pennant I posted in the last chart, this tme including the super pivotal support trendline and moving the emasured move line to the point that support line crosses over the top trendline of the wedge. Will be interesting to see if either of these measured move line projections from this dea and the last one play out. *not financial advice*
Falling Wedge/Pennant on BitcoinThe full wedge extends all the way into August. I certainly hope we break up from it well before then. I place the measured move line around where I think we old break upward from if we can flip the 200ma back to solidified support. It of course could actually take much longer to break up from the wedge but even if it did the lowest price of the wedge is really not that terrifying in my opinion and would instead just be a phenomenal buying opportunity if we were allowed to accumulate mote that cheap. Because of other major supports not shown here however going below 70k for anything but an extremely brief wick seems an incredibly low probability. *not financial advice*

#1000CHEEMSUSDT is setting up for a breakout Long BINANCE:1000CHEEMSUSDT.P from $0,0014000
🛡 Stop loss $0,0013740
1h Timeframe
⚡ Plan:
➡️ POC is 0,0013254
➡️ Waiting for consolidation near resistance and increased buying activity before the breakout.
➡️ Expecting an impulsive upward move as buy orders accumulate.
🎯 TP Targets:
💎 TP 1: $0.0014380
💎 TP 2: $0.0014700
🚀 BINANCE:1000CHEEMSUSDT.P is setting up for a breakout—preparing for an upward move!

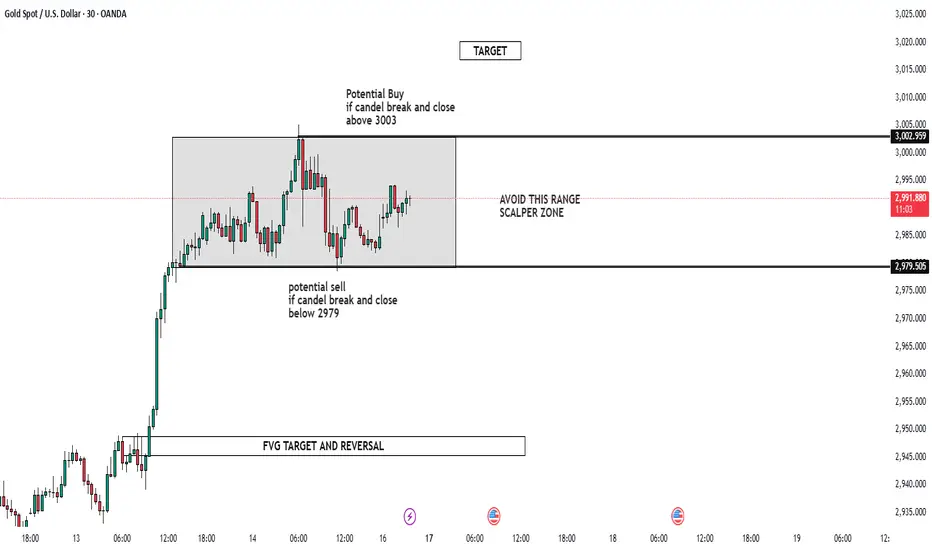
WELCOME 3000 GOLD WILL GOLD MARK NEW ATH AGAIN!🔥 Attention Traders! 🔥
XAUUSD is heating up! Here's the latest analysis:
🔻 Bearish Setup: Watch for a potential decline if the price breaks below 2979-3003. Key targets: 2960 & 2945.
🔺 Bullish Setup: A breakout above 2911 could signal buying opportunities! Keep an eye on these targets: 3015 & 3030.
📉 Risk Management: Always protect your capital by setting stop-losses and adjusting position sizes based on your risk tolerance. Trading with discipline is key to success!
📊 Stay Engaged: Share your thoughts and strategies as we navigate through this volatile market. Let’s aim for new highs while managing risk effectively! 💵🚀
NEWS MOVE ALERT PPI AND UNEMPLOYEEMENT CLAIM.🚨 Gold Trading Update 🚨
Hey Traders! 👋
Here's the current scenario: Gold is heading towards the 2950-2955 level. Expect a possible fake-out, followed by a sharp drop. 📉
🔍 Key Insight: There’s an FVG on the H1 chart, signaling a potential sell-off before we see another GOLD rally. 🚀
Today’s News: PPI report 📊 drops, so expect a significant market move! Gold might respect the FVG and target these levels for a potential buy:
👉 2970
👉 2980
👉 3000
⚠️ Tip: Follow my strategy and always use proper risk management with a 1:2 risk-to-reward ratio. 💡
Happy Trading! 💰📈

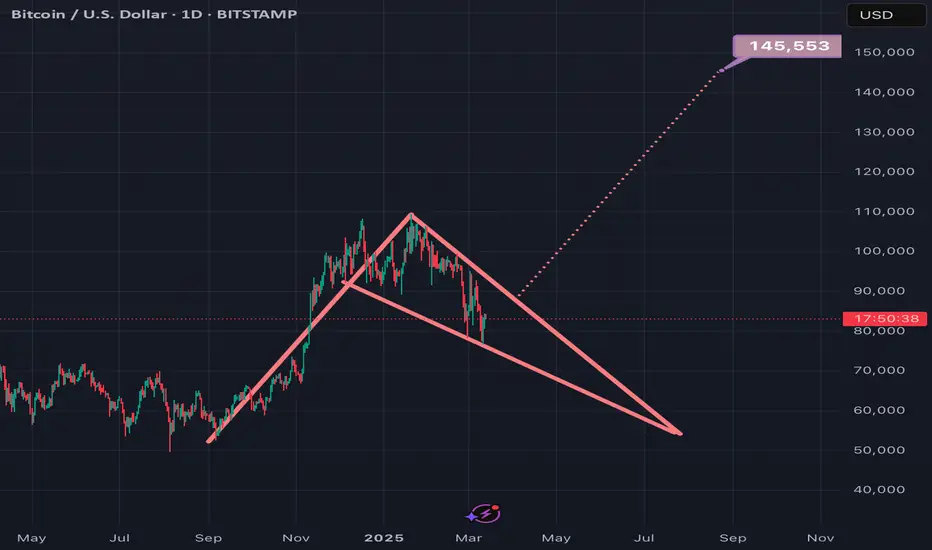
Bitcoin in a falling wedge / bull pennant It’s hard to say where it will. Break up from ths pennant, I put the dotted measured line in an arbitrary spot which will almost certainly have to be readjusted and most likely further down than where I placed it but if it were to somehow break up from the wedge by then and confirm that breakout the target would be in the 145k zone. *not financial advice*
Gold (XAUUSD) Breakout Setup – Targeting $3,014Gold is showing strong bullish momentum on the 1H timeframe, forming a breakout structure with a well-defined resistance and support zone.
Key Levels:
📌 Resistance: Around $2,940 (previous rejection zone)
📌 Support: Around $2,900 (previous consolidation zone)
📌 Target: $3,014 (+3.16% move)
Technical Analysis:
🔹 Gold recently broke out of a bullish flag pattern after a strong uptrend.
🔹 Price successfully retested the support zone and is now pushing higher.
🔹 A breakout above $2,940 could trigger a sharp rally towards the $3,014 target.
🔹 Volume confirmation and strong momentum support further upside potential.
Trade Plan:
✅ Long above $2,940 with a target of $3,014
❌ Stop-loss below $2,900 to protect against fake breakouts
Gold remains bullish, and if the price holds above the breakout zone, we could see a strong move higher! 🚀

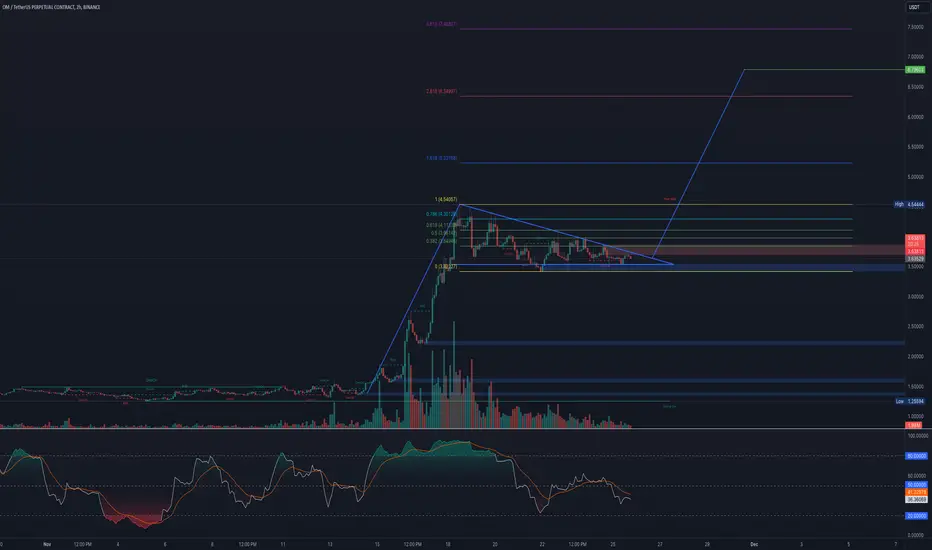
$OM Bullish pennantBINANCE:OMUSDT is currently doing a bullish pennant pattern after an explosive move from 1.67 area. A break of this pennant could send BINANCE:OMUSDT price parabolically to around 6.40 - 6.80 area, measured using the length of the pole in confluence with 2.618 fib level.
In a typical retrace on a continuation move towards the upside, volume tends to dry out, signalling that a move may be due sooner than later. In futures, BINANCE:OMUSDT.P O/I continue to hover around $14M which is a good sign given the sentiment of the market towards premium RWA projects, with a positive L/S ratio.
On the flipside, a break of the lower level will only continue the current ranging move of BINANCE:OMUSDT towards 3.30 - 3.50 area.
Given that the market is still focusing on BTC, BINANCE:OMUSDT will continue to move in a laggard fashion, therefore there is still time to find a long entry near 3.55 - 3.63 area. Once money shifts towards alts, this will propel BINANCE:OMUSDT to new ATHs.
As always, manage your risks.
GL!
- JD
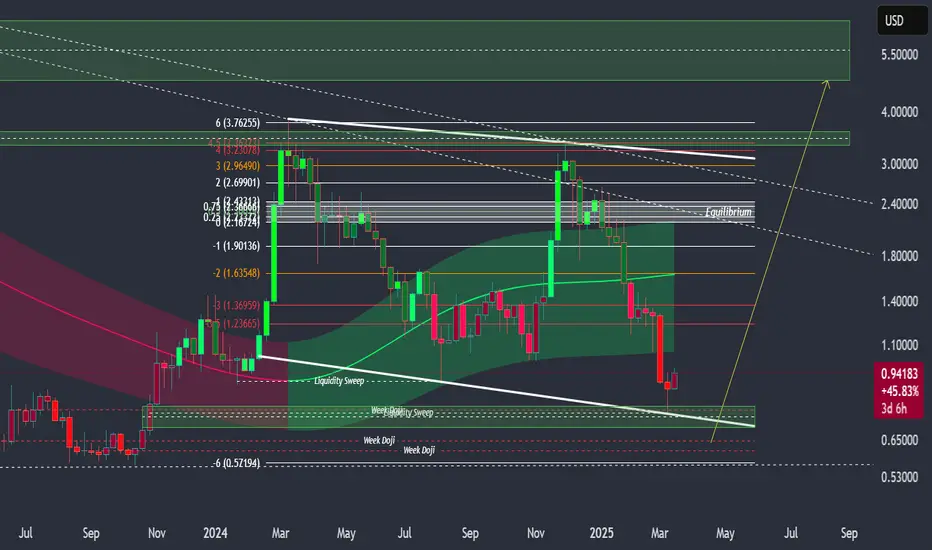
XCN has serious breakout potential on the 5th wave count.XCN went on a massive run over the past few months, followed by a significant decline along with the overall crypto market. The chart, however, is telling a story of what could become a massive move to the upside on the 5th wave of the wedge pattern's internal wave count.
I wouldn't count XCN out just yet. I think good things are coming to XCN in the future, even if the 5th wave ends up failing this time around.
Good luck, and always use a stop loss!

The SECRET to BULLISH CHART PATTERNS | EducationBullish chart patterns play out towards the upside... atleast most of the time.
In some cases, a bullish pattern forms - seemingly strong- but ends up going the complete opposite direction. There is a way to navigate this very frustrating outcome - by waiting for confirmation.
Through waiting a little longer, you will surely reduce the profits - but this greatly reduces the risk of playing a "failed" pattern.
Keep a close eye on this bullish chart pattern forming on SUI:
__________________________

Is History Repeating? XAUUSD on the Verge of a Breakout!📌 Description:
Gold's price action is aligning with a familiar historical pattern, hinting at a potential breakout. Let’s break it down:
1️⃣ Historical Precedent – Looking back, a similar market structure led to a significant bullish move. Recognizing these patterns can provide an edge in anticipating market behavior.
2️⃣ Recurring Structure – Once again, the chart is shaping up in a way that mirrors past price action. If history is any guide, this could be a pivotal moment.
3️⃣ Bullish Pennant Formation – The current price action suggests the formation of a bullish pennant, a classic continuation pattern. When combined with historical context, the probability of a breakout strengthens.
🔍 Fundamental Factors:
- Geopolitical Uncertainty: Rising tensions and macroeconomic instability continue to drive demand for gold as a safe-haven asset.
- Interest Rate Expectations: With potential shifts in central bank policies, any dovish signals could fuel further upside in XAUUSD.
- Inflation & USD Strength: Any weakness in the dollar or persistent inflation could further support gold’s bullish case.
⚡ Is this the next major move for gold? Let’s discuss! Drop your thoughts below! 👇

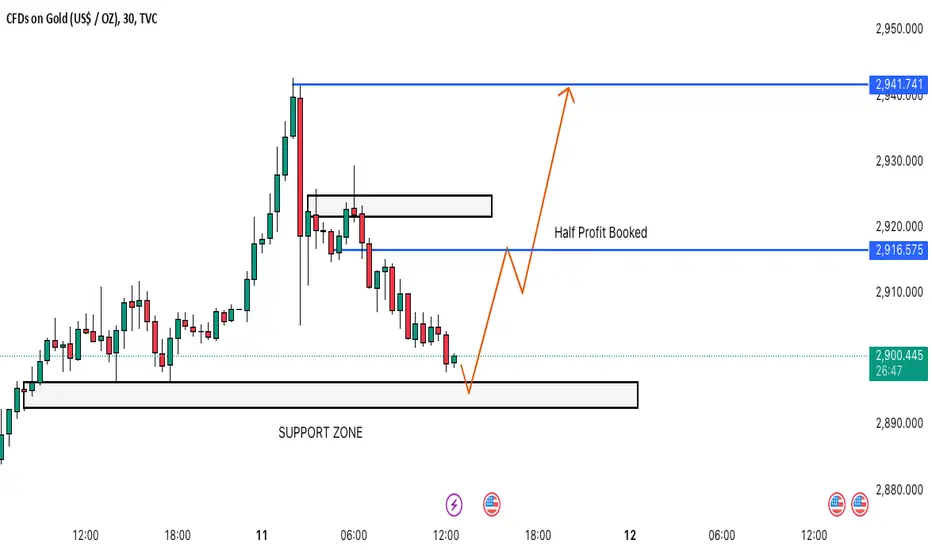
XAUUSD BULLISH PATTERN CHARTHEY,
all my trader friends if you see m30 there is strong support at 2895 to 2899 so posible to gold fall and retest the area of this level and pull back to 2915.
if powell speaks is good for currency that time so we see gold fall wanna gold again buy from 2895.
BUY scenerio target 2916 this position all trader booked their 50% profit and half for continue to 2940