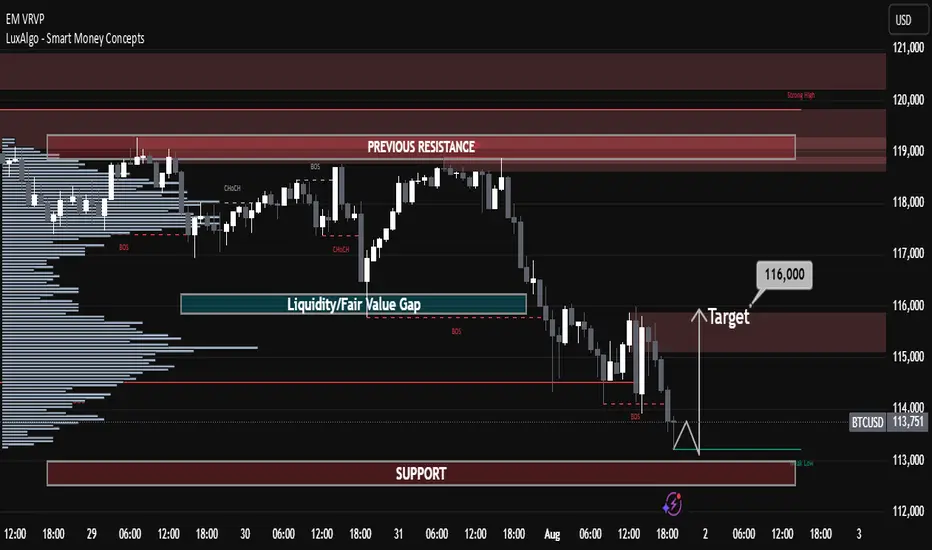
BTCUSD Technical Analysis (Smart Money Concepts) BTCUSD Technical Analysis (Smart Money Concepts)
Market Structure Overview:
Break of Structure (BOS) observed multiple times confirms a strong bearish trend.
Change of Character (CHoCH) around 30th July indicated initial shift from bullish to bearish intent.
Price has been forming lower highs and lower lows, respecting the bearish structure.
Key Zones:
🔴 Previous Resistance Zone (119,000 - 120,500)
Strong supply area from where price sharply reversed.
Also aligned with a Strong High marked at ~$120,000 – key for any future bullish invalidation.
🟫 Current Target Zone – 116,000
Acts as an immediate imbalance fill/FVG retracement zone.
Target highlighted as potential retracement point before continuing lower.
🟦 Liquidity / Fair Value Gap (FVG) Zone
Located between ~115,800 and 114,500.
Price may aim to revisit this zone on pullback, filling inefficiencies.
🟩 Support Zone (~113,000)
Price currently reacting near this zone.
This area has acted as a demand zone in the past and is expected to provide short-term support.
Volume Profile & Order Flow:
Visible Range Volume Profile shows heavy activity near the resistance cluster, indicating strong distribution by institutional players.
Low volume in the FVG area further confirms inefficiency and potential for a retracement move.
Smart Money Perspective:
The current structure reflects distribution at highs, followed by markdown phase.
Price swept liquidity below local lows and may now seek to mitigate previous supply or FVG around 116,000 before resuming bearish trend.
📌 Conclusion:
Bias: Bearish until 116K is tested and rejected.
Next Move Expectation: Possible liquidity sweep → bounce to 116K → short continuation.
Invalidation Level: Break and close above 117K would signal strength returning.
✅ Educational Note:
This is a classic Smart Money trap setup — liquidity grab near lows, fakeout pump to FVG, and potential short continuation. Traders should be cautious of fake rallies into known supply zones.
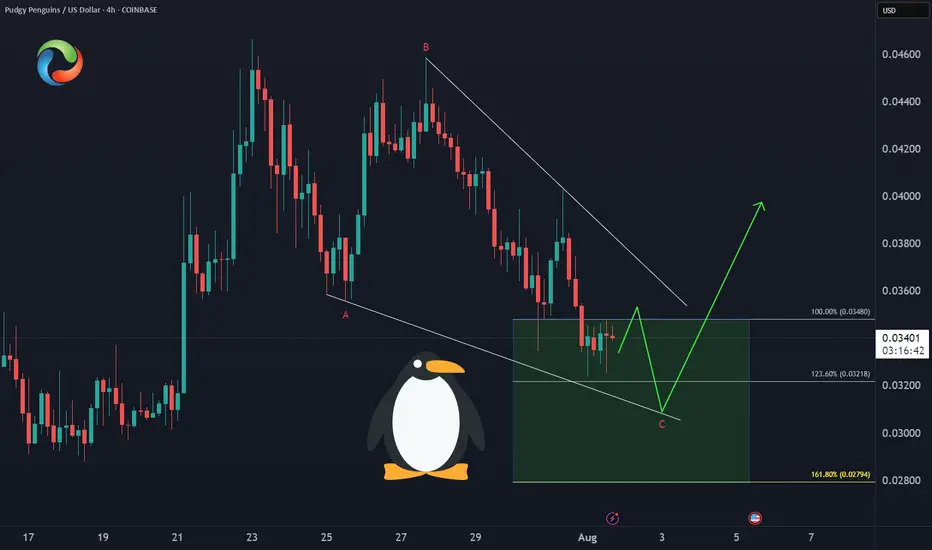
Bullishsetup
PENGU Enters Demand ZoneCOINBASE:PENGUUSD 🐧Price has developed a clean A-B-C correction into the equal legs support zone at $0.034-$0.028, offering:
✅ Optimal risk/reward entry
✅ Wave structure confirmation
✅ Higher low potential
This is the technical sweet spot for the next rally leg.
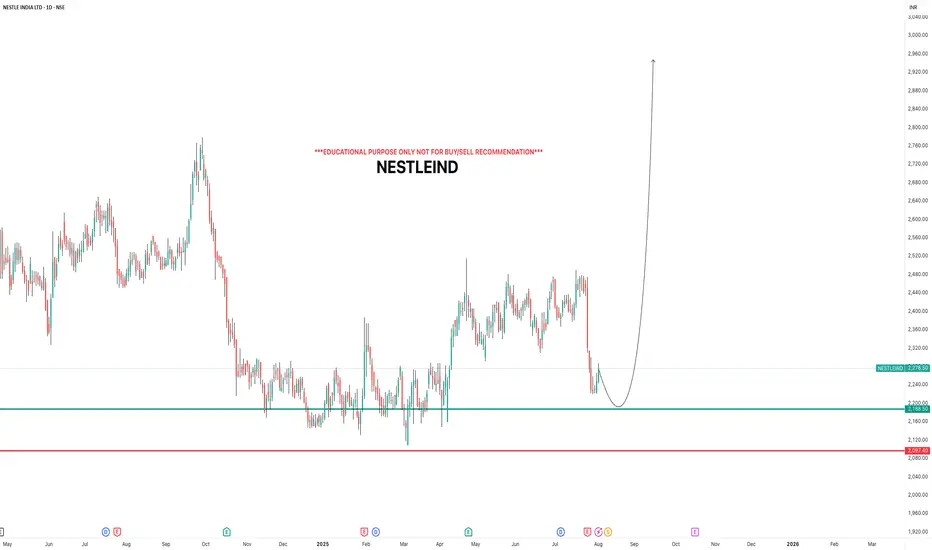
NESTLEINDIAi Observed these Levels based on Price Action and Demand & Supply which is my own Concept "PENDAM CONCEPTS"... Please don't take any trades based on this chart/post... Because this chart is for educational purpose only not for Buy or Sell Recommendation... Thank Q
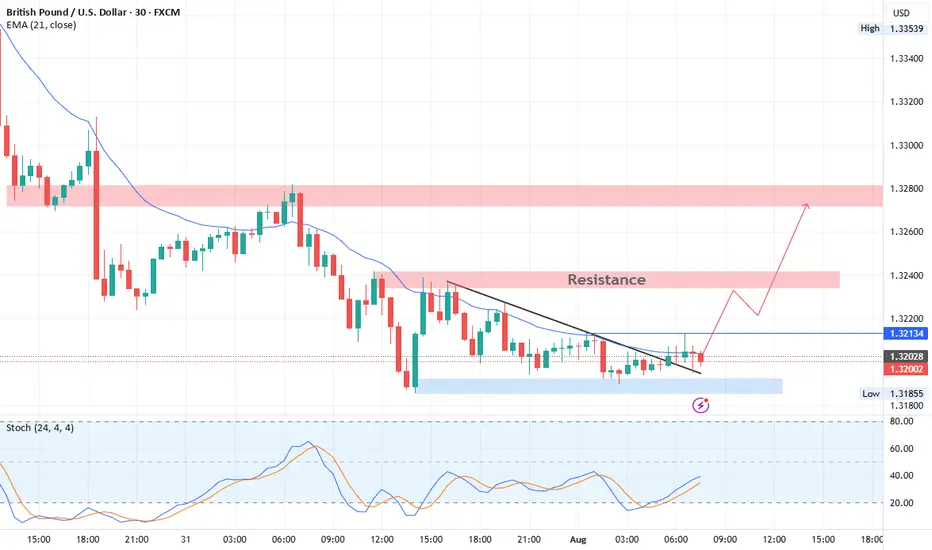
GBPUSD Technical BreakdownTrendline Breakout:
Price has decisively broken above a short-term descending trendline, signaling a potential shift in intraday momentum from bearish to bullish.
Support Zone (1.3185 – 1.3195):
This demand area has provided a strong base, with multiple successful rejections confirming buyer interest.
Resistance Levels:
Near-term resistance: 1.3213 (minor breakout level – watch for retest)
Key upside targets: 1.3240 followed by the major supply zone at 1.3275 – 1.3290
📈 Trade Outlook:
Bias: Bullish above 1.3213
Entry Idea: Look for bullish confirmation on a retest of 1.3213 as support
Targets:
TP1: 1.3240
TP2: 1.3275 – 1.3290
Invalidation: A sustained move below 1.3185 would invalidate the setup and reopen downside risk.
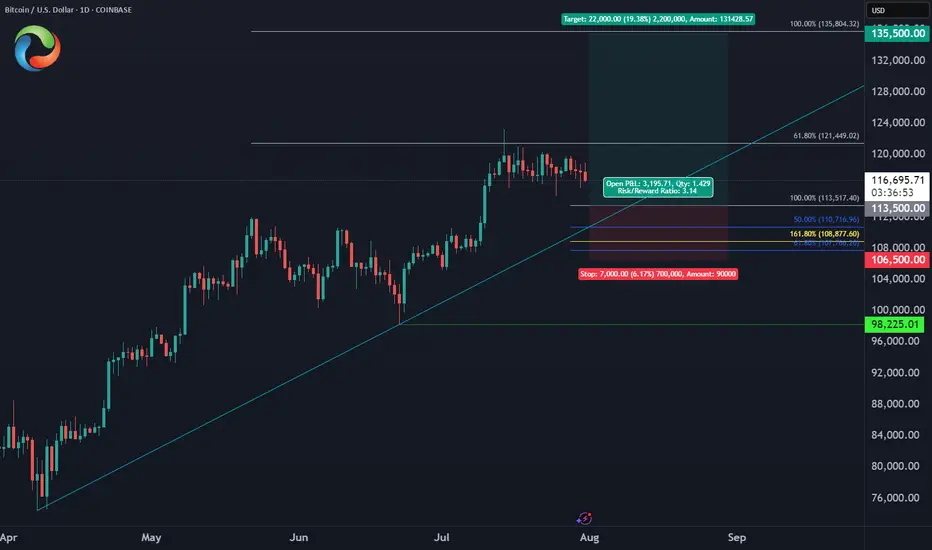
Bitcoin August Trade PlanBINANCE:BTCUSD
✅Entry Zone: $113,500 - $110,700
⛔️Stop: $106,500 (below June low)
🎯Target: $135,500 (ATH liquidity)
🔖Risk/Reward: 1:3
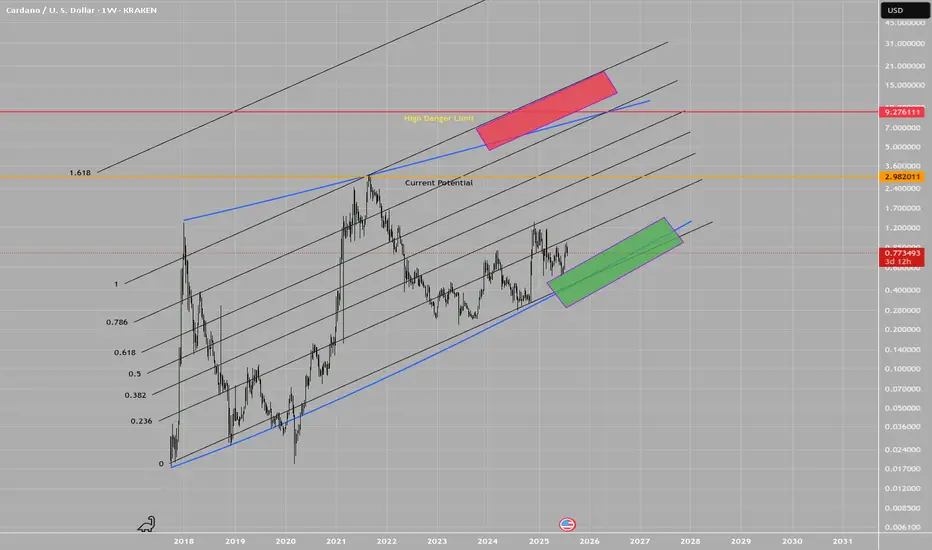
ADA, long term dubious speculationWARNING: This idea is highly dubious!
This is a logarithmic estimate of potential targets, in case Cardano moves in long logarithmic measures.
The real potential of this idea is strongly linked to the fundamentals evolution on time, i.e.: FED reducing the interest rate, for instance, but not only.
The plot features top and bottom limits drown by hand!, these are not perfect logarithmic measures, thus they certainly lacks of math accuracy. Beware.
There are zones in red and green, as transparent boxes, which depicts potential zones of buy and sell interest, of course, everything is in a log scale.
Everyone wish these kind of scenarios to be true. Only time and reality will show us the true face of it. In any case, in the total chaos of uncertainty that this market is, we try to make a sense of it.
Best of the lucks for everyone.
T.
DISCLAIMER: Do your own research! This idea is not a financial advice. All the information presented is highly speculative and cannot be taken as a reference in any circumstance.
XAUUSD – Strong Bullish Reversal from Key Support XAUUSD – Strong Bullish Reversal from Key Support
Chart Summary:
Gold (XAUUSD) has shown a clear reaction from a strong support zone near 3260, suggesting bullish momentum is gaining strength. The chart highlights multiple key market structure elements and confirms the potential for a bullish move.
Technical Highlights:
🔻 Strong Support Zone (3260–3280):
Price tapped into a well-defined demand zone with historical significance, initiating a bullish response.
🔺 Resistance Zone (3460+):
A strong resistance level lies ahead. This area may act as a potential target for bulls.
🔁 Break of Structure (BOS):
Multiple BOS marks on the chart indicate trend shifts and liquidity grabs. Most recent BOS aligns with potential reversal.
💹 Bullish Fair Value Gap (FVG):
A bullish FVG near mid-structure confirms institutional interest and adds confluence to the upside move.
📈 Target: 3,366.984 USD
Marked as the next probable short-term liquidity target. If momentum sustains, price may approach resistance above this.
Price Expectation:
If the current bullish momentum holds above the strong support zone, we may see a rally towards 3,366–3,400 USD.
This move could be driven by:
Buy-side liquidity grab above prior highs
Breakout traders entering above BOS
Reaction to macroeconomic calendar (highlighted on the chart)
✅ Educational Takeaway:
This is a textbook example of:
Support-resistance flip
Liquidity concepts (Buy-Side Liquidity)
Fair Value Gaps usage
Volume Profile confluence

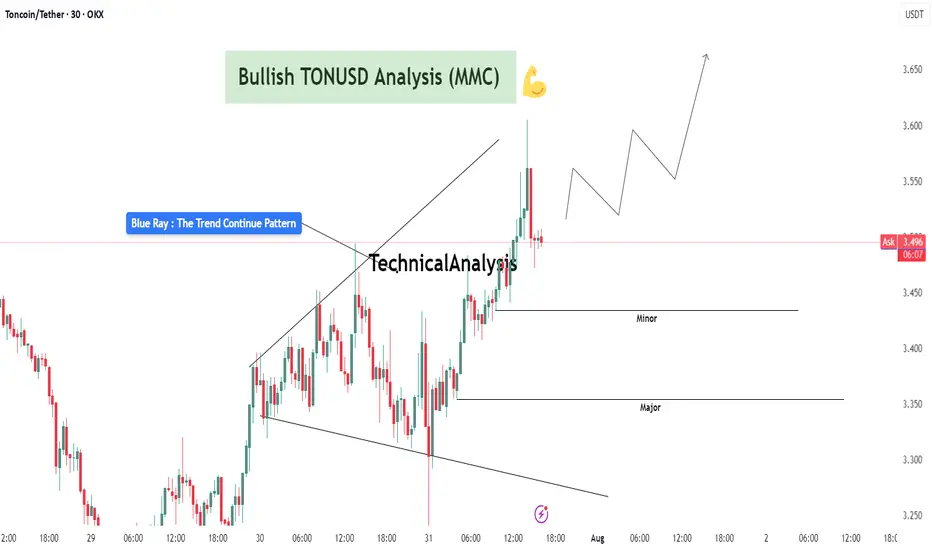
TONUSDT Analysis : Bullish Setup Breakout – Advanced MMC Analyze“Blue Ray Pattern Breakout Confirms Bullish Trend Continuation”
The 30-minute chart of TONUSDT highlights a clean and structured bullish setup based on the MMC (Mirror Market Concepts) methodology. The price action exhibits disciplined market behavior, respecting structural levels, breakout dynamics, and volume-based reactions.
🔷 1. Blue Ray Pattern – Trend Continuation Phase
This chart begins with the formation of the Blue Ray, a visual representation of trend consolidation and energy buildup. This pattern functions as a trend continuation flag or wedge. Prices compressed within a narrowing range, forming higher lows and lower highs, signaling accumulation under buyer control.
Once the pattern matured, we witnessed a decisive bullish breakout, where the price closed above resistance with conviction. This event marked a clear market intention shift and established a new impulsive leg.
🔍 2. Breakout Confirmation and Follow-Through
Post-breakout, TONUSDT experienced:
High-volume candles with elongated bodies, indicating increased buyer participation.
Immediate upside momentum that pushed the asset into a short-term overextended condition – often a healthy sign of strength when followed by a controlled pullback.
The breakout wasn’t just a false move – it was sustained, and the price held above the broken structure, proving that supply was absorbed and buyers were dominant.
🔑 3. Demand Zones (Minor and Major)
Two key MMC demand zones are highlighted:
🔹 Minor Demand Zone (~3.43–3.45):
This is the most immediate support and current price is hovering just above it. It's the first zone of interest for buyers and may serve as a re-entry or scaling point.
🔸 Major Demand Zone (~3.34–3.36):
In case of deeper retracement or volatility, this zone is expected to act as a strong bounce region based on past structure and MMC’s reversal logic. Price memory here suggests accumulation or reactive interest.
📐 4. Structure, Momentum, and Higher Timeframe Confluence
TONUSDT is in a confirmed uptrend, forming a clear sequence of higher highs and higher lows.
The structure supports a bullish flag breakout with minimal overhead resistance.
The projected path drawn on the chart illustrates a stair-stepping price pattern with continuation toward 3.60–3.70, if current levels hold.
📊 5. MMC Strategy Bias – Bullish
Using the MMC lens:
Blue Ray breakout confirms continuation
Volume absorption succeeded at the base of the flag
No signs of dominant supply entering post-breakout
Wave projection supports ongoing momentum
Structure favors buying dips, not shorting spikes
💡 Trader’s Takeaway:
TONUSDT is providing a textbook bullish opportunity under the MMC framework. As long as price stays above the Minor Demand Zone, continuation upward toward 3.60 and beyond remains in play. If price dips to the Major Zone, watch for strong buyer reactions for fresh entries.
Ideal for MMC traders and technical analysts looking to align with structured, logic-based entries and exits. This setup reflects market strength, technical clarity, and volume confirmation – a powerful trio for continuation plays.
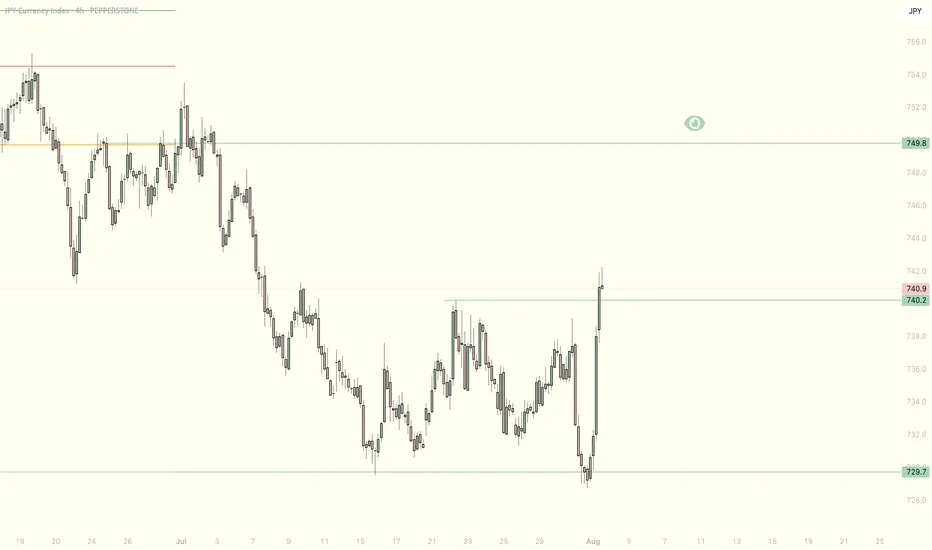
JPY SHORT TERM BULLIn my past video on YouTube, ive mentioned that JPY will be short-term bullish. Price took SSL and the run for the buy side. im hoping for the price to retrace to its weekly 50% Av, making its cross pair go lower like AUDJPY & EURJPY.
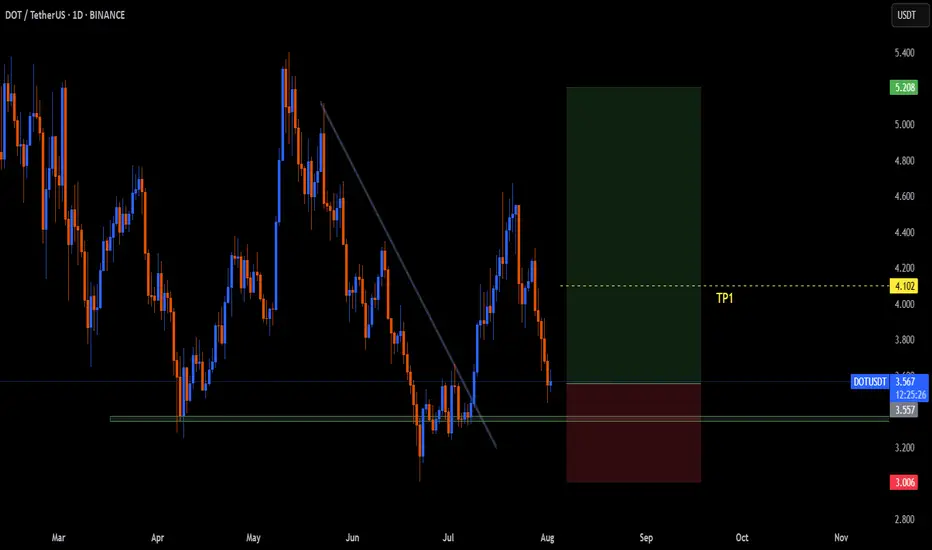
DOTUSDTThe first higher high after a downtrend indicates a potential trend reversal to the upside. It shows that buyers are starting to regain control, signaling the possibility of a new bullish trend.
Trendline Break: A break above a significant trendline further confirms the shift in sentiment from bearish to bullish. The trendline break signifies that selling pressure has weakened, and the market is poised for further upward movement.
MAMO Buying Opportunity🤑 CRYPTO:MAMOUSD did 3 waves pullback into extreme area $0.099 - $0.077 and as long as it holds the trendline from May low then Bulls will be looking for more upside to take place from here!

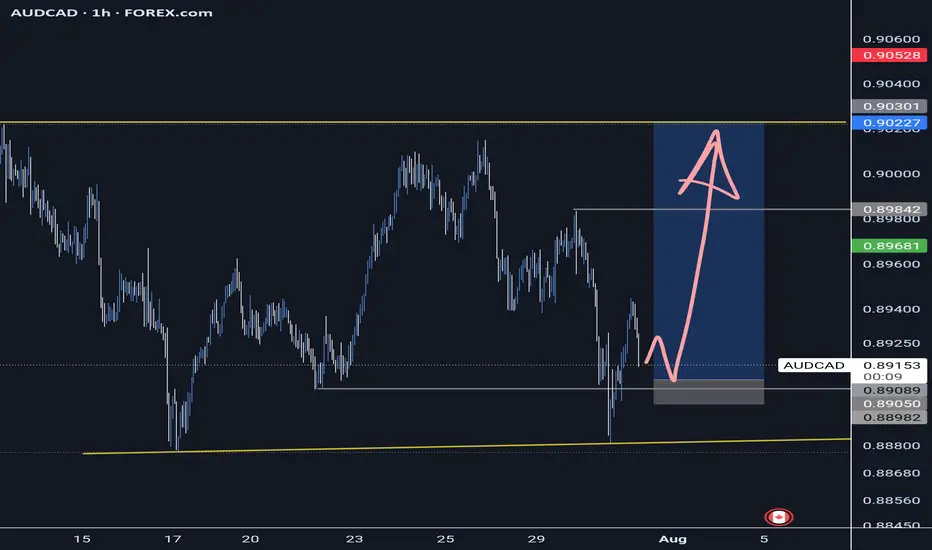
AUDCAD - Buyers ready to step in AUDCAD is in moving in LTF consolidation before next impulsive phase. Couple highs to target a good R ratio.
Good Luck
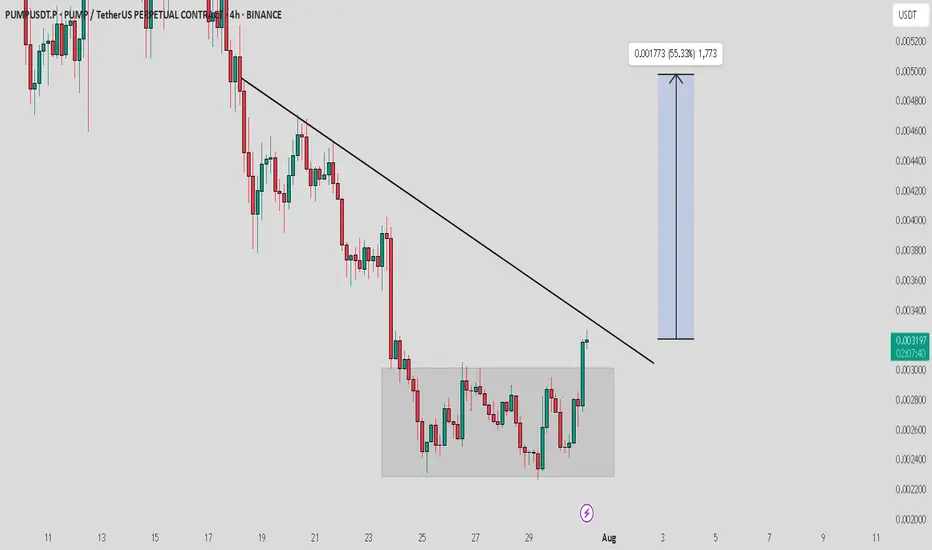
PUMP / USDT : Looking Bullish PUMP/USDT Analysis:
PUMP/USDT shows strong bullish potential after breaking out of consolidation. A retest to the box area is likely before a breakout from the trendline resistance. Once the trendline is broken, expect a major rally with a 40-50% potential upside.
Key Levels:
Support: Consolidation Box
Resistance: Trendline
Wait for confirmation of the trendline breakout before entering. Always manage risk with a stop-loss and stay patient for a clear move. The setup looks promising for a solid bullish rally!
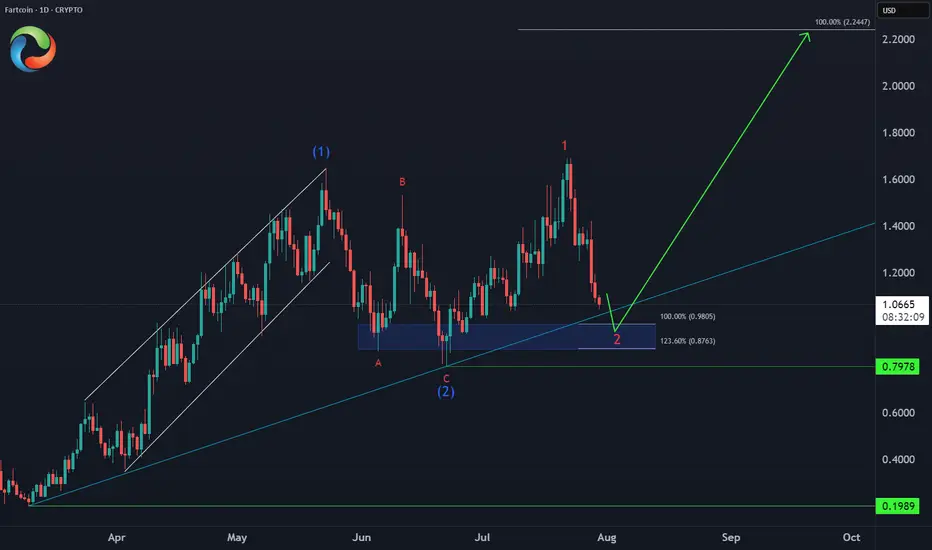
FARTCOIN Bullish Setup 📈 CRYPTO:FARTCOINUSD Entering an extreme buying area:
✅ Key support zone: $0.98-$0.87 (April trendline + equal legs)
⛔ Invalidation: $0.79
🎯 Target: $2.20 (124% upside)
This is how explosive meme setups look before liftoff.
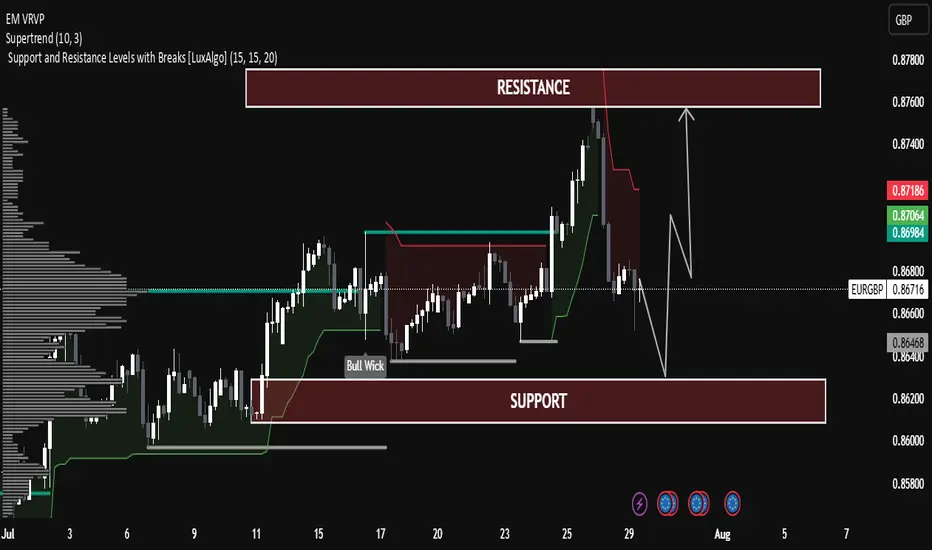
EUR/GBP Technical Analysis – Range-Bound Structure EUR/GBP Technical Analysis – Range-Bound Structure with Potential Rebound
The pair is currently trading within a well-defined horizontal channel between:
Support Zone: 0.86400 – 0.86200
Resistance Zone: 0.87800 – 0.87600
Price is currently near the mid-level (0.86756), showing consolidation after a rejection from resistance.
Supertrend Indicator:
The Supertrend (10,3) is currently bearish (red line above the price), indicating short-term downward pressure.
Price recently broke below the Supertrend line near the highs, suggesting a correction is underway.
Volume Profile (Left Side):
Significant volume has been transacted around the current market range (Point of Control).
This indicates strong interest and fair value, often leading to sideways movement before the next breakout.
Bull Wick Highlight (Mid-July):
Indicates buying pressure from lower levels, acting as historical demand near 0.86400.
🔄 Price Projection & Scenario Planning:
✅ Scenario A: Bullish Rejection from Support
If price retests the support zone (0.86400 – 0.86200) and forms a bullish rejection (e.g., pin bar or engulfing), a bounce is likely.
Target: Resistance zone 0.87600 – 0.87800
Confirmation: Bullish candle + break of 0.86900 resistance.
❌ Scenario B: Bearish Breakout Below Support
A break and close below 0.86200 may trigger a deeper correction.
Next possible downside target: 0.85800
Volume drop and strong red candles would support this.
🔧 Technical Summary:
Indicator Status
Structure Sideways / Range-bound
Supertrend Bearish (Short-term)
Support Zone 0.86200 – 0.86400
Resistance Zone 0.87600 – 0.87800
Bias Neutral-to-Bullish (above support)
🧠 Educational Note:
This chart is a great example of range trading—where traders look to buy near support and sell near resistance, especially when there is no strong trend. Patience and confirmation signals (like wick rejections or volume spikes) are key in such setups.
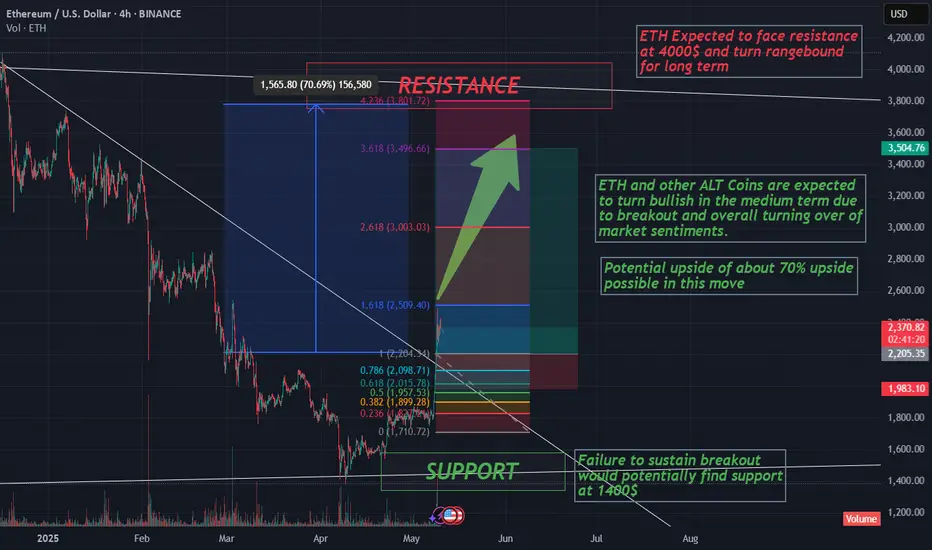
ETH Breakout and potential bullishness expected for a monthETH has broken out from downtrend and market sentiment has turned bullish overall. So it is expected to go up until it reaches 4000$ (70%) where a long term resistance is found.
Any further bullishness post 4000$ depends on future market conditions and price action at that point of time, as it is a long term resistance which would be more difficult to break.
Fibonacci retracement is used to find potential temporary selloffs in this up move. This move could potentially end the medium term bearish sentiments in ALT Coins.
Note: For educational purposes only. DYOR before investing or trading.
GBPAUD - Bullish Price Action GBPAUD broke out of a reversal structure with a double bottom confluence. Expecting further growth for a long opportunity.
Good Luck
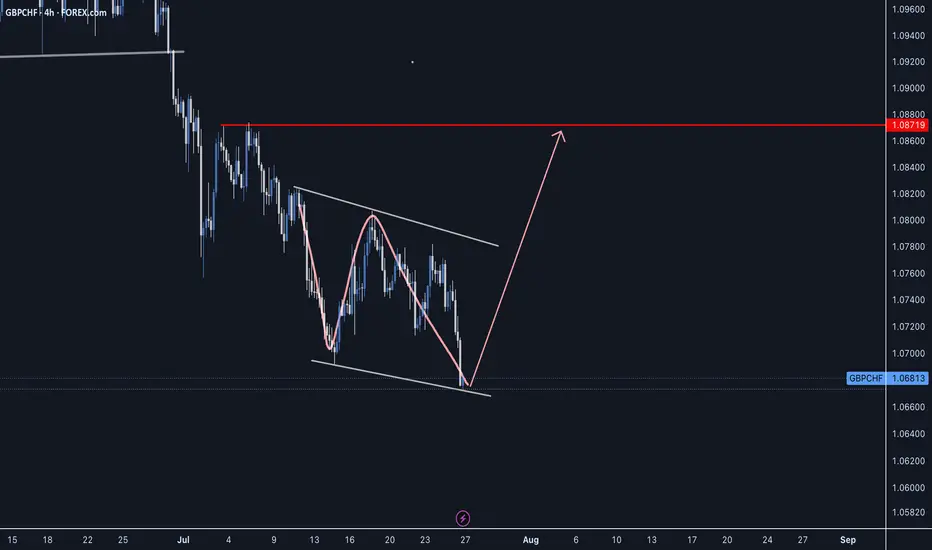
GBPCHF - Classic 'W' PatternGBPCHF has been setting up for the next impulse phase as we can see common 'W' price action pattern which has made the last swing low in this reversal structure to see buyers step in and push price upward.
Always wait for confirmation, Good Luck
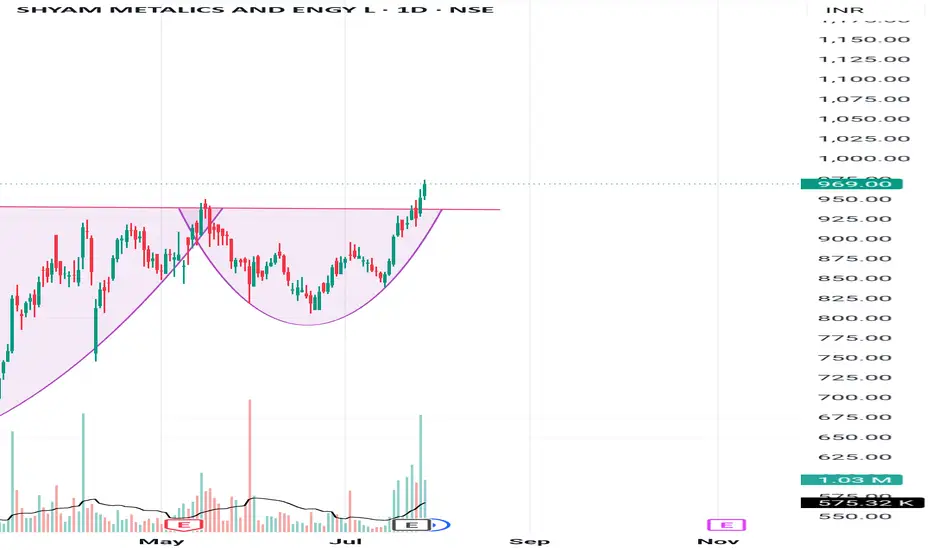
Cup and handle patternBreaks cup and handle pattern and going up. Looks bullish. Make sure to do your own analysis and maintain your risk management. This is only for educational purposes
Bullish Cup and Handle setup for Arafura Rare EarthsARU is setting up beautifully with a classic cup and handle formation on the daily chart. This is a well-defined bullish continuation pattern with strong convergence across technical indicators, price action, and volume structure.
Key pattern breakdown :
- Rounded cup base formed over April–June.
- Price rallied into resistance (~0.22-0.23c AUD), forming the right side of the cup.
- Currently in a healthy pullback phase, building the handle.
Watching for support at 0.195–0.200 to hold, which aligns with:
38.2–50% Fibonacci retracement
Mid-Bollinger Band
High-volume node on the visible range volume profile
RSI remains in a bullish uptrend, now cooling off and testing trendline support.

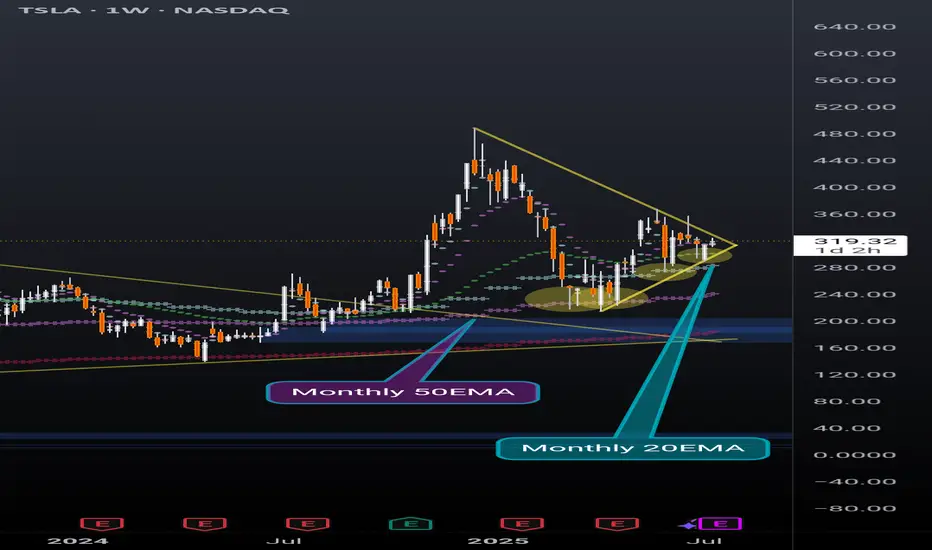
TSLA weekly coiling into something powerfulNever doubt the power of TSLA. Recently broke out of a huge pennant, and now nearing the end of another pennant while simultaneously holding support above the daily 20EMA(overlayed on this weekly chart).
Also recently found support off of the monthly 20EMA (overlayed on this weekly chart) and took 2 direct hits on the monthly 50EMA (overlayed on this weekly chart) before that and rallied up. It will take a lot to crush this setup but anything can happen. Possibly a longer pennant formation.
I'm just a cat not a financial advisor.
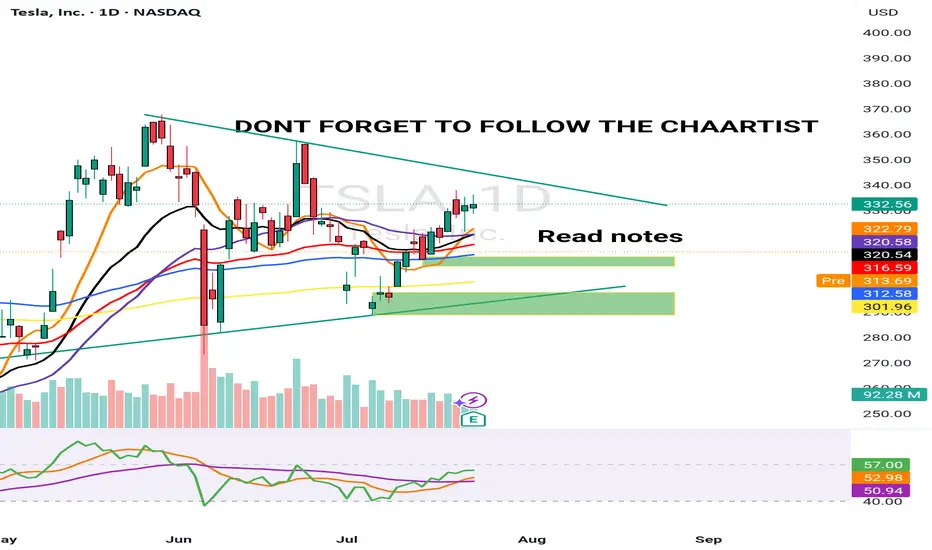
TSLA 24 JULY 2025I have marked 2 levels in green boxes. Price is inside this box pre market and TSLA is down -8.5% from the highs of $338 post market till $310 & -7.5% down from yesterday's close
A better level is the lower demand zone but its not the best. Price has not hit any major resistance.
My job is to read the data & trade. I am still bullish & 10% up down move is normal for Tesla &
This could be a "BEAR TRAP".
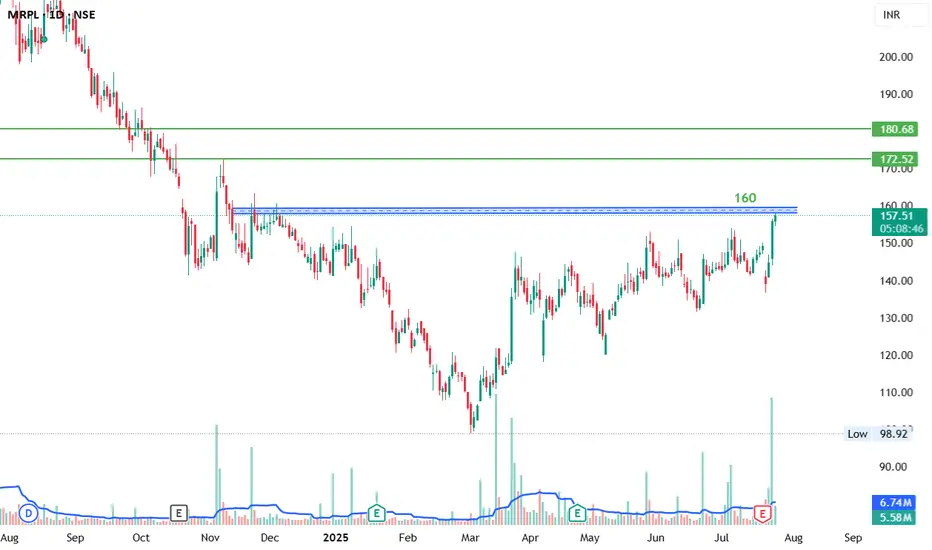
MRPL, Bullish Momentum, Large Volumes, Long, 1DMRPL is showing very Bullish momentum with large volumes. If it breaks 160 with Bullish candlesticks then enter in the trade for the target of 170 and 180.
Entry: 160 (only on Bullish CandleStick)
Target1: 170
Target2: 180.