Cardano - Repeating the +3.000% bullish cycle!CRYPTO:ADAUSD is creating price action like back in 2020 and we might see a rally soon.
Looking at the higher timeframes allows you to massively capitalize on overall market swings and cycles. Especially when it comes to Cardano, these cycles are pretty rewarding but also pretty predictable. At the moment, Cardano is repeating price action; we saw the same pattern playing out in 2020 and this break and retest was followed by a rally of +3.000%
Levels to watch: $0.42, $0.25
Keep your long term vision,
Philip - BasicTrading
Bullrun

BITCOIN ROAD TO $113K?BITCOIN Short Timeframe Anaylsis 🌊
📊 Scenario #1 : Wave 4 has completed as a WXY pattern, so we’re now targeting Wave 5 with potential levels at 0.618, 0.786, and beyond.
📊 Scenario #2: Wave 4 is still unfolding. If it extends further, we might be in Wave B heading into Wave C. The likely target range is between 88K and 90K, but exact levels are yet to be determined.

ZIL (Zilliqa) Extreme Bullish, Huge move soon🚀 Monster upward move by ZIL!🚀
On Fib Retracement ZIL is halfway until reaching the key level of 23.60% ($0.069) by breaking above the resistance line.
The pattern of the support and the resistance lines suggests that ZIL may make moon moves and test its peak at $0.259!
Key levels to break out during the run:
0.036 0.052 0.067 0.131
There are new updates, bridges, sponsorships and marketing incoming in the next two months!
🚀 🚀 🚀 🚀 🚀 🚀 🚀 🚀 🚀 🚀 🚀

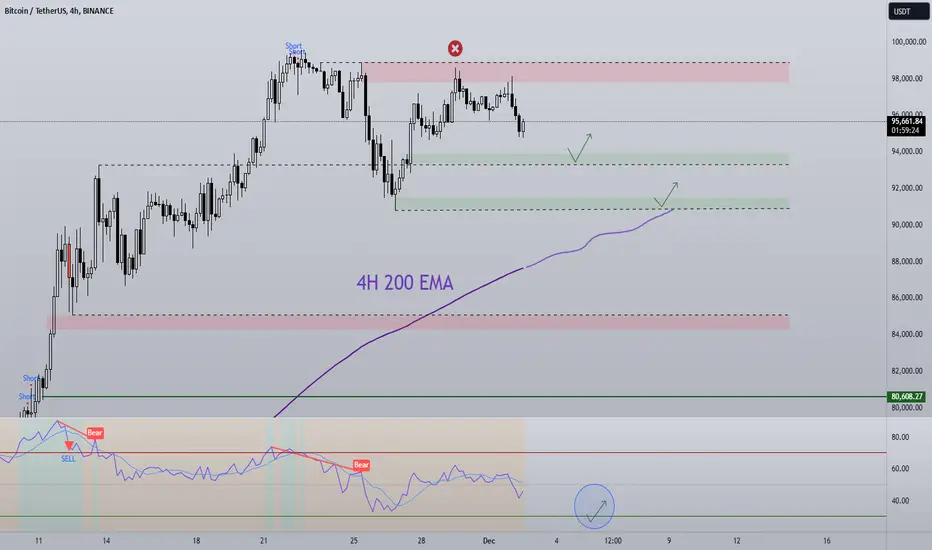
BTC December Monthly Open For the last 6 months straight, BTC has pulled back on the monthly open and each time price has recovered and pushed higher. We are currently seeing the first half of that with a rejection off $98,000 so the question is, where does it stop?
The first place of interest is ~$93,500, a bullish orderblock with a strong candle following it. In a Bullrun these areas are expected to give a reaction and so that's my first place of interest.
A deeper pullback would take us the the 4H local low, a bounce here would establish a mini-range/ accumulation zone. Now that would make sense as a base is built to target the big even $100K, after such a strong rally a cool-off and reset of indicators would be beneficial, liquidating late longs would be a bonus (if you're not on the wrong side). This level also co-insides with the 4H 200 EMA, typically in a bullmarket this level holds well and caps off correctional phases. The RSI will then also be near/in the oversold zone as further confluence.
The HTF level that most are interested in is ~$84,000, A clear FVG level. This would be a loss of the 4H 200 EMA and definitely in the RSI oversold zone. We know that there is still a massive demand for BTC on an institutional level, ETFs and retail so pullbacks should be bought up in time, the question is when and where. A fill of this area would be more bullish in the long run as the FVG won't need to be filled later, meaning the potential severity of a crash or pullback in the future won't be as much.
TradeCityPro | ALTUSDT Analysis Good Spot Buying Opportunity?👋 Welcome to the TradeCityPro channel!
Let’s dive into analyzing one of the newer altcoins in the market, ALTUSDT, which might offer a solid spot entry opportunity tonight.
🌱 Bitcoin Overview
As always, we begin by checking Bitcoin's performance , Bitcoin hasn't moved much compared to yesterday.
However, Bitcoin dominance is declining, which has allowed altcoins to gain momentum , If Bitcoin remains range-bound and its dominance continues dropping, altcoins might sustain their upward trend.
🕒 Weekly Timeframe
ALTUSDT has recently been listed and has dropped approximately 88% since listing, following the typical behavior of newly listed coins.
After this decline, it has been consolidating within a range box for about 120 days.
Now, the coin is testing the resistance at $0.16293, and it appears to be breaking out.
Risky Stop-Loss: Place it just below the shadow of the current candle, considering the buyers' strength.
Secure Stop-Loss: Place it at the bottom of the range near $0.0732 and hold for targets.
🔑 Daily Timeframe
trigger at $0.13342 allowed for a buy earlier. If you missed that entry, you can buy after a breakout of $0.16293, using a stop-loss at $0.10133.
RSI Entry Trigger The key RSI level to watch for entry is 82.57, signaling strong upward momentum.
No need to analyze lower timeframes extensively because the limited data on this coin makes trading it challenging , For futures trades, there are already sufficient setups in the channel.
💡 BTC Pair Insight
Relative to Bitcoin, ALTUSDT has been in a downtrend, forming a range due to significant trend weakness , breakout from this range could initiate an uptrend relative to Bitcoin.
If I purchase the coin and its BTC pair shows bullish movement, I’ll continue holding.
📝 Final Thoughts
Stay calm, trade wisely, and let's capture the market's best opportunities!
This analysis reflects our opinions and is not financial advice.
Share your thoughts in the comments, and don’t forget to share this analysis with your friends! ❤️
AMP gearing up for a nice move to the NorthAMP is looking nice resting on the .618 and broke through resistance nicely. Also printing a nice bull flag pattern at the moment.
AMP is the token used as collateral connected to the Flexa App which is used to make fast secure crypto payments. Flexa is accepted at Chipotle and other numerous stores starting to come on board the crypto wave. Flexa was just mentioned in a Bitcoin News article about a large national gas station chain staring to accept the Flexa app. This one has the potential to be huge and is a sleeping Giant ATM IMO. LETS F GO!!!
Target 1: .01075
Target 2: .01300
Target 3: .01685
Target 4: .02700
Target 5: .03800
Target 6: MOON

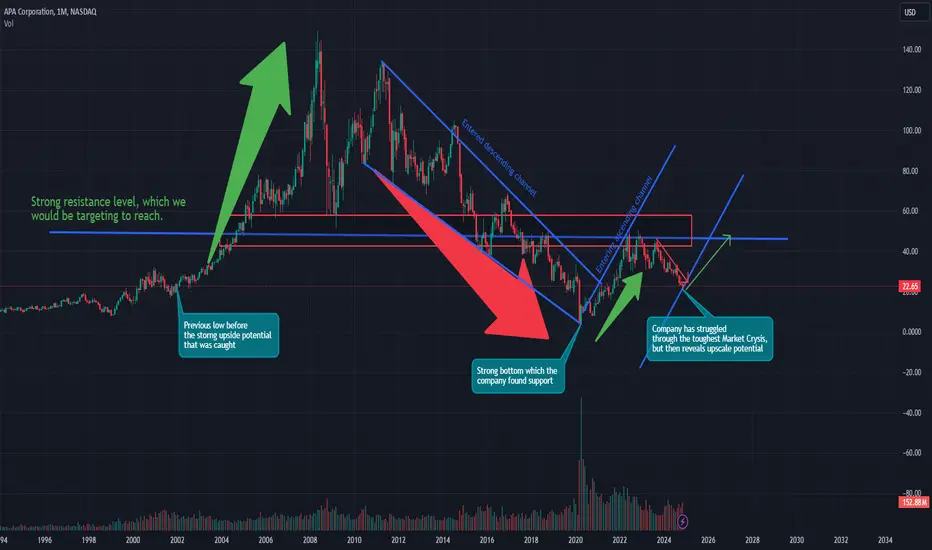
APA Corp.- did we just acquire and find a hidden gem?Hi, dear followers up next we would follow up a company which is being overlooked and it can turn into a very lovely hidden gem.
Currently APA Corporation, has received a few lower targets by big Investment Analysts , but at the same time the company seems to deliver, since 2019 they have had a stable up trend, and throughout their Earnings Reports they have showed a good steady growth, the main focus here would be the good EPS results but more specifically the magnificent P/E Ratio that the company is showing at the level of 3.22. Currently we are formulating and trying to fit in a good ascending channel which should take us to the strong Resistance Level at - 51.24
Entry 24.26
Target 1 : 31.36
Target 2 : 39.62
Target 3 : 49.10
Follow up with this hidden gem and keep it in your portfolio for the next 3-9 months, and this fine gem might just turn out to be a diamond!
P.S. Follow up in my channel where we dive deeper in it's analysis
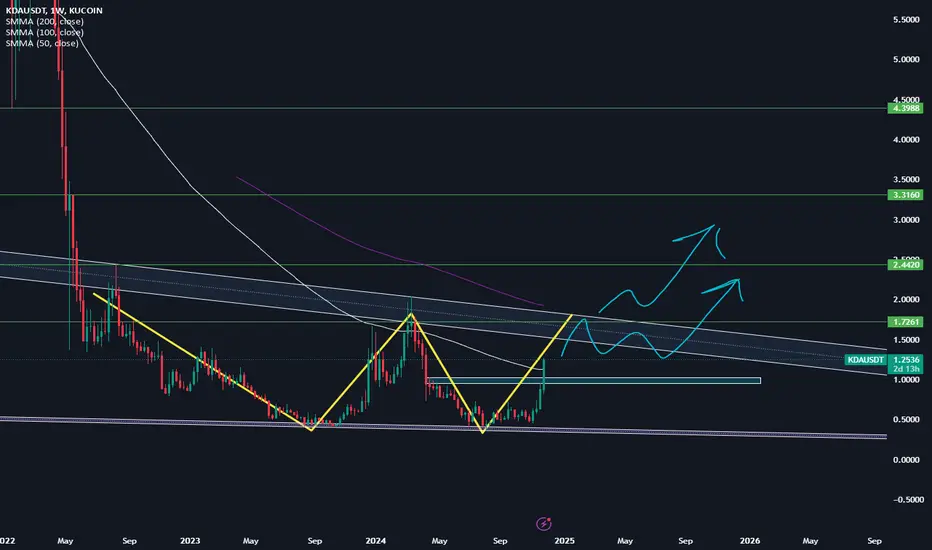
Is Kadena gonna be another next big factor?There are more than few possible bullish sign that really makes me consider Long-term position entry on BINANCE:KDAUSDT either Futures and Spot. So these are the signs I noticed :
1. Double Bottom
2. Bullish Flag
3. Breaking a minor Resistance but most close a candle above it
4. About to check Bull flag resistance 3rd time which is a very possible sign to go up even higher.
But there are few things I want to see before enter Futures position.
1. Coming down and check 1 area which used to be a minor resistance
2. Closing a candle above 2 will be confirmation of breaking Double bottom and Bull flag pattern.
I will be taking profits at those marked green lines. If it ever breaks 4.5 area I will post another Take profit interest points.
ETH about to replicate 2021s movement?These days, I've been thinking about my position on ETH. After reading all the FUD about SOLANA being the "Ethereum killer," I've decided to double-check if ETH has more potential in this bull run or not.
I'm not going to discuss Solana's market cap versus Ethereum's, as that's a separate topic.
Looking back at the 2021 cycle, Ethereum seems to be replicating the same accumulation pattern it had back then. As we all know, during those summer months, the charts showed a clear accumulation structure. After that, in the very first week of November, the pattern broke, leading to what I believe was a new bullish movement that eventually took ETH to a new all-time high of around $4,000.
What if Ethereum repeats the same massive move as in 2021? We could potentially see the second-largest cryptocurrency hitting $6,000.
In my opinion, a price range between $5,000 and $6,000 is where I'll likely set my sell target.
I'll keep you updated as the price moves!

ARC reversalARC has already made a short reversal from the 0.75 Fib level. It is set for further upward momentum. Keep an eye on ARC as it regains strength! - ARC / USDT

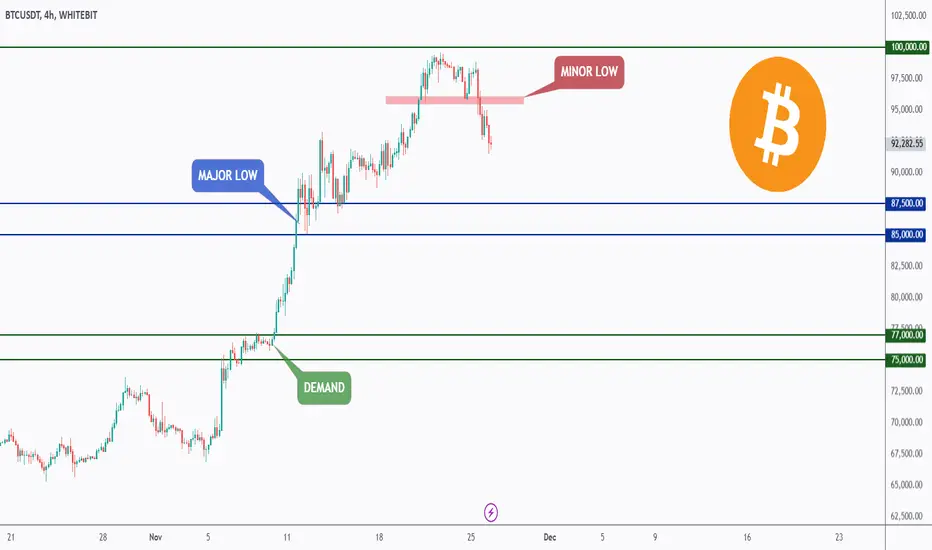
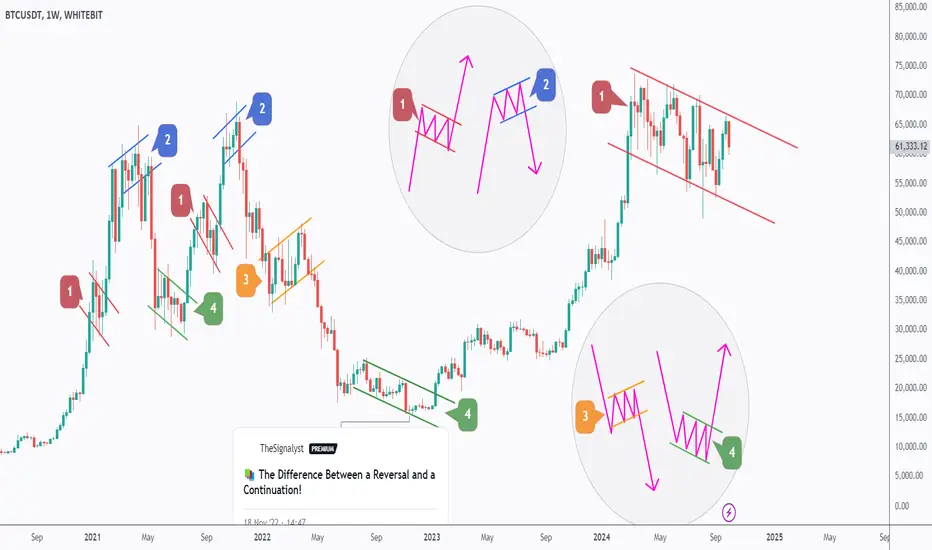
Structure broken! How much can BTC go?Hello TradingView Family / Fellow Traders. This is Richard, also known as theSignalyst.
📉 After breaking the minor low marked in red at $95,000, the bears have already taken over in the short term.
However, BTC will remain bullish in the medium term as long as the last major low in blue at $85,000 holds.
Thus, as BTC approaches the $85,000 zone, I will be looking for bullish reversal setups to form at the rejection.
If and only if $85,000 is broken downward, a bigger bearish correction towards the $75,000 demand zone would be expected.
Which scenario do you think is more likely to happen and why?
📚 Always follow your trading plan regarding entry, risk management, and trade management.
Good luck!
All Strategies Are Good; If Managed Properly!
~Rich
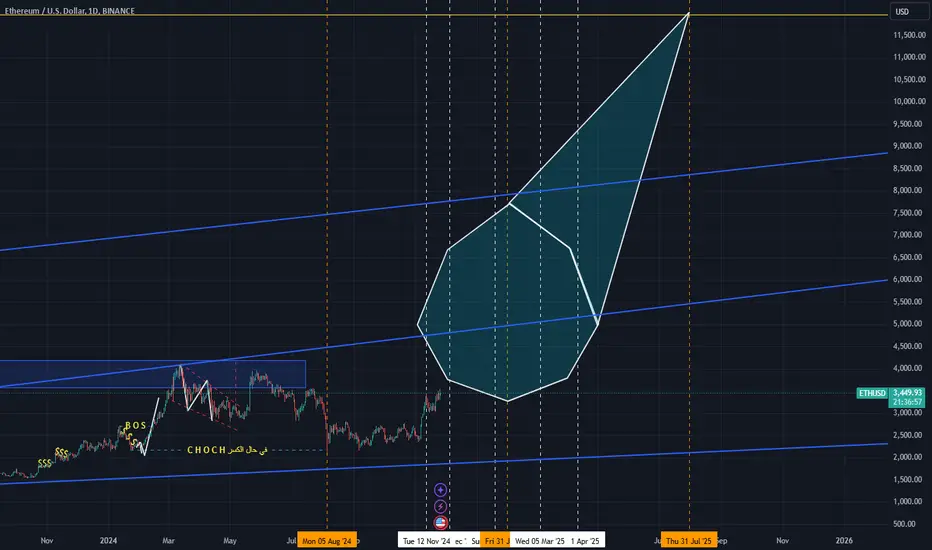
ETH Final destination Right it's insane Goal but it is what it is, the goal is 11k in next 7 month would it be hit?
who knows but someone has to take the risk. and make a move
Xrp - The Bullrun Is Finally Starting!Xrp ( BITSTAMP:XRPUSD ) will finally break out of the triangle:
Click chart above to see the detailed analysis👆🏻
As expected and mentioned in basically all of my previous analysis, Xrp now broke above the first of two bearish trendlines. It seems like it will be just a matter of time until Xrp will also break out of the five-year consolidation symmetrical triangle.
Levels to watch: $1.0, $3.0
Keep your long term vision,
Philip (BasicTrading)

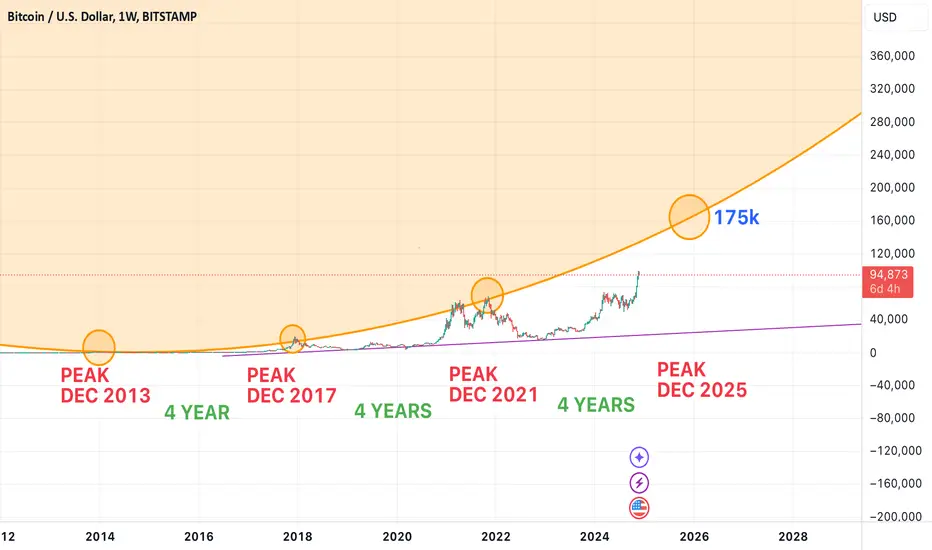
175K BTC BITCOIN $BTC In DecemberI'm an artist and noticed that there is a circle pattern connecting the previous highs, when I chart that circle the next high in Dec will be about 175K #BITCOIN #BTC MARKETSCOM:BITCOIN CRYPTOCAP:BTC
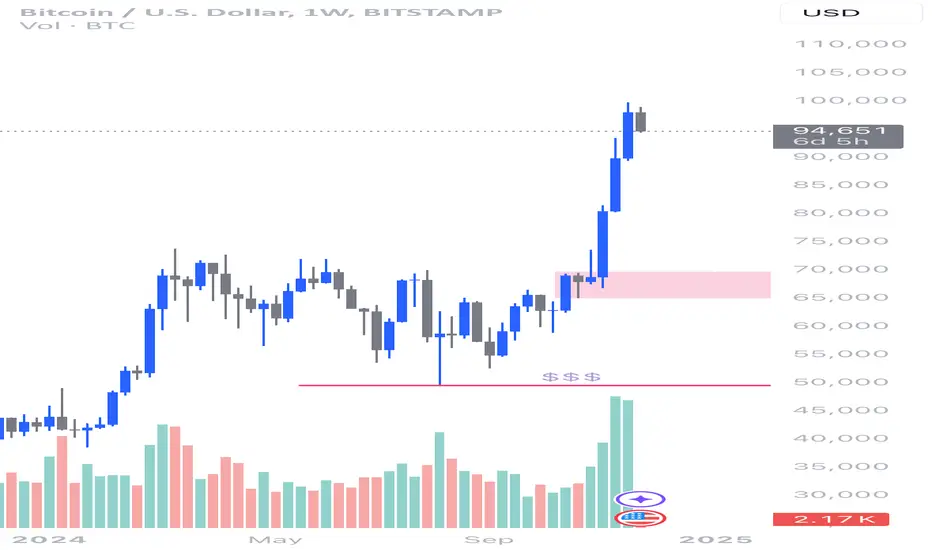
[BTC/USD: Long-Term Outlook]Current Situation:
Bitcoin's current price is approximately 94,862 USD, with a 3.21% drop.
On the weekly time frame, there is a strong upward trend where the price has climbed from lower levels to a new high above 90,000 USD.
The last correction stalled in the 65,000–70,000 USD zone (highlighted in red on the chart), confirming this as a strong support area.
Key Technical Confirmations:
Support Zone (Buy Zone):
The price rallied from the 65,000–70,000 USD area. This zone is significant as it was a prior accumulation area that led to the breakout to higher levels.
Liquidity within the support zone ("$$$") has already been filled, signaling strong buyer interest.
Bullish Structure (Higher Highs & Higher Lows):
The chart shows a clear formation of higher highs and higher lows, confirming the long-term bullish trend.
Imbalance and Strong Volume:
A large green candle with significant momentum suggests a strong bullish move. The volume during this rally was the highest in the past year, further reinforcing the trend.
Psychological Level – 100,000 USD:
The 100,000 USD level is an important psychological barrier, likely acting as a magnet for buyers and sellers. This remains a reachable long-term target.
Scenarios:
Bullish Scenario:
If the price stays above the 65,000–70,000 USD support zone, further upward movement is expected.
The first target is 100,000 USD (psychological level), with potential to break higher toward 110,000 USD or beyond if volume increases.
Bearish Scenario:
If the price falls below 65,000 USD and breaks the structure, a deeper correction toward 50,000 USD (liquidity zone marked "$$$") may occur.
My Long-Term Projection:
Given the current technical picture and strong bullish trend, my bias is bullish. I expect BTC/USD to reach 100,000 USD in the coming months and potentially test the 110,000 USD zone or higher, assuming the bullish structure remains intact.
Trade Plan:
Entry (Buy): On a retest of the 70,000–75,000 USD zone, if the price revisits this support.
Stop Loss: Below 65,000 USD (under the previous support zone).
Targets (Take Profit):
TP1: 100,000 USD
TP2: 110,000 USD
Disclaimer:
This is solely a personal analysis and does not constitute financial advice. Please use your own analysis and manage your risk appropriately.
$BTC Mega bull run continues!#Bitcoin's corrections in small time frames serve as fuel for new rises.
Focus on the big picture and enjoy the ride!
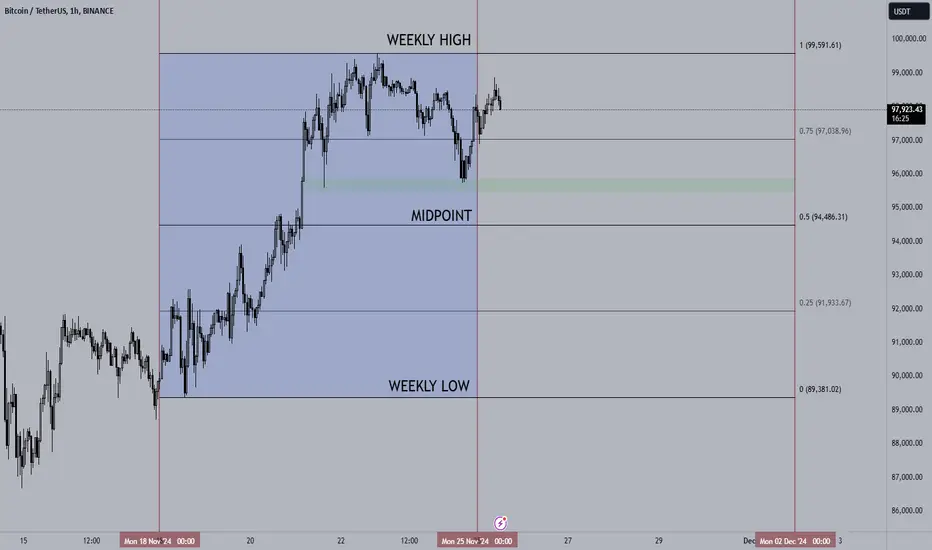
25/11/24 Weekly outlookLast weeks high: $99,591.61
Last weeks low: $89,381.02
Midpoint: $94,486.31
Crypto continues to climb! Bitcoin less than 0.5% off the famous $100,000 milestone, we could see it broken this week if momentum is to continue going into month end. Last week we saw a steady climb from Monday to Friday with a similarly steady sell-off over the weekend, mostly due to lack of institutional buying that we've been used to since the Trump election win. This drop in buyers over the weekend naturally brings price down as the buyside demand drops, however it is expected to return during the weekdays.
Altcoins benefited from this reduction in BTC buyers with a shift from institutional whales to more retail players over the weekend. I expect to see the momentum return to BTC during the week. We saw BTC ETF options trading launch last week with 83% of hundreds of millions of dollars in volume betting on the price being higher, one contract of which (C100) expires on 20th Dec says BTC price will double in 1 month!
This week the question is will we see $100k, and what will happen if we do? Naturally there is a psychological importance to a big even number like this, and for retail investors that could be considered as a big thing, a possibly bearish level as retail takes profit, the story hits the mainstream news and creates a sell the news event? In previous cycles I would have said that was very possible, however, now the market is driven by institutional investors, ETF's and whales. These people are not interested in these 'big even numbers', they're interested in the bigger picture and for that reason I could see BTC blasting through $100,000, catching retail sidelined and having them panicking to re-enter, that's when a possible pullback could happen as that would be max pain for retail. I do think a pullback is coming eventually but for now the structure is very positive, shallow pullbacks are being bought up quickly with HH's & HL's consistently.
For this week I am looking at ETH against BTC as it looks to claw back some gains having been left behind this cycle so far. Altcoins are looking good too, the longer BTC pauses the more money will flow into alts, however any significant pullback in BTC will nuke alts as it has all year.
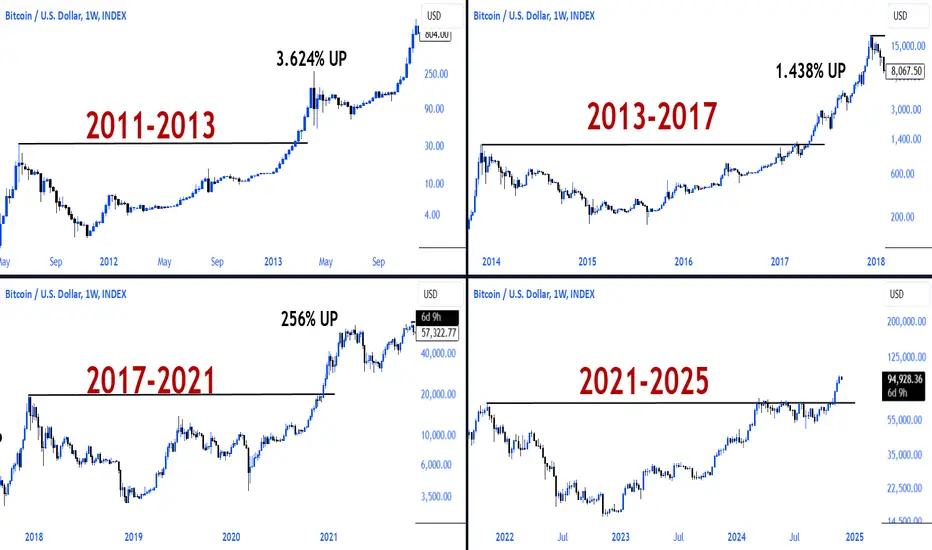
run it bitcoin CRYPTOCAP:BTC hits almost $100k, which is still just a small show!
#Bitcoin has entered the Parabolic run phase with the weekly chart cup with handle formation neckline breakout and 2021 ATH breakout, but there will be more to come!

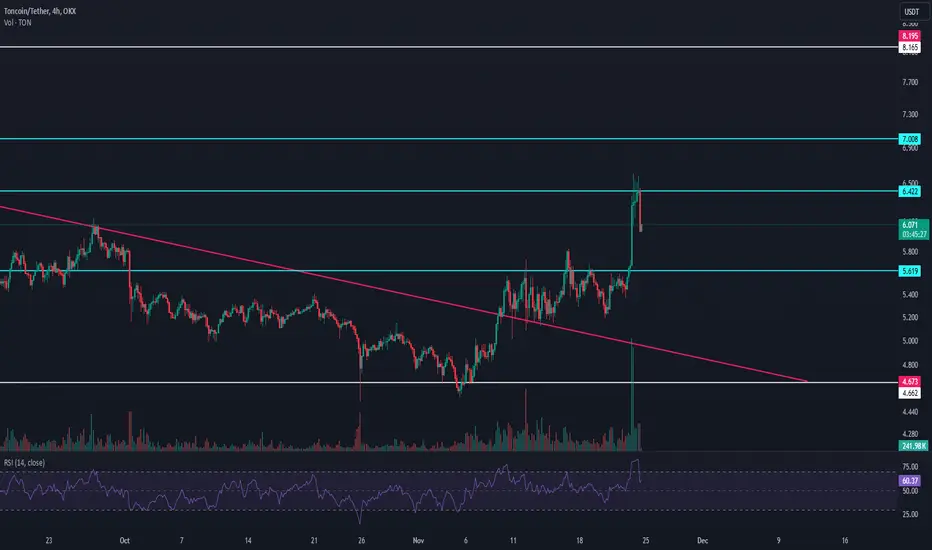
TradeCityPro | TON : From Correction to Potential New Highs👋 Welcome to TradeCityPro!
In this analysis, I will review TON. This coin is associated with Telegram and has seen significant growth after the viral spread of DAPPs on this network, reaching a high of $8.288 and registering a new ATH.
📅 Weekly Timeframe: Volume Entering During Correction
In the weekly timeframe, after hitting the $8.024 resistance, the market entered a correction phase. It has now retraced to the 0.382 Fibonacci level. After reaching the $4.743 support, new buying volume entered the market, pushing RSI above the 50 zone.
📊 If the buying volume continues to increase, bullish momentum will return to the market. With a breakout above $8.024, the price could experience substantial growth. The Fibonacci targets after this breakout are $13.966 and $18.719. However, these levels are not guaranteed targets or the final points of the rally. They are used to confirm trend changes.
📅 Daily Timeframe: Trendline Breakout and First Bullish Wave
In the daily timeframe, we can see the details of the coin’s correction phase. As shown, a descending trendline formed during the correction. After breaking this trendline and surpassing the $5.499 trigger, the price surged and is now heading toward the $6.922 resistance.
🚀 If you entered after the trendline breakout, I recommend not rushing to sell unless the market shows a trend reversal. However, if you are holding a futures position, you’ve likely already made a good profit. It would be wise to secure some of your gains at this point.
🔽 For now, the next resistance in case of an uptrend is $6.922. If the RSI closes above the 70 zone and more buying volume enters the market, we could see another significant rally, similar to yesterday’s movement.
🛒 For spot entries, the $5.499 trigger has already been broken. Future entry levels include breakouts above $6.922 and $8.165.
📅 4-Hour Timeframe: Futures Triggers
Let’s move to the 4-hour timeframe and identify futures triggers. In this timeframe, there is resistance at the $6.422 zone, which recently caused a major rejection. This indicates that the level is very significant and strong.
🔼 If the price tests this zone again, we can consider opening a long position if it breaks. The targets for this move would be $7.008 and $8.165.
📉 If the correction continues, the first support is at $5.619. Additionally, the RSI reaching the 50 level is also a critical point to watch.
👑 TON/BTC Analysis
In the 4-hour timeframe, the TON/BTC pair currently has a bearish nature. It has recently crossed above the SMA99 and is now in a pullback phase. The $0.00006512 trigger would be a solid level if it coincides with the $6.422 zone. If this resistance is broken, the primary target will be $0.00007110.
✨ If the decline continues, the only supports are at $0.00005733 and $0.00005488.
📝 Final Thoughts
This analysis reflects our opinions and is not financial advice.
Share your thoughts in the comments, and don’t forget to share this analysis with your friends! ❤️
BTC - Thank Me Later!Hello TradingView Family / Fellow Traders. This is Richard.
🗒 Do you remember this post from 2023?
As mentioned back then, BTC was forming Pattern 4, which was activated after breaking above the falling green channel, leading to a surge of over 200%.
So, according to the educational post, where are we now⁉️
🔑A falling correction after a bullish impulse signals what?
That’s right — we are now in the process of forming Pattern 1.
For this pattern to be activated and the bullish continuation phase to begin, we need a weekly candle close above $70,000.
Of course, in the meantime, as long as BTC is trading within the falling channel, it can still retest the lower bound before activating the phase.
❗️N.B. Always remember, nothing moves in a straight line, so we might see a correction (in the form of a higher low) along the way.
📉 Which scenario do you think is more likely to happen, and why?
Always follow your trading plan regarding entry, risk management, and trade management.
Good luck!
🗒 All strategies are good, if managed properly!
~Rich
TradeCityPro | INJUSDT Altcoins Gaining Momentum Amid BTC.D Drop👋 Welcome to the TradeCityPro channel!
Let's dive into the INJ/USDT chart and explore key trading triggers as altcoins show strong moves due to declining Bitcoin dominance (BTC.D).
🌐 Market Context
Bitcoin is consolidating below the $99K resistance, with whales showing calmness. This has led to capital rotation into altcoins, as reflected by the drop in BTC.D.
BTC.D is approaching a crucial support at 58.66%. A continued decline, along with Bitcoin's sideways or slight upward movement, could trigger massive altcoin pumps.
📊 INJUSDT Weekly Timeframe
Trend: INJ is attempting to close above its weekly resistance with significant volume, signaling a potential bullish breakout.
Buy Trigger: A close above this weekly resistance with a stop-loss at $16.20 provides a solid entry for spot positions.
Correction Opportunity: The coin has already corrected to $16.20, and a break above the trendline could lead to further gains.
📈 INJBTC Pair Perspective
INJ is relatively stronger than most altcoins against Bitcoin, trading at higher levels in its BTC pair.
Trigger: A breakout above 0.0004325 BTC could confirm an upward move, with potential targets at 0.0009526 BTC, provided the overall market remains bullish.
📝 Final Thoughts
Avoid FOMO: Don’t rush into the market; wait for clear triggers and manage risk responsibly.
Altcoin Opportunities: Early in an "alt-party," altcoins often outperform. However, INJ is already trading higher than many altcoins, making it essential to approach with a strategy.
Stay calm, trade wisely, and let's capture the market's best opportunities!
This analysis reflects our opinions and is not financial advice.
Share your thoughts in the comments, and don’t forget to share this analysis with your friends! ❤️
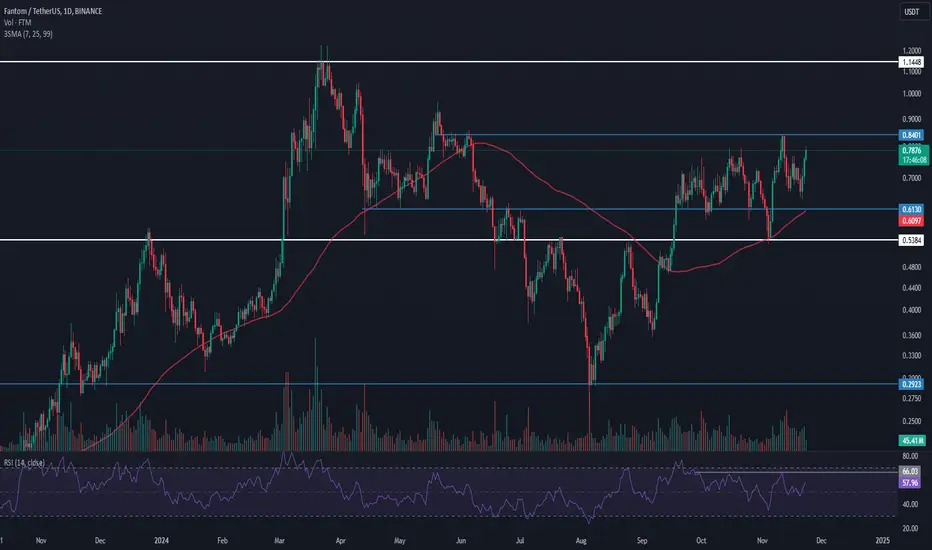
TradeCityPro | FTM : Preparing for a Potential Rally👋 Welcome to TradeCity Pro!
In this analysis, I will be reviewing the FTM chart. This project is a Layer 1 blockchain, which has recently gained significant attention and buying volume due to its new airdrop initiative.
📅 Weekly Timeframe: Preparing for Another Rally
In this timeframe, after several months of base formation around $0.1793, the price has now broken through $0.5535, with the next resistance at $1.0785. If the price successfully stabilizes above this resistance, the probability of reaching the ATH at $3.292 increases significantly.
📈 If the RSI oscillator breaks through 62.1, bullish momentum will enter the market, increasing the chances of breaking the resistance and pushing toward the ATH. However, the most crucial factor right now is volume. So far, the main buying volumes haven’t entered the market. Until this happens, the likelihood of breaking the resistance remains low.
📅 Daily Timeframe: Close to Breaking Resistance
On the daily timeframe, after breaking $0.5384, the price has pulled back toward this level and the SMA 99. It has now reached $0.8401, with a significant support level at $0.613.
🔼 The first long trigger in this timeframe is $0.8401, with a target of $1.1448 if this level is broken. However, as mentioned in the weekly analysis, volume remains low, and until larger volumes enter the market, the moves in the market cannot be deemed reliable.
🔍 If the price is rejected at $0.8401, it may pull back again toward the SMA 99 or even revisit $0.5384.
🔽 Currently, there isn’t a suitable short trigger in this timeframe. Personally, I will wait for lower highs and lower lows before considering short positions.
👑 FTM/BTC Analysis
On the daily timeframe for the FTM/BTC pair, there’s a long-term range between 0.00000676 and 0.00001129, with price once moving to the high at 0.00001794 and another time to the low at 0.00000541. Currently, the price is battling resistance at 0.00000817, which is within this range.
🚀 Breaking this resistance, coinciding with $0.8401 on the USD pair, would be a solid confirmation for entering spot buys or futures positions. The next resistances are at 0.00000991 and 0.00001129.
📝 Final Thoughts
This analysis reflects our opinions and is not financial advice.
Share your thoughts in the comments, and don’t forget to share this analysis with your friends! ❤️
FTM Broadening wedge BreakoutFtm will breakoout of its 12 hour broadening wedge with long term perspective
