SCENARIO STUDY: Bullish or Bearish?Hello fellow traders! Here’s a fresh, USD/JPY plan that blends 4-hour technicals with today’s macro/news flow, plus the most recent trader and bank sentiment. Time to get happy!
USD/JPY for Aug 15, 2025, U.S. morning/afternoon
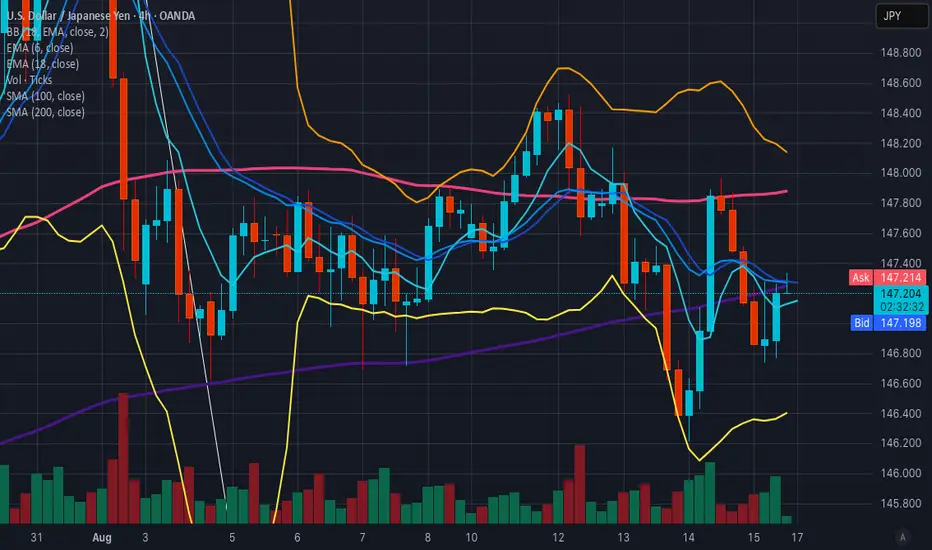
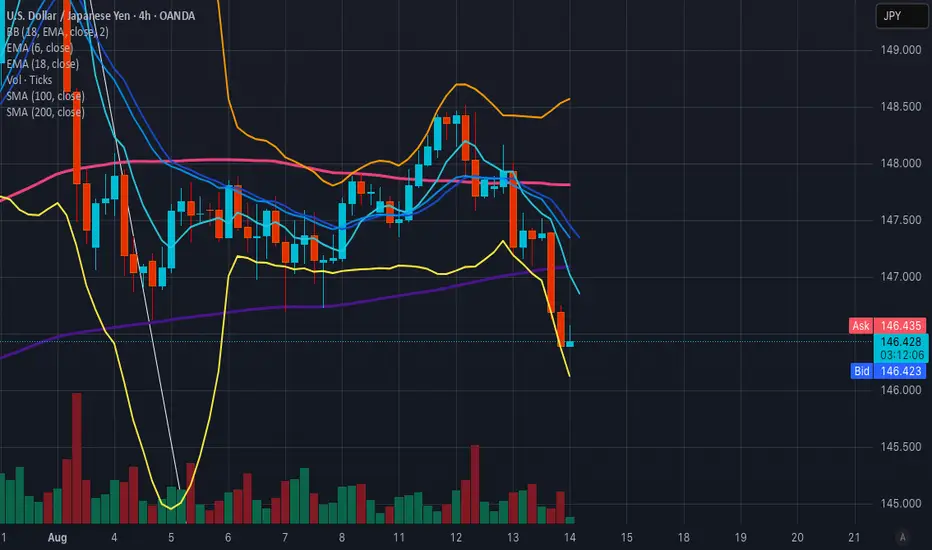
4H structure: After a slide that tested ~146.2–146.4 support, the USD/JPY keeps running into 147.8 and 148.5 as notable 4H hurdles.
Macro/news today: U.S. PPI (July) surprised hotter, cooling talk of a 50 bp Fed cut (market leans 25 bp for Sep 17); Japan Q2 GDP beat aided the yen and BoJ-hike chatter.
BoJ backdrop: July meeting opinions/outlook show a cautious tightening bias and discussion of resuming hikes; 10-yr JGB around ~1.5%.
Positioning & sentiment (latest):
CFTC JPY (non-commercial) net longs have fallen from mid-July peaks to ~82k (Aug 8). Retail (spot) sits near 54% long / 46% short.
Banks’ bias (based on recent published views):
UBS CIO guides for USD/JPY drifting lower through year-end (~140 by Dec 2025) as BoJ tightens gradually, and J.P. Morgan Research also expects weaker USD into late-2025 (USD/JPY ~141 Sep, 140 Dec).
4-hour levels to mark
Support: 146.20–146.40, then ~146.00 (deeper swing shelf).
Resistance: 147.80, 148.50 (recent 4H/spot pivot and swing high).
Scenario A — Bullish (rebound off support / corrective pop)
Why it could play out: Hotter U.S. PPI trimmed aggressive-cut bets; if incoming U.S. data/fedspeak doesn’t further dent yields, a corrective USD bounce can lift price from support toward overhead supply! Go Bulls? :D
Bullish Plan (4H execution):
Entry: 146.40–146.70 on a 4H bullish candle or RSI divergence near S1. (Structure band per the 4H map.)
Stop: 145.95 (clean break of the lower shelf).
Take Profit 1: 147.80 (first supply).
Take Profit 2: 148.50 (recent high / strong supply).
Respect Supports: 146.40–146.20, then 146.00.
Resistances to fade/scale: 147.80, 148.50.
Indicative R:R: from 146.60 risk ~65 pips to stop for ~+120 pips to TP2 (≈1:1.8), +120–190 pips if extension through 148.5.
Scenario B — Bearish (trend continuation from resistance)
Why it could play out: 4H downswing remains intact below 147.8/148.5; BoJ tone leans cautious-hawkish, Japan data firmed (GDP), while CFTC shows less crowded JPY longs (reduced squeeze risk). UBS/JPM public pieces lean medium-term lower USD/JPY.
Bearish Plan (4H execution):
Entry: 147.80–148.00 on a 4H rejection wick / failure swing at R1.
Stop: 148.60 (invalidate above R2 swing high).
TP1: 147.00 (recent intraday base).
TP2: 146.20–146.40 (key 4H demand).
Resistances to lean on: 147.80, 148.50.
Supports to target: 147.00, 146.20–146.40, then ~146.00 if momentum accelerates. Go Bears? :D
BUT WAIT..... Which is more probable now?
As for the team here at How To (dot) Forex, we are collectively leaning bearish (Scenario B) over the next few sessions. And, here is why....
Structure: Price remains capped beneath 147.8/148.5 on the 4H map.
Macro skew: Hot PPI pared back “big cut” bets but markets still favor a 25 bp cut; meanwhile Japan GDP beat + BoJ talk of possible resuming hikes is JPY-supportive.
Sentiment: Retail near 50/50 (slight long) and CFTC net JPY longs off the highs → fewer asymmetric squeeze dynamics for upside USD.
What are the banks saying?
Recent UBS and JPM predictions point to lower USD/JPY into year-end, aligning with fade-rallies bias unless price reclaims R2 decisively.
_________________________________________________
OPINION AND COMMENTARY:
we prefer fade-rally shorts into 147.8–148.0 unless a 4H close above 148.5 flips bias. If you see a strong 4H basing signal at 146.2–146.4, the bullish corrective setup is valid — just keep targets conservative at 147.8/148.5.
If you have questions, or want to see a specific type of analysis not presented here, leave us a comment below. Thank you for reading. We appreciate your support. Happy trading!
_________________________________________________
DISCLAIMER: This analysis was conducted by our in-house team of multi-level traders. We are not responsible for any losses you may incur. Always do you own research before trading. If you are new to trading, consider practicing with a free paper trading account. Ask your broker for details.
Bullsvsbears
TRADE PLAN: Bulls vs BearsHello, fellow traders! We've created a 2-scenario trade plan based on the most recent technical, macro, and trader sentiment using 4 hour charts - because we love you!
1. BULLISH SCENARIO — rebound from support
Price is oversold on the 4H RSI and nearing key support (146.4–147.0). Fed easing expectations are already priced in, so any upside surprise in U.S. data, or lack of follow-through selling, could trigger a corrective rally.
TRADE PLAN:
Entry: 146.40–147.00 (look for a 4H bullish candle or RSI divergence confirmation)
Stop: Below 146.00 (clear break under the next support cluster)
Target 1 (Partial trade plan): 147.80 (local resistance)
Target 2 (Full trade plan): 148.50 (Aug 12 high)
SUPPORT LEVELS:
Support 1: 146.40–147.00
Support 2: 146.00
RESISTANCE LEVELS:
Resistance 1: 147.80
Resistance 2: 148.50
RISK/REWARD: ~1:2 from midpoint entry (146.70), risking 70 pips for 140 pips potential.
__________________________________________________
2. BEARISH SCENARIO — continuation lower
The pair remains in a short-term 4H downtrend after failing above 148.5. Softer U.S. CPI reinforced Fed cut odds, while Japan’s inflation remains >2% with a mildly hawkish BoJ bias — supportive for yen strength.
TRADE PLAN:
Entry: 147.80–148.00 (sell into a retest of broken support / 4H resistance)
Stop: Above 148.50 (invalidated if breakout above Aug 12 high)
Target 1 (Partial TP): 147.00 (intraday swing low area)
Target 2 (Full TP): 146.00 (deeper swing support)
RESISTANCE LEVELS:
Resistance 1: 147.80
Resistance 2: 148.50
SUPPORT LEVELS:
Support 1: 147.00
Support 2: 146.00
Support 3: 145.80
RISK/REWARD: ~1:2.5 from midpoint entry (147.90), risking 60 pips for 150 pips potential.
_________________________________________
PROBABILITY ASSESSMENT (based on our most current data)
Bearish case is slightly more probable near-term because macro backdrop favors JPY (BoJ gradually normalizing, U.S. rate cut expectations rising).
Price action still in 4H downswing with momentum (MACD) negative and resistance overhead. CFTC data shows yen longs reduced — less chance of a squeeze higher on short-covering. That said, oversold conditions mean bullish bounces are possible, but likely corrective rather than trend-changing unless U.S. data turns hawkish again.
We hope you found our analysis helpful and thank you for reading. Follow us here on TradingView for more up to date analysis. Happy trading!
__________________________________________
DISCLAIMER: Our analysis is not 100% absolute. We are not responsible for any losses incurred. Please be sure to do your own research before investing or trading.
Unveiling the Battle Between Buyers and Sellers🕯📈🤝
Introduction
Candlestick charts are a cornerstone of forex trading, offering valuable insights into market dynamics. One key element of a candlestick is the size of its body, which provides crucial information about the strength of buyers and sellers. In this comprehensive article, we'll explore how the size of a candle's body reflects market sentiment, provide real-world examples, and equip you with the knowledge to make informed trading decisions.
Understanding Candlestick Bodies
The body of a candlestick represents the difference between the opening and closing prices within a specific time frame. Its size and color convey essential information about the battle between buyers (bulls) and sellers (bears).
Interpreting Candlestick Body Size
1. Large Bullish Candle Body:
A candle with a large bullish body indicates strong buying pressure. In such cases, the closing price is significantly higher than the opening price, suggesting that buyers have dominated the market during the given time frame.
2. Large Bearish Candle Body:
Conversely, a candle with a substantial bearish body signifies strong selling pressure. The closing price is well below the opening price, indicating that sellers have dominated.
3. Small or Doji Candle Body:
A small or doji candle body suggests indecision or a balance between buyers and sellers. The opening and closing prices are close, and the body may appear as a thin line or a small box.
Relevance and Trading Strategies
1. Trend Confirmation: Large bullish or bearish candle bodies can confirm the strength of an existing trend. Traders may use such candles to enter or add to positions in the direction of the trend.
2. Reversal Signals : Small or doji candle bodies near support or resistance levels can signal potential trend reversals. Traders watch for follow-up candles to confirm reversal patterns.
3. Volatility Assessment: Candle body size can also provide insights into market volatility. Larger bodies often accompany higher volatility, while smaller bodies indicate calmer market conditions.
Conclusion
Mastering the interpretation of candlestick bodies is a valuable skill in forex trading. It enables traders to gauge the strength of buyers and sellers, confirm trends, identify potential reversals, and assess market volatility. By incorporating this knowledge into your trading strategy, you can make more informed decisions and enhance your ability to navigate the ever-changing forex market. 📊🕯📈
Please, support my work with like and comment!
Love you, my dear followers!👩💻🌸

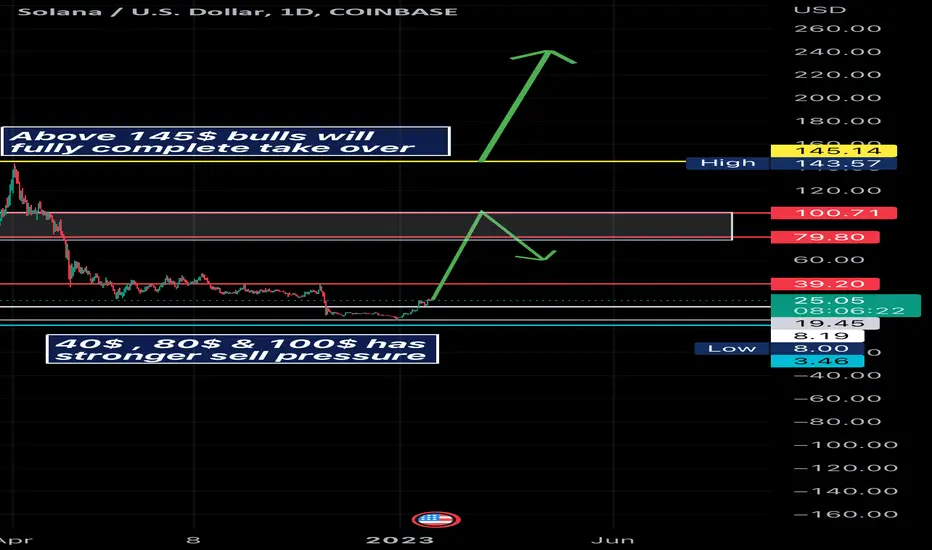
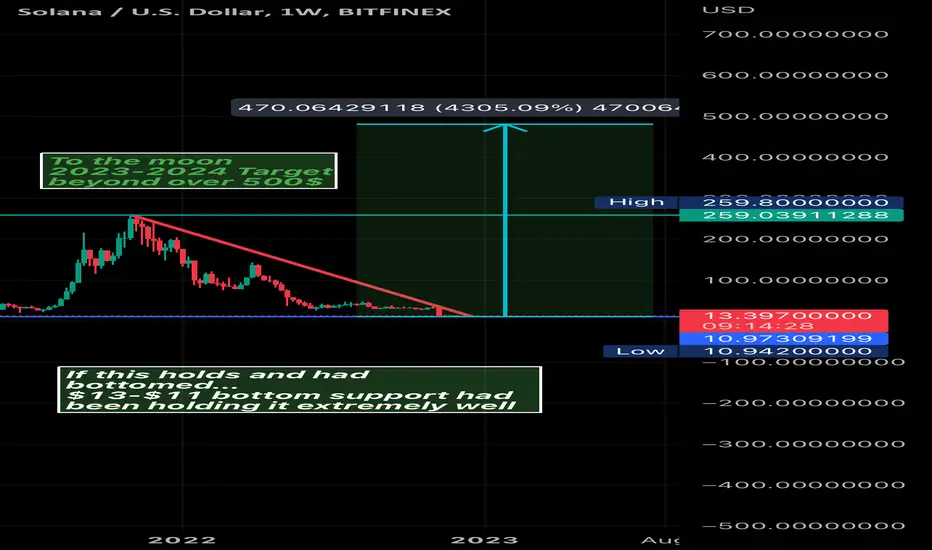
Solana still onto the bullsListen very carefully there are big 3 obstacles of resistance that solana needs to break.
40$ zone
80$ zone and lastly 100$ area. I. Order to get that high then bulls should need to go sideways upwards and short dip retrace. It won’t be easy because of the Feds still increasing rates and inflation still high.
It’s pretty spikey so I highly suggest buy it now before goes over 26$ the early you buy at 25 zone the better.
Watch any reversals; it will be very unexpectedly no matter buy or sell.
Overall in order bulls to take control and take over 150$ zone is the target to breakout even further to avoid sell pressure and sell off.. once you buy .. don’t take profit to early; always take profit at the new high.
Watch any bearish reversal y’all
If solana had already bottomed…13-11$ bottom support had been holding really strong and well.
If this stays holds well strong then we are going up to the moon.. and stays intact, first target will be 80$ then bullish fully breakout over 100$ then the huge bull market rally will begin.
2023-2024 bullish ATH rally target will be 500$ and beyond.. beyond as in 1000$ if it’s before 2025 or mid 2025 then I’ll be surprised
If the bottom is in.. highly advance go all in.
If this turns around then more collapse will come if this doesn’t hold it will accelerate very quickly of the drop. Trade safe and good luck.
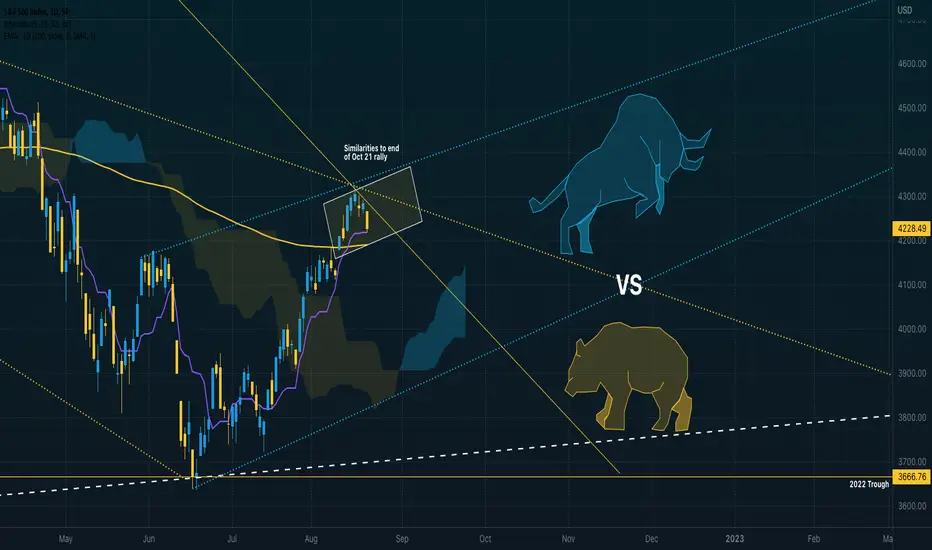
Bulls VS BearsI make most of mistakes when my bias is too bullish or bearish and I miss opportunities on the other side of the trade.
I find it useful to take a step back, clear off my indicators, channels and patterns and look at where we are in the markets with a fresh unbiased opinion.
You'll often find me posting about being bearish while charting bullish patterns and vice versa.
I was convinced spx would hit 5000 before a decline.
But I was charting bearish H&S at the same time.
You know the saying, “Markets can stay irrational longer than you can stay solvent."
To that I say "Hold my Beer"
...........................................
Bull Case
Bull sees a seasonality weak September and equities overbought at the top of potentially a new bull channel.
The Bull is looking for strong Christmas and Employment numbers along with lowering CPI and acceptance of 900B/M of Treasuries.
Smart Bulls realize there is over 2 Trillion in overnight repo and expects it will cover much of the first few months of QT.
Bull wants Fed to slow rate hikes of 50bp or lower and maintain neutral status.
Bull is concerned about event vol on the next upcoming election as tensions rise after the recent political FBI raid. The bull is hopeful there is not a repeat of the last election.
Bull sees a time of consolidation and hedges for short to medium term growth of 3.5-5.5% using a put spread collar around their assets.
The Bull must defend the Tenkan-Sen (Conversion Line) after successfully defending it on Fridays sell.
Failing Tenkan-Sen will quickly see a retest of the 200D EMA.
If Tenkan-Sen and 200D EMA fail, a retest of Ichimoku Cloud would quickly follow by the middle of September indicating a return to bear market.
...........................................
Bear Case
The bear is weak from the past 4 weeks of short squeezes in technology, speculation and meme stocks.
A smart bear realized the significance of the bottom being the same price difference of March 2022 decline and likely joined Bulls in the recent short squeeze rallies.
A bear realizes markets are very leptokurtic and follows volatility, volume and liquidity very closely waiting for signs of a weakening economy to appear.
The bear wants a hawkish Fed hike of 75bp or higher and plans for higher CPI numbers in Sept.
Bear is likely to place heavy bets around upcoming CPI, Fed Meeting and Quad witching.
Finally, the Bear is expecting 900B per month in Treasuries to weaken an already struggling Bond market and deep inversion on yield curves.
In either case... Bulls don’t buy the top and Bears be patient.
bittyinteresting point here--- the cap or volume is at 25 billion
does that mean a bullish movement is about to take place
has the market found a cushion or pillow to rest on---and were
going towards an upward trend----because you know we had a downturn the last 9 months
can bulls and bears manage to work together to a new high---
or will bulls fail.
is the bear season over----- I believe so. hoping for 23 months and 1 week of bullish charts at bare minimum---there will be 2-3 weeks at a time that will or could be bearish. but for the majority its bullish for 23 months and 1 week at minimum.

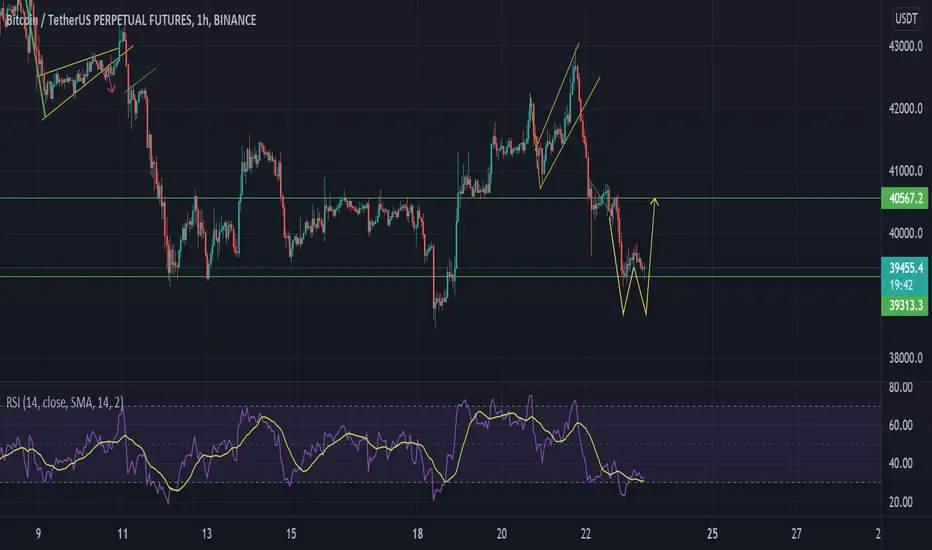
WILL BTCUSDT BOUNCE ??Hello !!
Welcome to the quick update of BTCUSDT. It is moving in a downtrend since 28th March. As of now, it is oscillating in the range of 39k to 43k. In a shorter timeframe, it is making a W pattern where we may soon see a bounce to 41k. As of now, the price is 39300, and we expect it to take a bounce from here and reach 41000 then 43000 which is the major resistance.
If BTCUSDT goes further down i.e. breaks the support of 39200, we may soon see 38000 which will bring a blood bath in all the altcoins. As of now, it's a no-trade zone for me, lets's see how this pans out. Please save your capital and wait for the confirmation to take new trades.
This is not financial advice, please do your own research before investing and we are not responsible for any of your losses or profits.
BTCUSDT : SHOULD YOU BE WORRIED ??Hello !!
Welcome to the quick update of BTCUSDT. As posted in my last chart, BTC was taking major support from 39200 again and again and was making a move until 40000. But, the move didn't sustain and there were very less buyers at the 39300 level. After taking multiple support from 39300, it eventually broke it and went all the way until 38620.
As of now, the 39300 level has turned into the new resistance and needs to break in order to make a move further. We saw some buyers at the 38620 level which pushed the price to 39200, as of now we can see that BTC is retesting the support turned resistance and there can be more downside momentum.
The important levels are marked in the chart. I expect BTC to retest 39300 and again dump until 37600 before making a move upside. Please stay vigilant of your trades and wait for confirmation and the right moment to enter any trade.
This is not financial advice, please do your own research before investing and we are not responsible for any of your losses or profits.

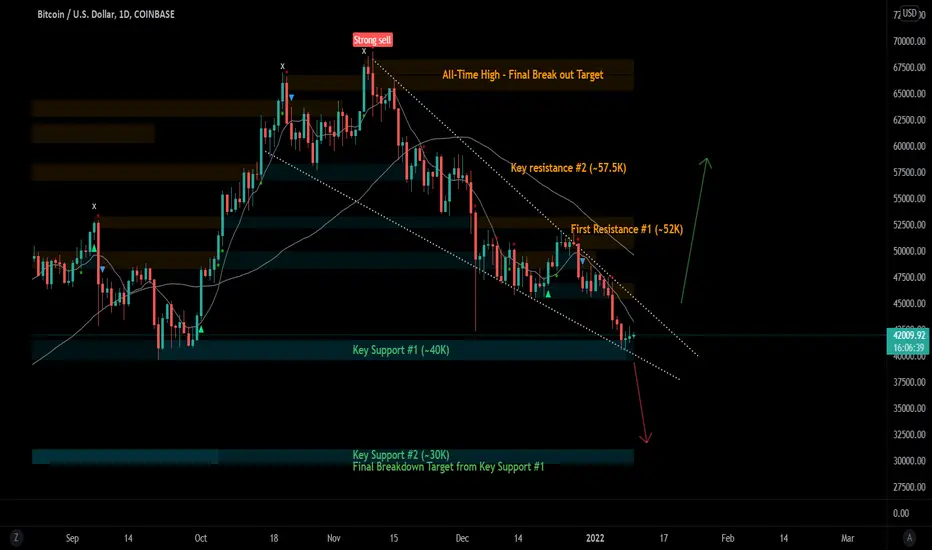
Bitcoin Analysis : The Next MoveHello all,
After calling the Top in Bitcoin & the most recent fall at 47K we introduce you to our next trade setup. We will update as the price action continues.
--------------------------------------
Long-Play:
A candle break and close above the falling wedge resistance we will then place a long position targeting the 52K region and beyond. Be cautious of a fakeout at the ~46.5K resistance.
Short Play:
A candle break and close below the 40K key support we will look to place a short position to retest the 30K support. Be cautious of a violent drop followed by heavy buying pressure resulting in a long wick.
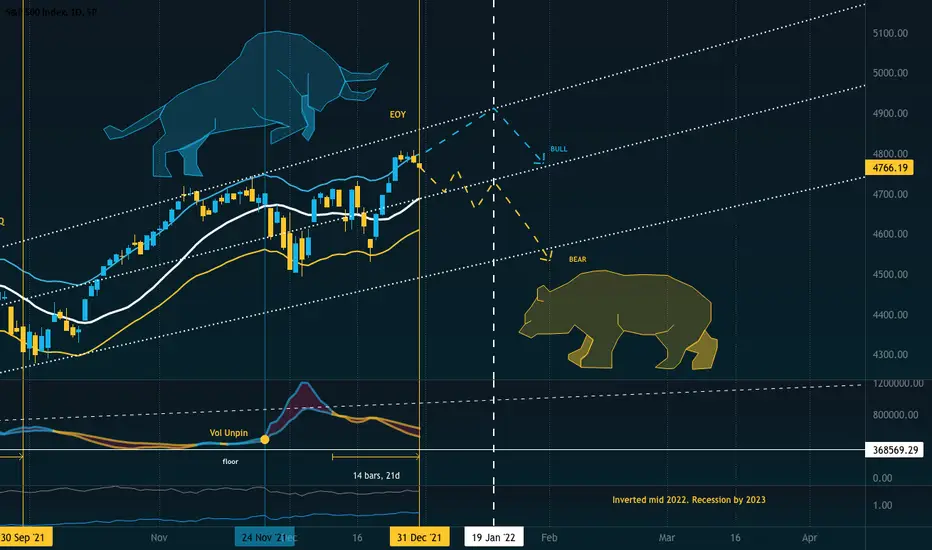
January Bull vs BearThis chart is a general overview of the SPX for the past year, broken into quarters with a few croissant crumbs in it.
Either bull or bear should respect the 20d MA and 2 standard deviation channel above and below.
It is to help me measure risk and how well my trades will perform. If I’m buying short-term calls outside the blue line after DEC 28th, it's probably not going to pay well because the indexes were already at the top of the 2stdev over the 20d.
There are cases in the past that the index does break above this trend and stayed near the top/bottom of this resistance level, but not for very long. This means bears will be looking to push lower on the indexes the first half of this month.
Bulls however have proved formidable through the most recent bearish news and hawkish outlook from the Fed. With new flows coming in for the new year and institutions having a war chest available there is still a strong Bull case and we could see more short squeezing into all-time highs (ATH) for the first half of the month.
The feds policy plans for 2022 should serve as a warning that the bull run may be over. Elon was mocked for predicting a recession in late 2022/2023. He is in good company though because most of fintwit is predicting steep declines for the year ahead.
However, never try to tell a BULL that. When you know it can only down is the most likely time it will continue to grind up on the blood of BEARs.
BULL CASE
Santa rally traditionally continues into the first 2 days of the new year. New inflows of money and short squeezes may continue to grind the S&P higher along the top of the 2stdev of the 20d followed by some sharp selling off on or just before JAN 19th VIX OPEX.
JAN ATH ~4907
END JAN ~4763
BEAR CASE
What could be lining up as the year of the Bear I would expect to see more sideways trading and periods of large corrective moves downward. These moves would likely start arriving around windows of weakness in the options market like we saw in the 2020 feb/mar correction. Some speculate this would be a much harder of a drop because the fed can not lower the interest rates any longer. I do however anticipate the pow may already have a plan to facilitate a more transitory approach to tapering.
As for my Bear Case, I see an early decline into the 20d followed by lower lows and capitulation ~2std below 20d before a health correction territory in Feb/Mar
END JAN ~4534

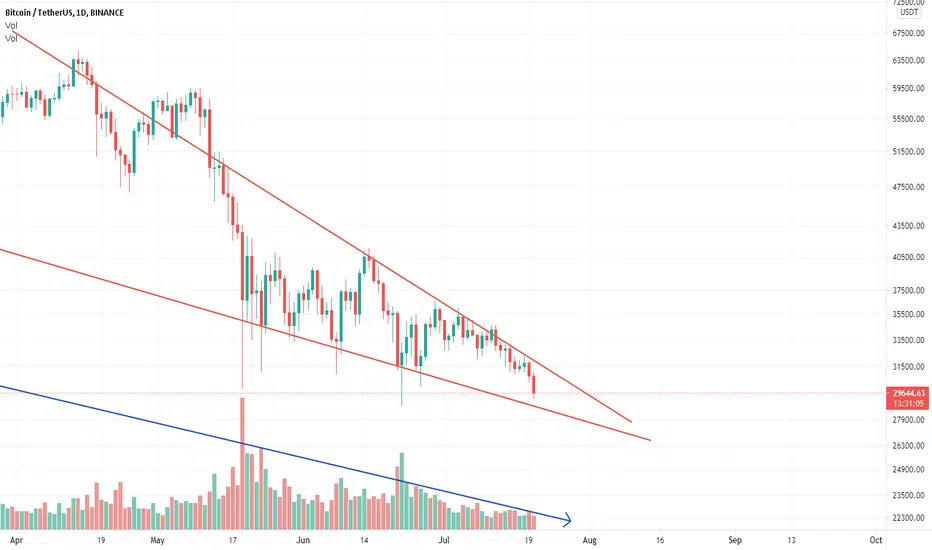
BITCOIN FALLING WEDGEBitcoin falling wedge still playing out on descending volume.. A push above the upper trend line with volume would be the first bullish signal I would like to see!
DJI at a critical level - Bulls pray it doesnt break this 👿☠️👹DJI aka Dow Jones Index has been sliding south for the last 7 days, but considering that it has been going up for last few months it is not surprising to see this kind of pullback. Now the issue becomes, will this index keep having losses till it collapses to the abyss or this magic line is going to save the trend and push the bulls up to the moon as they say? Lets dive into the charts and analyze.
This chart is straight forward, the Dow Jones Index has been following this trend line since November 2020 and now it is coming to retest the trend line. As I post this TA, it is kissing that line. To me it is not much of a concern until we close one daily candle below this line, if this happens it will be a warning shot and I may start re-evaluating my long term bullish positions.
On other indicators, daily PSAR looks bearish, price below 21EMA which is bearish but on the bullish side price is above both 50MA and 200MA and the blue trend line.
At the moment I am neutral and I am holding my positions until something changes. I will keep you updated as things change.
If you like these TAs, please smash the like button and share with your friends and other traders. Have a great week ahead.
XTF.

If Fed had a face Do they close they as a trap for bears? or they close the eye as a warning to bulls?

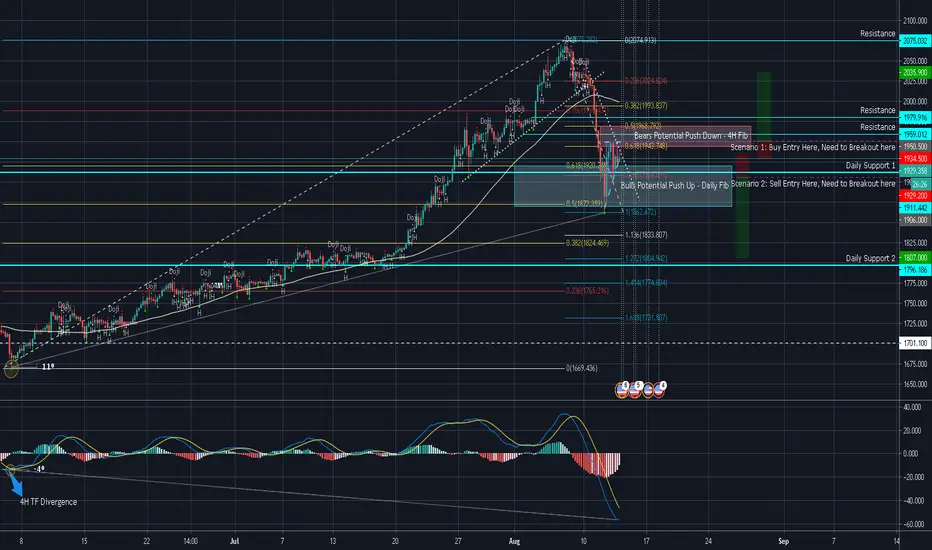
XAUUSD Technical Analysis, Scenario 1 and Scenario 2DISCLAIMER : Take at your own risk . Past results does not reflect future results. Please use PROPER MONEY MANAGEMENT. IF IN DOUBT, GET OUT.
OANDA:XAUUSD
Analysis:
Daily TF: Daily Trend is an UPTREND and is above 50 MA. Previous Day Candle is Spinning Top, Market is in tug of war, no clear indication of where it will go. Daily Fib indicates that it hit and area where BULLS would potentially push the market up. Price Action hit "Daily Support 1" which was tested Aug/23/2011 and Sep/06/2011 where in both occasions the BEARS pushed the market down. There was previous consolidation from Jul/08/2020 to Jul/17/2020 in the range of 1787.60 to 1814.80 in which the BULLS pushed the market up after Jul/17/2020. This area is now a Price Reversal Zone which means that if BEARS take the price to this levels, potentially BULLS will resist and push the market up.
4H TF: 4H Trend is starting to look like a DOWNTREND and is below 50 MA. 4H Fib is showing that it hit an area where Bears would potentially push the market down further. However, there is potential Divergence in this 4H TF as the slow line (MACD LINE) is curving and histogram is showing a slowed momentum from BEARS.
1H TF: 1H Trend is a DOWNTREND, is below 50 MA and approaching the 50 MA curve. 1H TF has a Bullish Pennant Flag with a Flat Top. This indicates that BULLS are pushing the market up to a certain extent before the BEARS take over with lower volume.
Breakout Strategy:
Scenario 1: BULLS push market up,
Buy Stop: Entry: 1950.50, SL: 1929.20, TP3: 12035.90, TP2: 1979.90, TP1: 1959.00
Scenario 2: BEARS push market down,
Sell Stop: Entry: 1906.00, SL: 1934.50, TP3: 1807.00, TP2: 1845.70, TP1: 1884.00
These values are from my own analysis. You can move SL around to what you are comfortable with. Use proper Money Management. Beginners to note XAUUSD is per tick not per pip, so 1 tick is 0.01 for lot size 0.01. If you don't have proper management, don't take this trade. IF YOU IN DOUBT, GET OUT.
CPE bull vs bears battleIf bulls starts to play, this could achieve an objective price around 1.43 in next weeks.
Indicators can be useful to understand the movement:
RSI14: 50.21 RSI21: 45.79
%B: 0.3656
VOL is also low
EMA 20 is getting closer to EMA25, but not enough.
Both low with a good chance to go up.
This is not an investment advice of any type.
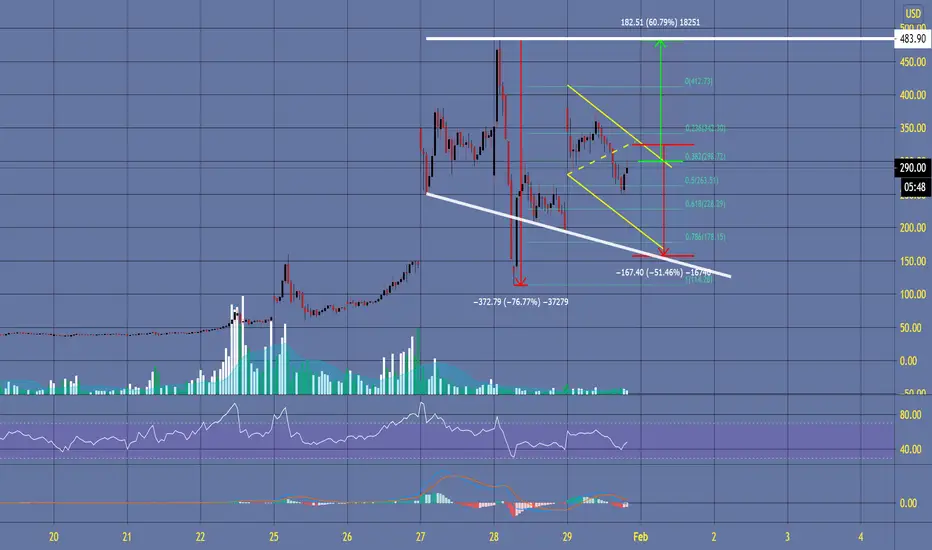
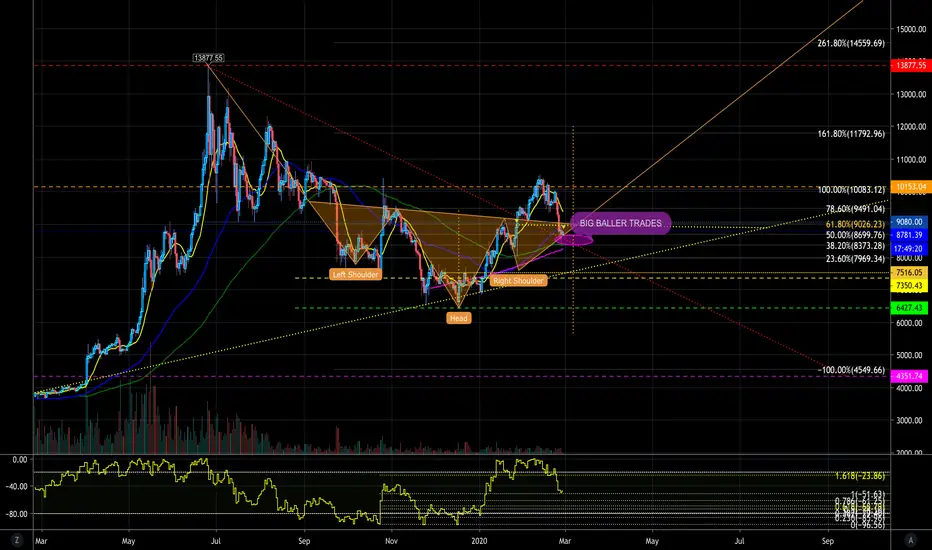
Big Baller Trade Area for the Orange Inverse Head and ShoulderAll have been said in the previous posts.
The most crucial area is the Magenta Elipse that I called the Big Baller Trade Area where the Bulls or the Bears will lost their Shit!
It's just between the 0.5 and 0.382 Fib Retracement of the last uptrend.
From that Big Baller Area, both targets of Macro Higher High or Macro Lower Low can be seen.
Are you going to play this Area? I personally got burned over there.... so Good Luck to you!
#Good Luck #The ColorChartist
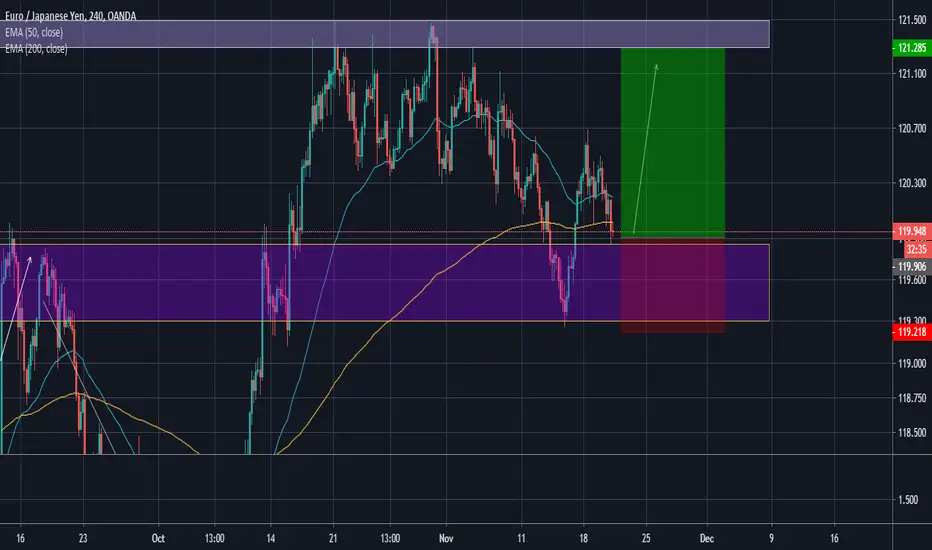
Potential Long on EURJPYTechnicals: Price has made a strong push to the upside and is currently retesting the zone it's pushed through recently. This in my opinion is an exhaustion. Price is just waiting for a re-injection of BUY pressure before heading to the upside.
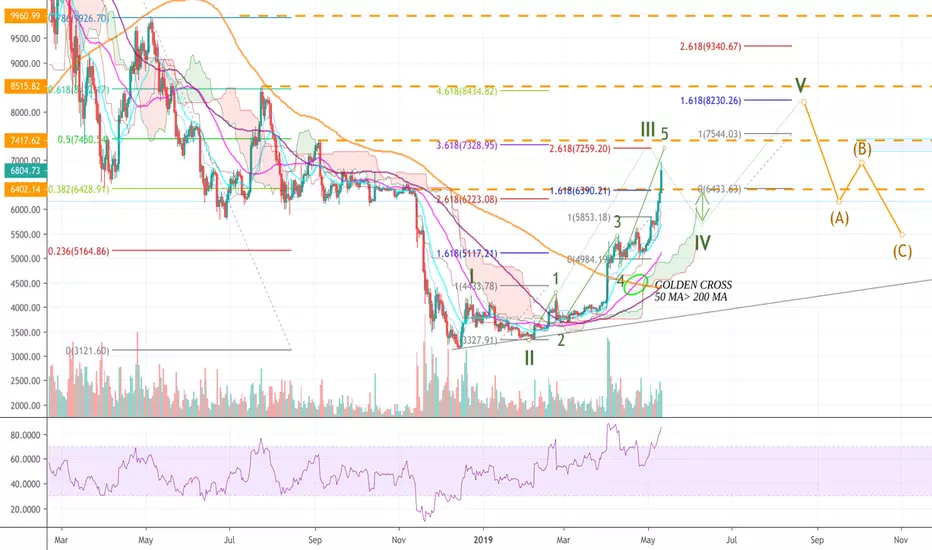
BTC Elliott Wave Variation Targets(x 3.62- 7250-7450 WAVE 3)These are some of the variations that bitcoin may choose to follow. So far it has chosen the most bullish path. There are 2-3 additional targets for wave 3:
1. x3.62 *Wave 1: 7250-7450
2. x4.25 *Wave 1: 8000 (also a psychological resistance)
3. x4.62 *Wave 1: 8350-8450
Since the intermediate wave 5 is maximally extended to 2.62, this means that most likely the target for the large wave III will be option 1, or x3.62 (7250-7450).
If this will be the case, there will be a retraction labelled as wave IV, and it's potential targets are:
1. 6350-6500
2. 5750-5850
Otherwise, if the extention is x4.25 or x4.62, there will be different retraction levels for Wave IV, that I will update on if necessary. Wave V targets are labelled, but at this points it is very hard to forecast wave V as it is the riskiest and at some point we might even see a bearish reversal (BITCOIN historically hasn't performed well over the summers).
On the left we have the resistances from the previous highs at 11800. Interestingly enough the 7450(0.5) level coincides with the x3.62 extension and the 8450(0.62) coincides with the 4.62 Wave III extension. Now that we've crossed 6400, these will be the next hard resistances bitcoin will look to break, or retreat from. Remember, bitcoin is still bearish turning into neutral on the weekly. Anything can happen so, comment your wave count and explanation.
If you liked this Elliott wave take on bitcoin, give it a thumbs up and follow for more. There will be plenty of detailed analysis over the summer.
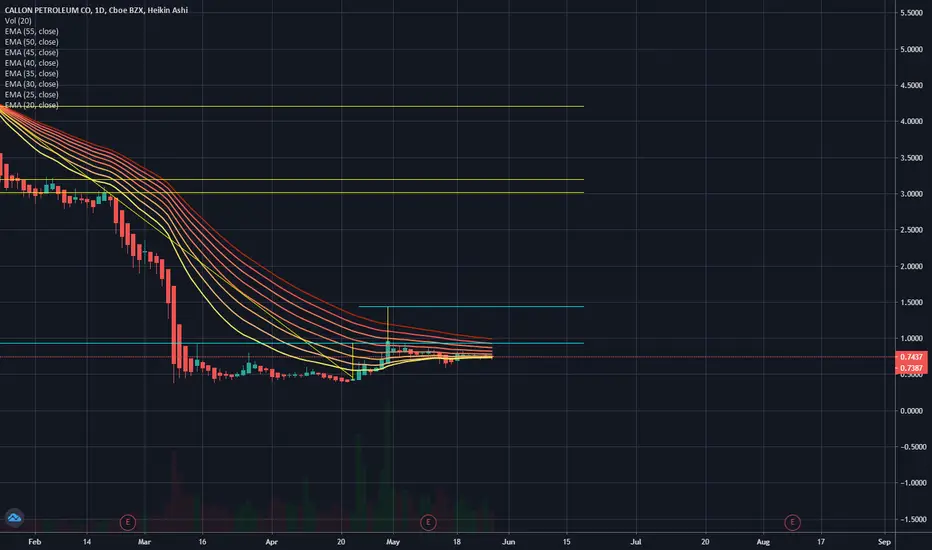
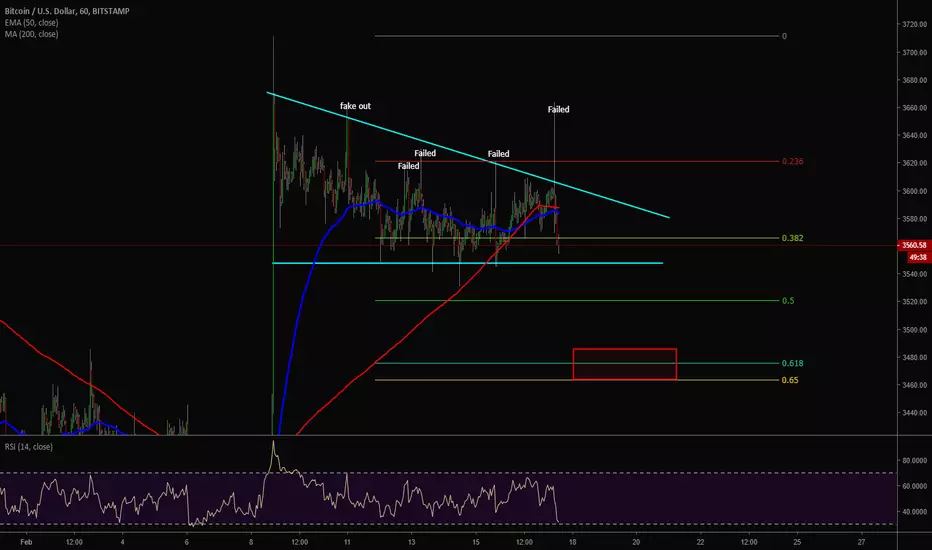
Fail after fail after....failBulls have really tried hard to get out this trading zone... but obviously the bears control the market and the bulls running out of steam.
I really think its time to go down to lower levels. first stop 0.65 area.
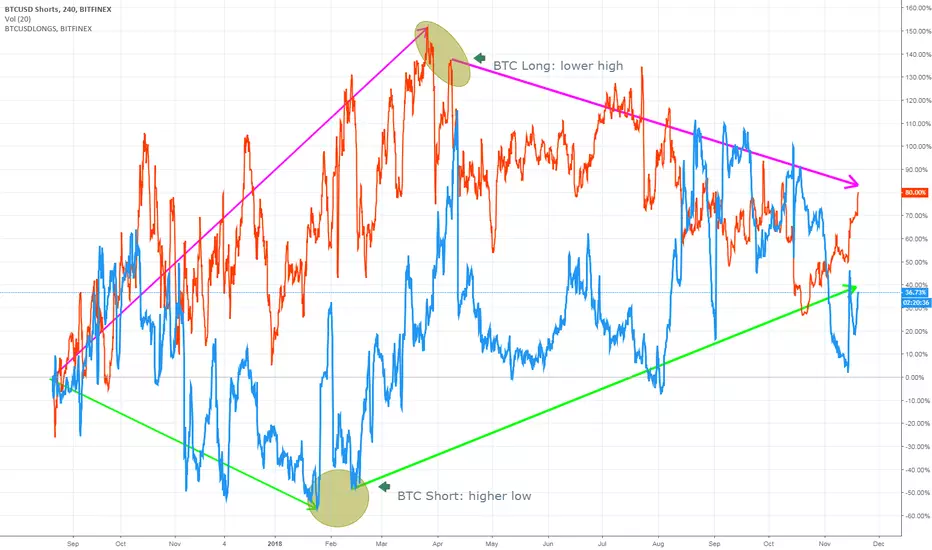
BTCUSD: Bulls vs. Bears - how convicted are you?This chart is a simple overlay of BTCUSDSHORTS (Blue) vs. BTCUSDLONGS (Red). It's obvious - since the end of 2017 BTCUSD the overall Bullish/Bearish conviction has changed from bullish to bearish. The lower highs at the bullish side indicating a loss of bullish conviction. On the bearish side, higher lows are showing more and more bearish conviction.
Furthermore, BTCUSD has fallen under 5k USD and there is no V-shaped correction yet, which would indicate a high interest to buy BTC at such a "low" price. Why is there no V-shaped correction? The answer is very simple - more and more trader are NOT convicted of an increased BTCUSD price and more and more trader are convicted of a decreasing BTCUSD price.
This leads me to conclude a further downtrend of BTCUSD price.
Note: This is my first post and feel free to give me feedback or a like. If you disagree, feel free to comment your thoughts. We have all the same goals, and I am very convicted, that we all can learn from each other. :)