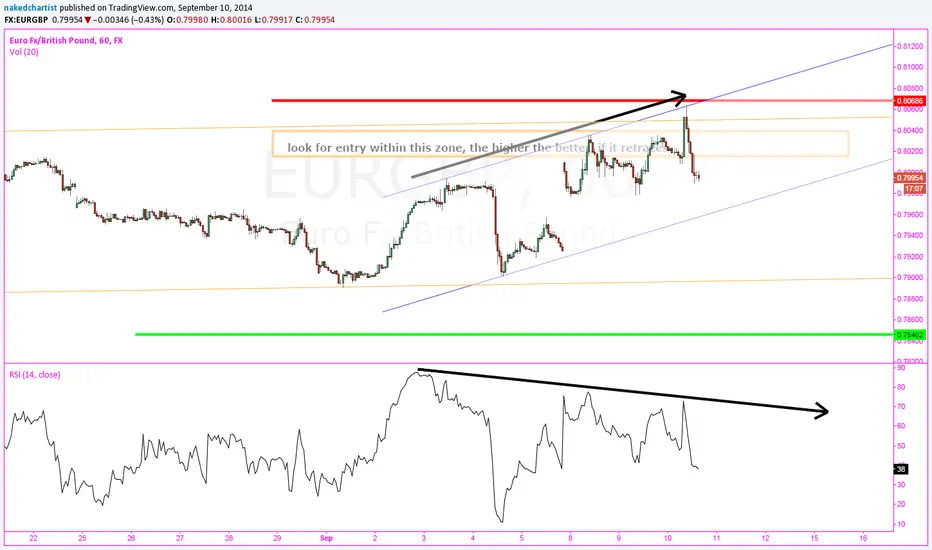
EURGBP h1 short after bull trapfinally a h1 setup has taken shape after price decided to test the big channel top. on lower time frame , a multi day bull trap has been formed and there is a channel within channel confluence already completed , with macd divergence to support. Since I already have prior entries few days back, I will continue to hold and add on shorts within the orange zone.
On day chart price is trending, so aiming for 7800 level is realistic. however, do take partial tp along the way to lock in profits.
Bulltrap
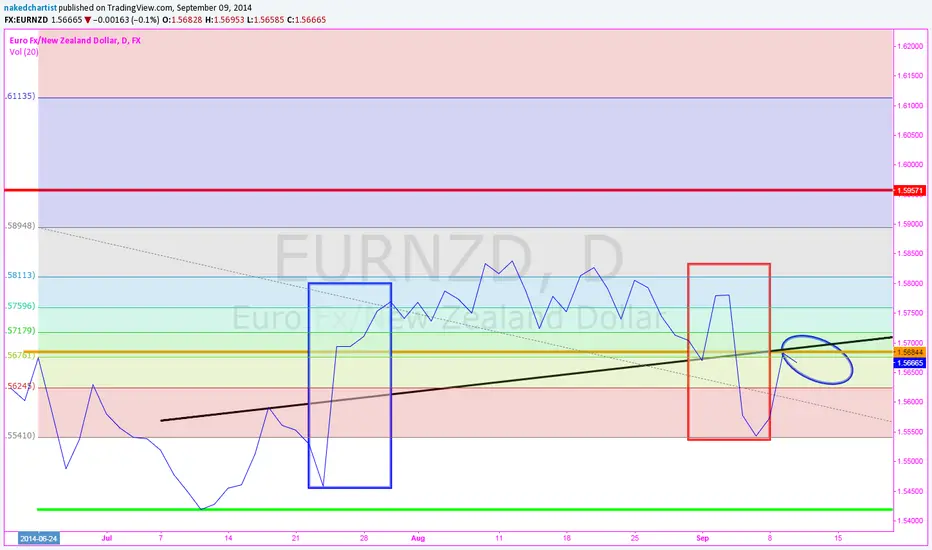
EURZND cash rate shortshown in the chart will be 2 boxes , blue and red. Blue denotes a strong bullish expansion week, and thereafter price consolidated for 5 weeks. The chart pattern looks to be distributive in nature, and it is confirmed with a bearish expansion week. Right now price is back at the neckline. I will like to see this as a retest of this distributive strucuture and look to short somewhere close to the retest.
There is a f5 and line chart confluence but h1 setup not shown yet.
I hv placed a hard stop of above this whole structure, but cash rate on thursday will decide the next impulsive move.
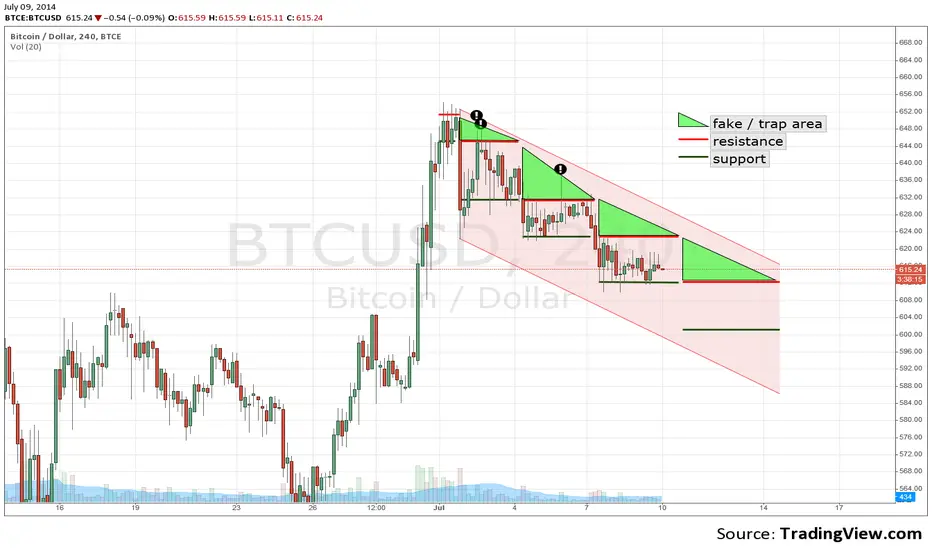
Why I am still shortSupport became resistance. If this keeps going, we will face the <600s in a few days. But keep in mind that 600 will be a natural resistance line. Like the 550 and 500. I am pretty sure that we will meet at 450 again. Proof me wrong because I am still owning Bitcoins. Bought them, when one was worth around 50-90 EUR.
I try to get in a short entry position while the price is near the resistance (former support) and take some profits here and there - normally when the price is near the support line.