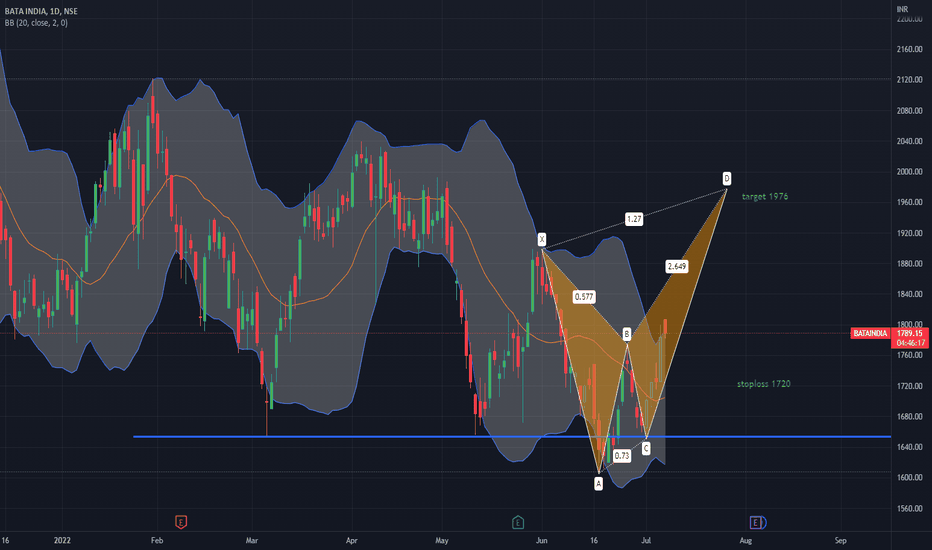
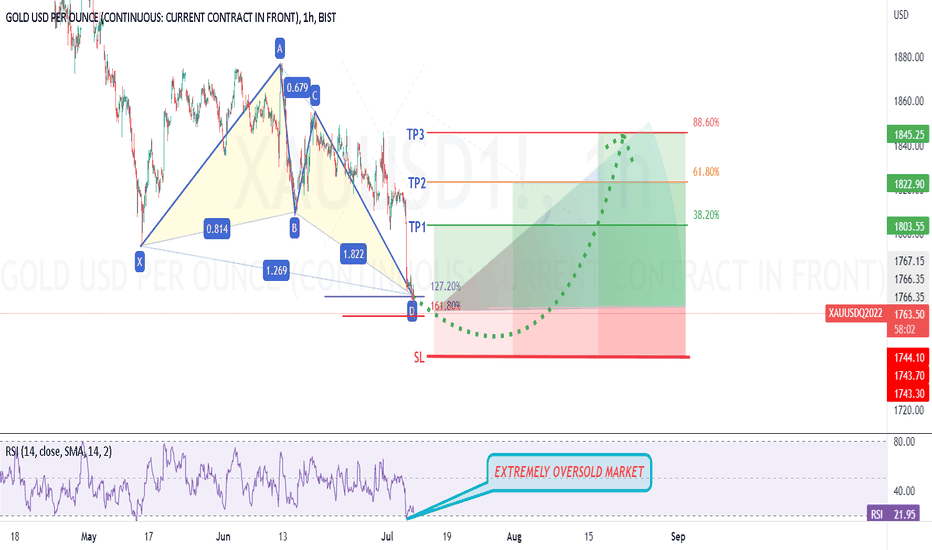
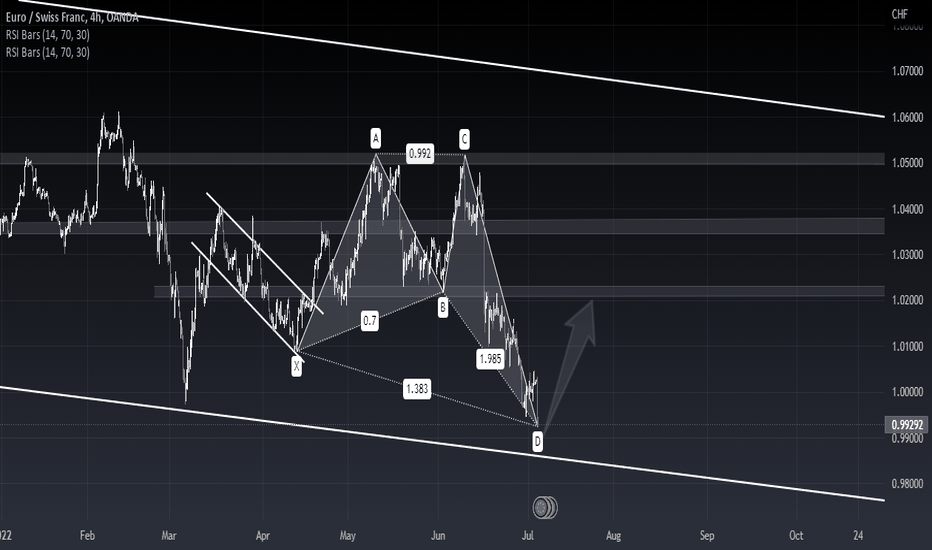
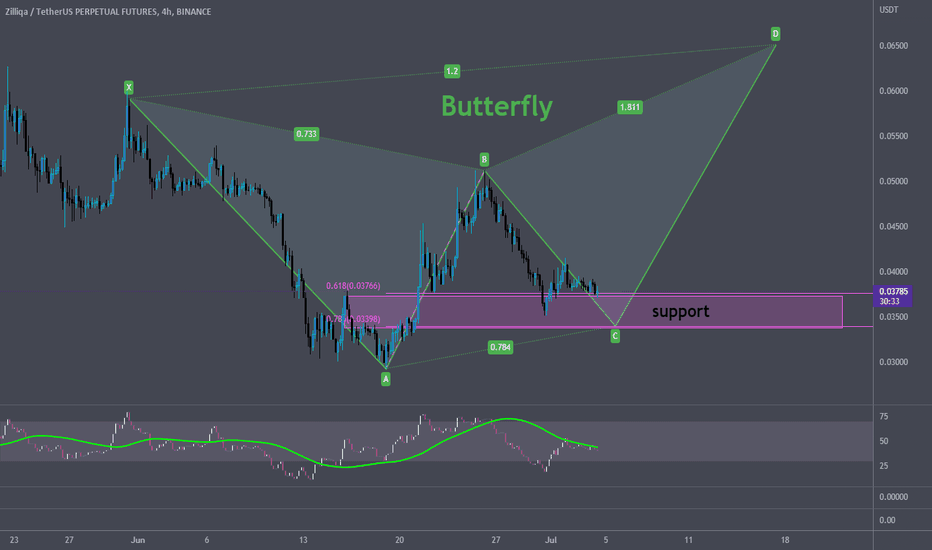
Butterfly
USDCADUSD/CAD has been carving out a range since last July, and given the generally strong USD environment it may be ready to begin a sustainable trend. Recent behavior backs this notion up with price action strengthening.
The area around 12950 up to just over 13000 has been a tough one for USD/CAD to overcome, with the 12950 level having been in play since the end of 2019. There was a brief break in the middle of May, but short-lived before another big swoon lower furthered along the range.
What has transpired in recent weeks has been of interest. Another run tried to develop last month, and while it failed, a low was quickly put in at a much higher level that at any time before. This suggests that resistance is starting to lose its impact and a shift towards higher levels is beginning.
A breakout into the 13100s holds will be key. This will start to get USD/CAD firmly into higher territory outside of the range. If we see this develop soon, a trend towards the 2016 and 2020 highs over 14600 looks like it could be in the works. It seems like a long way from here, but given the high-vol regime we are in it could come much faster than one would expect.
On the flip-side, if we see recent strength give way to selling it will be important to see price hold up above 12819. Otherwise, if that doesn’t hold look for more of the same old range, with a move back towards 12500 or worse developing .
Source : Dailyfx
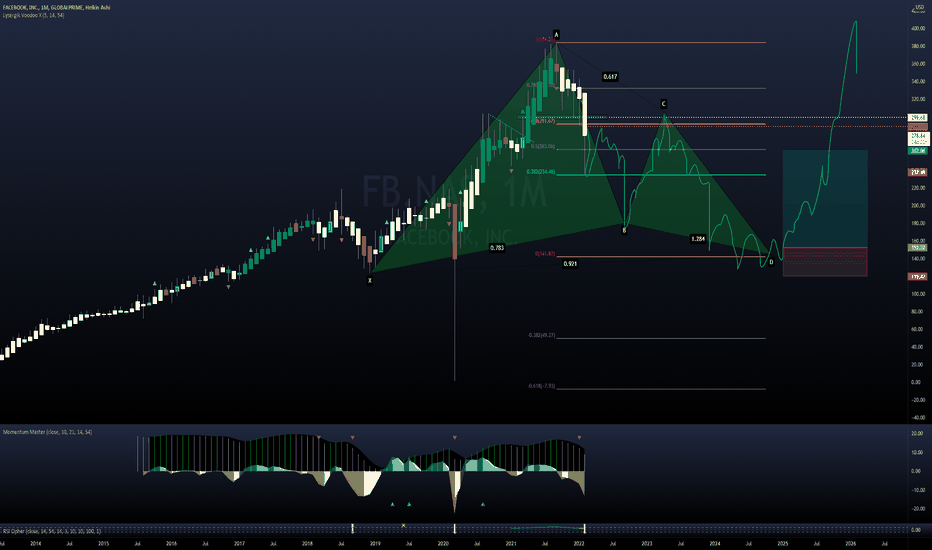
Potential Butterfly for Facebook (Monthly)Until we see a confirmed B point at the 78.6% retrace, this pattern is nothing but purely speculative.
The long position shown on the chart is the technical trade, but on a monthly chart I would personally just stick to investing :D
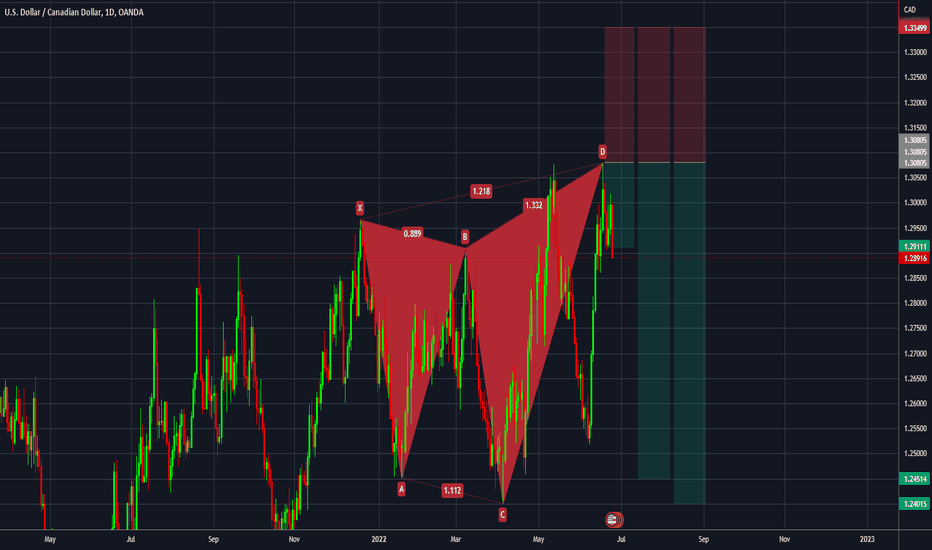
Bearish Butterfly D1Open - 1.28916
TP1 - 1.29099 (target already reached)
TP2 - 1.24514
TP3 - 1.24015
SL - 1.33499
Please note that my setups are not signals to trade but my own personal analysis and predicted direction. To enter a trade it must be validated by multiple different indicators and confluence factors.
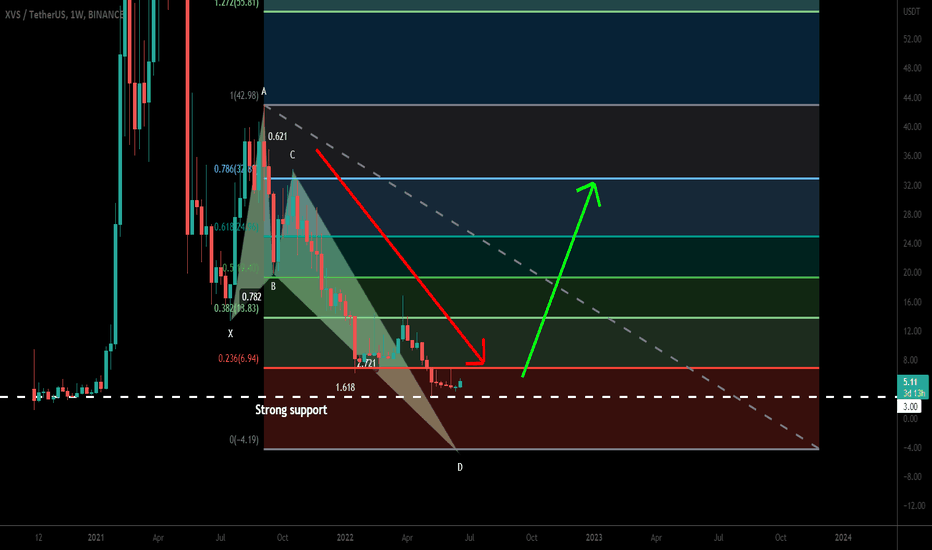
Venus (XVS) formed bullish Butterfly for upto 990% massive pumpHi dear friends, hope you are well and welcome to the new trade setup of Venus (XVS)
On a weekly time frame chart, XVS has formed a big bullish Butterfly pattern.
Note: Above idea is for educational purpose only. It is advised to diversify and strictly follow the stop loss, and don't get stuck with trade.
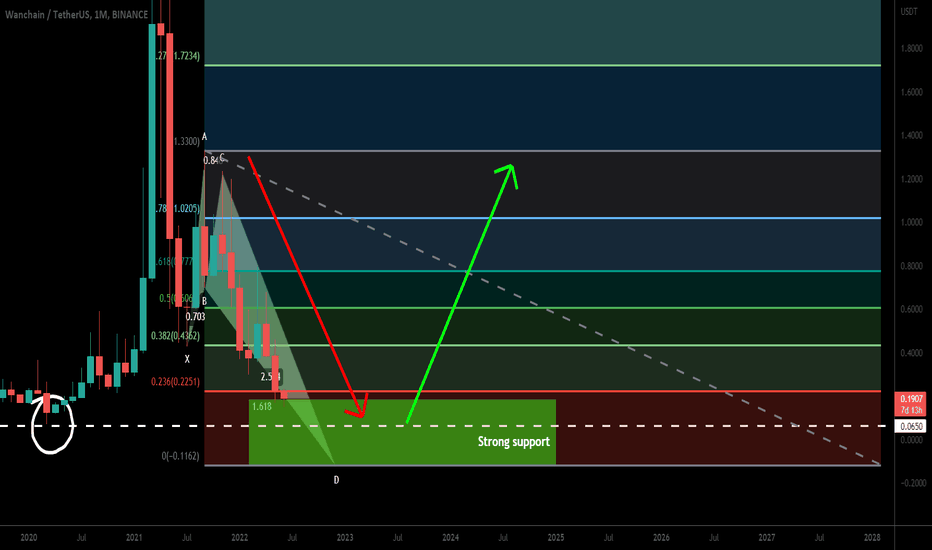
Wanchain (WAN) formed bullish Butterfly for upto 1400% huge moveHi dear friends, hope you are well and welcome to the new update on Wanchain coin (WAN).
Previously we had a nice trade of WAN:
Now on a monthly time frame chart, WAN has formed a big bullish Butterfly pattern.
Note: Above idea is for educational purpose only. It is advised to diversify and strictly follow the stop loss, and don't get stuck with trade.
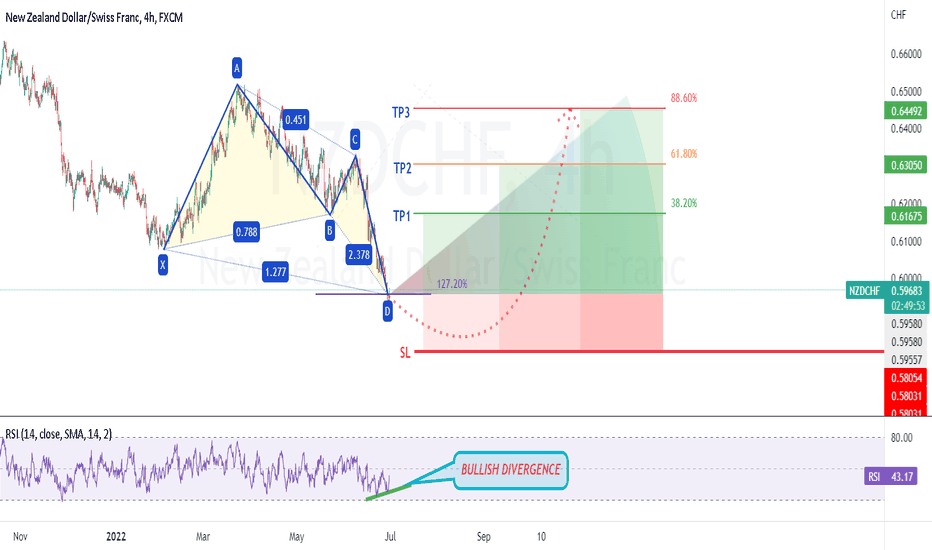
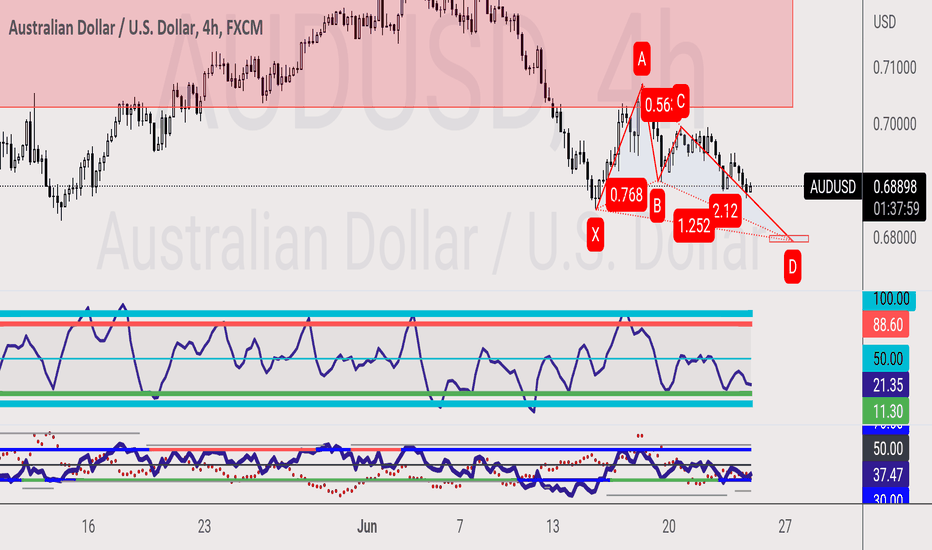
AUDUSD - Bullish Butterfly Pattern A potential Bullish Butterfly Pattern might just catch the falling knife. I'll be waiting for the candlestick touch the furthest line of the rectangle at Point D and show me a confirmation sign to engage the trade.
Retest on Point D will not be the requirement for this trade.
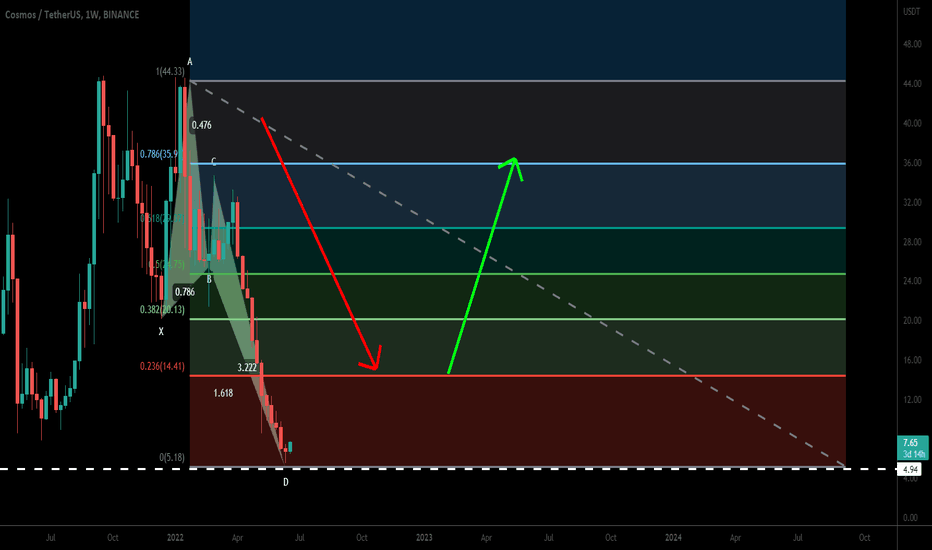
Cosmos (ATOM) formed bullish Butterfly for upto 634% big pumpHi dear friends, hope you are well and welcome to the new update on Cosmos (ATOM) coin.
On a weekly time frame chart, the price action of ATOM has formed a big bullish Butterfly pattern.
Note: Above idea is for educational purpose only. It is advised to diversify and strictly follow the stop loss, and don't get stuck with trade.
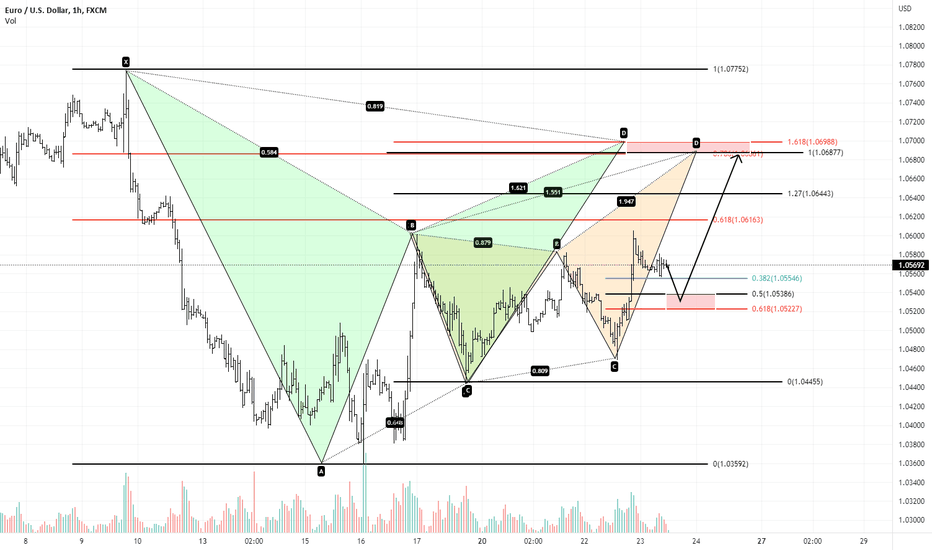
EURUSD - A move higher firstOANDA:EURUSD is edging higher towards the upside target around 1.07000.
A move back to 1.0520-1.0540 would be a low risk opportunity to go long.
At the upside target there are a lot of pattern completions, this would bring the DXY down as well before it heads higher towards its upside target of 121.
Enjoy the day.
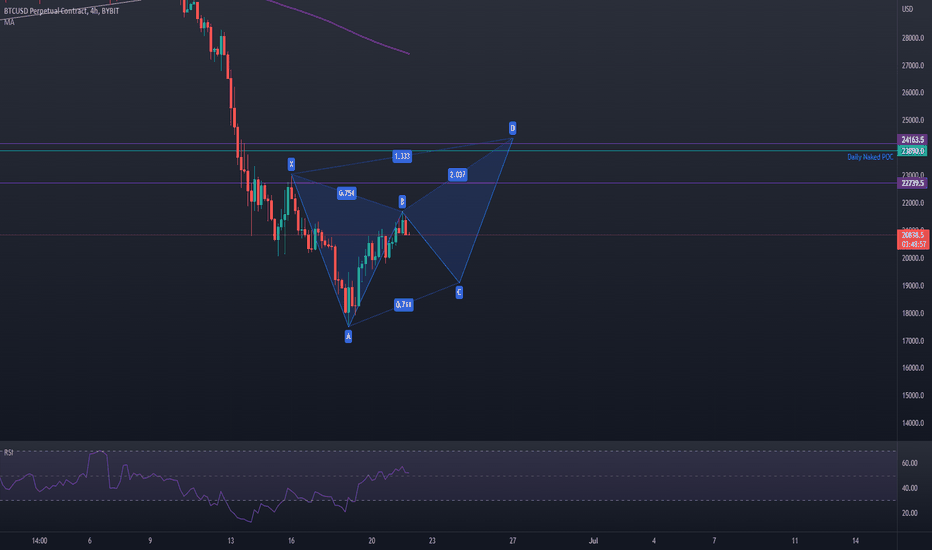
Butterfly Harmonic I found a potential Butterfly Harmonic on BTC. The D can be placed on different points but this one matches the confluences that was already on my chart. The confluence is the market structure break of the 24K level and a Daily Npoc.
In the same pattern i also found an potential ABCD which i will post. The other purple line is the local resistance.
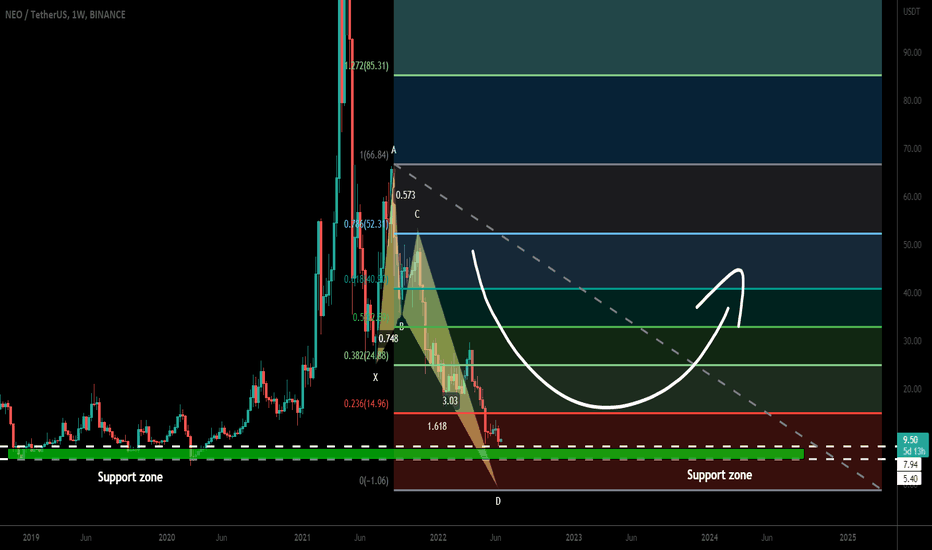
NEO coin formed bullish Butterfly for upto 869% moveHi dear friends, hope you are well and welcome to the new trade setup of NEO coin.
On a weekly time frame, NEO has formed a bullish butterfly pattern
Note: Above idea is for educational purpose only. It is advised to diversify and strictly follow the stop loss, and don't get stuck with trade.
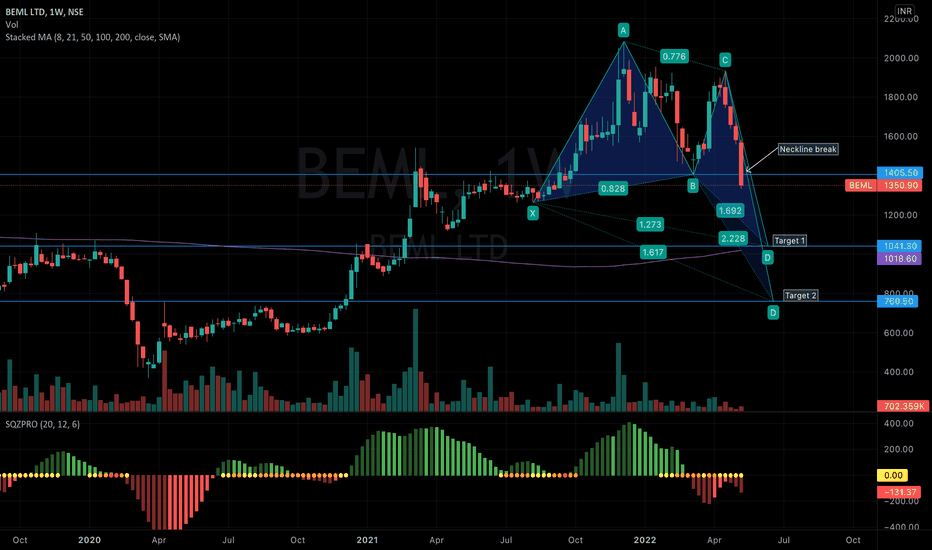
BEML - Bearish ContinuationNSE:BEML has been trading in downtrend due to market weakness and has also broken the neckline support. It has activated two possible harmonic patterns, Butterfly and Deep Carb. Targets are 1040 (target #1) and 760 (target #2) respectively. Both targets are very important levels. So price might reverse from either of them, most likely from target#1. If market weakness prevails then it might continue down to target#2.
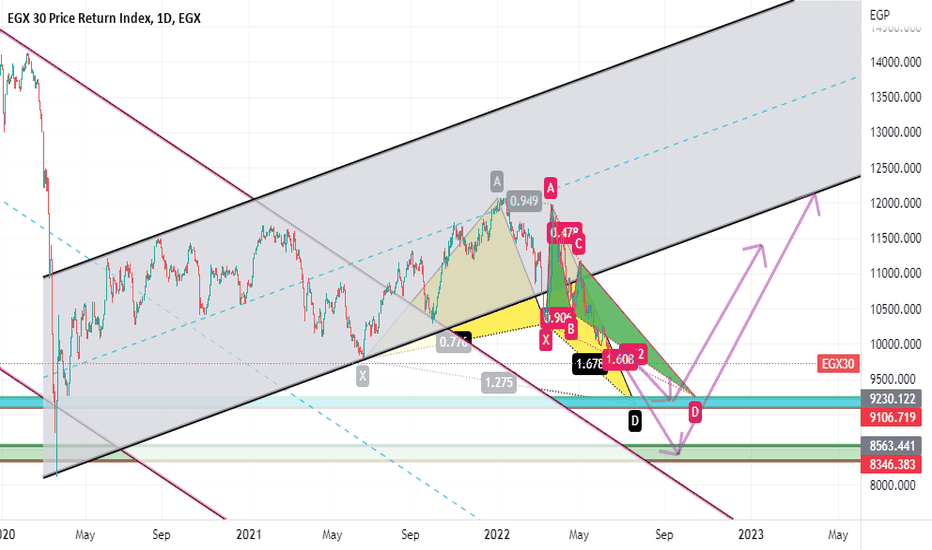
EGX 30wait price action at blue zone to buy
this zone is very strong due to share zone between
Two Harmonic Pattern
yellow Butterfly (weekly scale**
Green Crab ((daily scale**
((9240.122----9106.719**
with stop loss closing under 9050
in this case we will wait at last zone between ((8563.441---8346.383**
with stop loss closing under 8300
