XAUUSD Gold Trading Strategy August 1, 2025
Yesterday's trading session, gold prices recovered to the 3315 area and then continued to decrease to the 3281 area. Currently, gold prices are fluctuating quite unpredictably due to the impact of tariff news and investor confidence.
Basic news: The Federal Reserve FED continues to maintain the federal funds benchmark interest rate in the range of 4.25% - 4.50%, in line with policy since 2025. Chairman Powell did not give any signal about the next interest rate cut on September 16 - 17.
Technical analysis: After falling sharply to the 3269 area, gold prices are showing signs of recovery. In the current downtrend channel, there has been a higher bottom than the bottom at H1. We can see that if the bullish pattern at H1 is confirmed, combined with the reversal candlestick appearing at H4, the possibility of gold bouncing back to reach the resistance area of 3330, even 3350 is completely possible. In the weekend trading session, we will wait at the support zones to trade.
Important price zones today: 3280 - 3285 and 3269 - 3274.
Today's trading trend: BUY.
Recommended orders:
Plan 1: BUY XAUUSD zone 3283 - 3285
SL 3280
TP 3288 - 3300 - 3310 - 3330.
Plan 2: BUY XAUSD zone 3269 - 3271
SL 3266
TP 3274 - 3284 - 3300 - 3320.
Wish you a safe, favorable and profitable trading day.🥰🥰🥰🥰🥰
Buy-sell

Gold on the edge: Will 3,270 break as Fed pressure builds?Hello traders, what’s your view on XAUUSD?
Yesterday, gold remained under pressure as a series of fresh U.S. economic data reinforced expectations that the Federal Reserve will keep interest rates higher for longer. As a result, U.S. Treasury yields surged, the dollar strengthened, and gold came under renewed selling pressure. Currently, XAUUSD is trading around 3,288 USD, down 0.04% on the day.
From a technical standpoint, gold is clearly trading within a well-defined downward-sloping channel, confirming the dominance of bearish momentum. Moreover, both the EMA34 and EMA89 are acting as dynamic resistance levels, repeatedly rejecting any short-term recovery attempts—highlighting the strength of the current downtrend.
If a pullback occurs before the next leg lower, the confluence of resistance and the EMA zone will be crucial to watch. It could offer ideal conditions for potential short setups in line with the trend.
Looking ahead, the next key support lies at 3,270 USD. A break below this level could open the door for a deeper move toward the 32XX area.
What do you think? Will gold continue to drop further?
Good luck and trade safe!
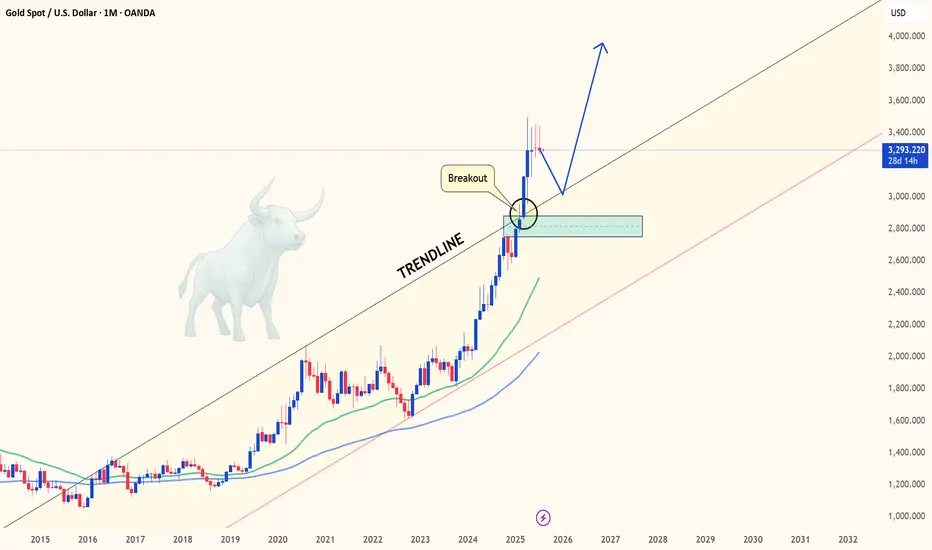
GOLD - Monthly breakout retest may confirm multi-year bull cycleHello everyone, what are your thoughts on the long-term outlook for XAUUSD?
Looking at the monthly chart (1M), we can clearly see that XAUUSD has broken out of the long-standing ascending channel that has held since 2015 — a major signal suggesting the start of a new bullish cycle. Price is now retesting the previously broken trendline, hinting at the possibility of a fresh upward leg to resume the longer-term bullish trend we've seen recently.
Personally, I'm targeting $3,600 in the medium term, and potentially $4,000 by 2026–2028 if institutional capital continues to rotate back into safe-haven assets like gold.
What about you — do you think BTC/USD will rise or fall in the coming years?
And what’s your target for it?
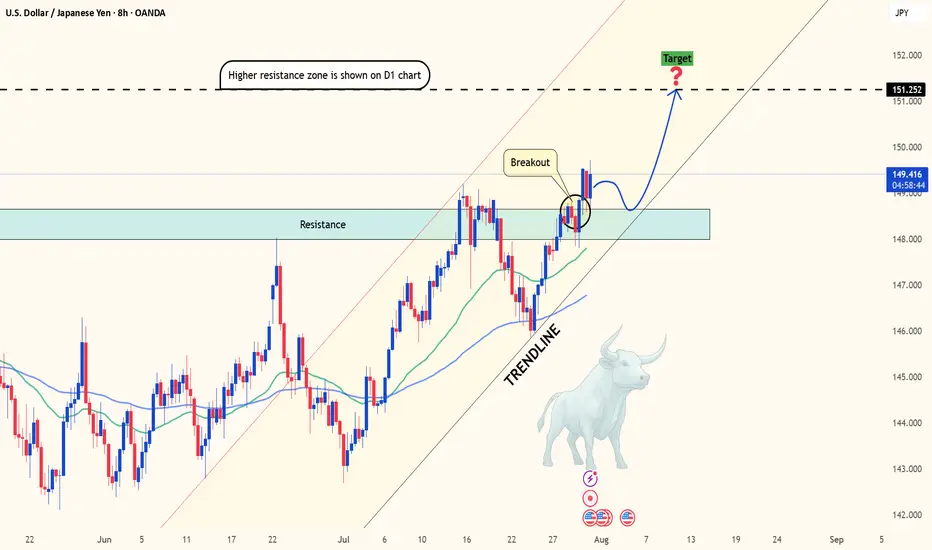
USDJPY breaks out as US data crushes forecastsHello traders! Do you think USDJPY will continue its upward momentum?
From a technical perspective, after several sessions of "building pressure," this pair has finally broken through a key resistance zone—opening the door to what could be the next bullish breakout.
Current price action suggests the uptrend remains firmly intact. The market continues to respect the rising trendline and finds strong support near the 34 & 89 EMA – a powerful technical combination that buyers often rely on. This isn’t just a typical breakout; it could be the start of a brand-new bullish cycle.
On the fundamental side, the U.S. dollar remains strong, supported by a string of solid economic data: employment, PCE, and consumer spending have all exceeded expectations. Meanwhile, the Japanese yen remains in “hibernation” as the Bank of Japan shows no sign of shifting away from its ultra-loose monetary policy. This divergence makes USDJPY one of the hottest pairs on the radar right now.
What’s next? If bullish momentum continues, the 151.25 level is likely the next short-term target. However, if the price encounters strong resistance at that level, a minor pullback could occur before the uptrend resumes.
So, what do you think? Is this the beginning of a major rally – or just a false breakout? Share your thoughts in the comments!
Wishing you successful and well-timed trades ahead!
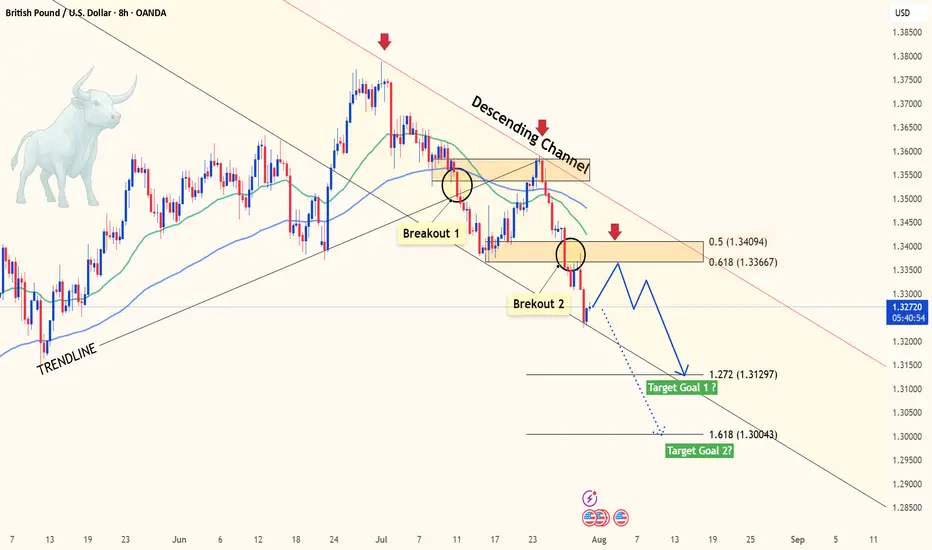
GBPUSD slipping fast – Is 1.30 the next magnet?Hey traders, what’s your take on GBPUSD today?
Overall, the pair is deepening its bearish trend after losing the key 1.3400 level. At the time of writing, GBPUSD is hovering around 1.3272 with no signs of a short-term bottom in sight.
The main catalyst for this drop is the strong bullish momentum of the U.S. dollar. A series of upbeat U.S. economic data – including jobs reports, personal consumption expenditures (PCE), and consumer confidence – all exceeded expectations, fueling USD strength. Meanwhile, the Bank of England (BoE) remains cautious amid slowing growth and cooling inflation, offering little support for the pound.
From a technical perspective, momentum has clearly shifted in favor of the bears. Price remains pressured below both the 34 and 89 EMAs, confirming strong downside momentum. The previous break below the rising trendline and failure to hold above the prior support zone – around the 0.5–0.618 Fibonacci retracement – further supports the ongoing bearish bias.
Looking ahead, if the selling pressure continues and the current support gives way, GBPUSD could fall toward the 1.272 Fibonacci extension at 1.3129. If that level fails to hold, 1.3004 (Fibo 1.618) becomes the next key downside target. These are crucial zones to monitor for potential price reactions in the coming sessions.
In short, the probability of further downside is higher than a meaningful recovery. With both technical and macro forces favoring the bears, GBPUSD may remain under pressure in the days ahead – unless a strong catalyst from the UK emerges to shift sentiment. What’s your outlook on this scenario? Let’s discuss in the comments below!
EURUSD breakdown alert – Will the drop accelerate?Hello traders, let’s take a look at how EURUSD is performing today!
Yesterday, EURUSD extended its downward slide after failing to sustain bullish momentum from the 1.1600 zone. The pair is now hovering around 1.1426.
The recent decline is largely attributed to the strength of the US dollar, which continues to benefit from a series of upbeat economic data – including robust job reports, strong consumer spending, and improving sentiment. All of these came in above expectations, pushing the dollar higher. In contrast, the European Central Bank (ECB) maintains a cautious stance, with no clear signals of policy changes – leaving the euro under persistent pressure.
From a technical standpoint, the short-term outlook suggests the beginning of a new bearish wave. Notably, price action is reacting to resistance from the nearby EMA 34 and EMA 89 levels. The break below the recent support zone has added fuel to the ongoing bearish momentum.
If the current support fails to hold, EURUSD could slip further toward the 1.272 Fibonacci extension at 1.1305, and potentially as low as 1.1178 – the 1.618 extension level.
Looking ahead, traders should focus on potential pullback opportunities, targeting SELL entries around 1.1540–1.1580 – a confluence zone of technical interest. However, if price breaks above the 1.1600 threshold and holds, this bearish scenario may be invalidated.
What’s your outlook for EURUSD in the coming days? Share your thoughts in the comments below!

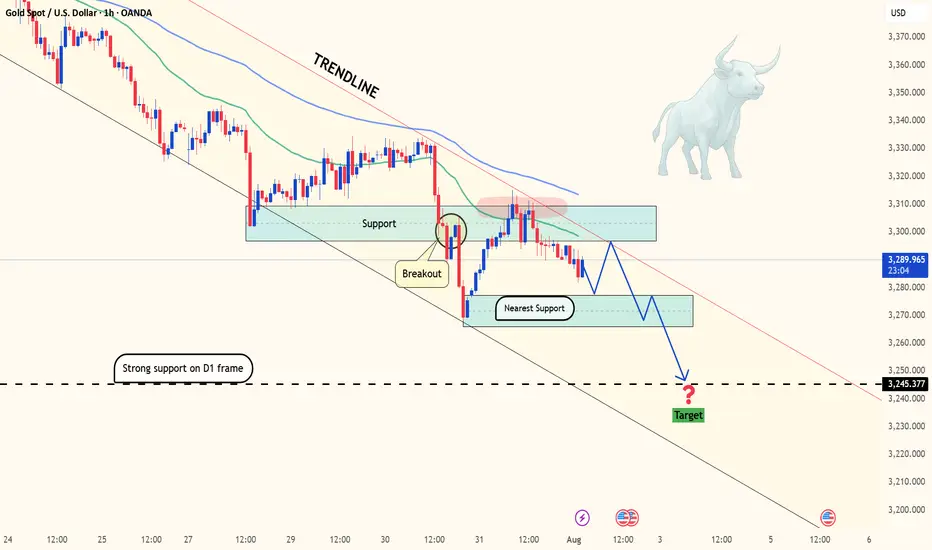
Gold is Falling Sharply – Will It Keep Falling?Hello dear traders, what’s your view on XAUUSD?
Yesterday, XAUUSD continued its strong downtrend and is now trading around 3,296 USD.
The recent drop in gold is largely due to the strengthening U.S. dollar, following the Federal Reserve’s decision to hold interest rates steady as expected — despite sharp criticism from President Donald Trump.
Technically speaking, after breaking below the rising trendline, gold failed to retest successfully and plunged further, confirming that the bearish trend is now in control. Price is currently moving below key moving averages, and the structure has clearly formed a sequence of lower highs and lower lows — reinforcing the likelihood of continued downside.
If a pullback occurs before the next leg down, the Fibonacci 0.5 and 0.618 retracement zone — which aligns with the EMA 34 and 89 and a major resistance level — will be a key area to watch. This could present a prime opportunity for breakout and trend-following traders.
Looking ahead, the next key support sits near 3,220 USD. If this level breaks, gold may head toward the 3,162 USD zone.
What do you think? Will gold keep falling, or will buyers step in? Drop a comment and hit follow to catch the next big move!

Gold’s Next Move: Bounce or Breakdown?Gold is pulling back after breaking the 3,360 USD resistance on the 6-hour chart. Price is currently testing the nearest fair value gap (3,370–3,380), but upside momentum is stalling, partly due to unfilled supply zones above.
A retest of the lower FVG near 3,340 will be key. Holding above this level could trigger renewed buying, while a break below may invalidate the bullish structure.
Traders should closely monitor whether downside gaps continue to fill and how price behaves near support zones. Lack of strong liquidity could lead to a false breakout.

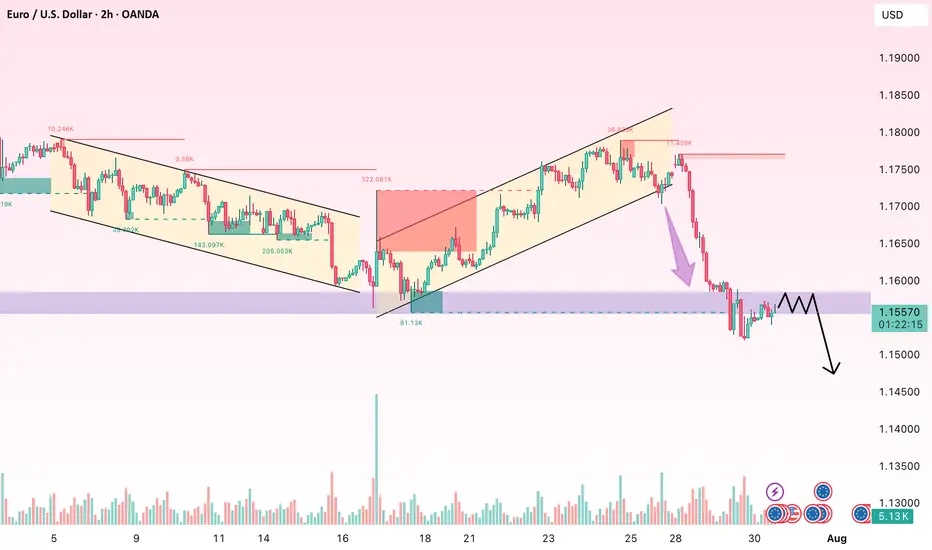
EUR/USD: A Fragile Rebound Within a Broader Bearish TrapEUR/USD has managed to stage a slight recovery after plunging through the key 1.1680 support — a level that had held firm for two weeks. The pair is now hovering just above 1.1500, but the bounce appears shallow and unconvincing. Volume remains low, momentum indicators offer little confirmation, and the broader structure still points to a prevailing downtrend.
On the H2 chart, price has rebounded from the 1.1505 area — a minor support formed during July's short-term consolidation. Yet, the EMA slope remains strongly negative, and RSI is struggling below the neutral 50 mark after exiting oversold territory. The structure continues to display classic lower highs and lower lows, with the 1.1585–1.1600 zone emerging as a potential resistance area for bears to re-enter.
From a macro perspective, the U.S. dollar remains supported by expectations that the Fed will maintain a hawkish stance, fueled by solid GDP, durable goods, and PCE data. In contrast, the Eurozone struggles with signs of stagnation, with both services and manufacturing PMIs deteriorating — most notably in Germany. This policy divergence continues to favor the greenback.
Unless bulls manage to decisively reclaim the 1.1600 zone with strong follow-through buying, any rebound risks being nothing more than a dead cat bounce. The downside target remains near 1.1460 – 1.1440 in the near term.
Gold Price Outlook: A Deeper Correction Ahead?Hello everyone! What are your thoughts on the current gold market?
Gold's decline is picking up speed, with the price now testing the 3,320 USD level. A stronger U.S. dollar, coupled with recent developments in the U.S.-EU trade agreement, has significantly reduced demand for gold as a safe-haven asset.
From a technical perspective, the break below the rising price channel is a key signal. It could mark the beginning of a deeper correction, as oscillators are starting to show negative momentum, indicating that the path of least resistance is now downward.
Looking ahead, all eyes will be on Wednesday’s FOMC decision. The market will be watching closely for any signs of a rate cut roadmap from the Federal Reserve, especially during Powell’s press conference. Additionally, several important U.S. macroeconomic data releases this week could provide new momentum for the USD and play a crucial role in shaping gold's next move.
What are your thoughts on where gold is heading? Let us know in the comments below!

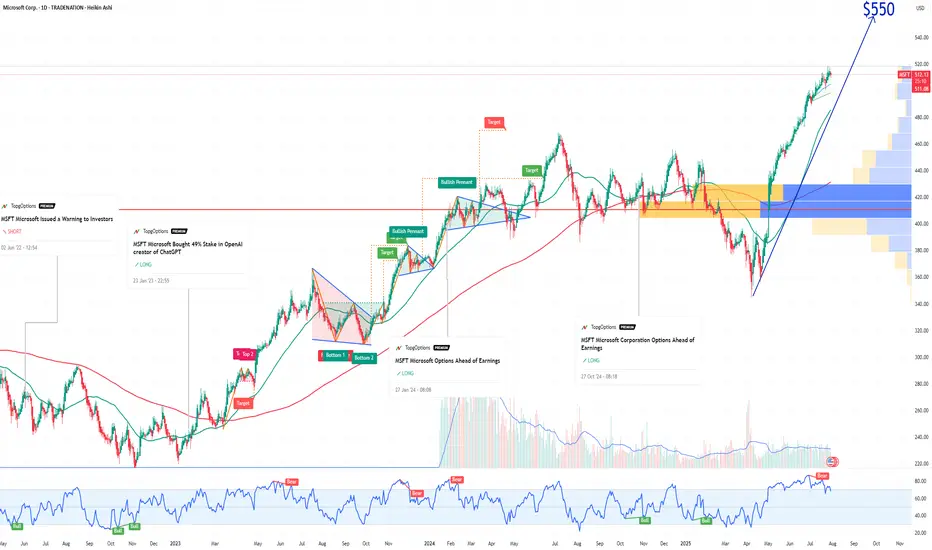
MSFT Microsoft Corporation Options Ahead of EarningsIf you haven`t bought MSFT when they announced the 49% stake in OpenAI:
Now analyzing the options chain and the chart patterns of MSFT Microsoft Corporation prior to the earnings report this week,
I would consider purchasing the 550usd strike price Calls with
an expiration date of 2025-12-19,
for a premium of approximately $14.75.
If these options prove to be profitable prior to the earnings release, I would sell at least half of them.
Disclosure: I am part of Trade Nation's Influencer program and receive a monthly fee for using their TradingView charts in my analysis.
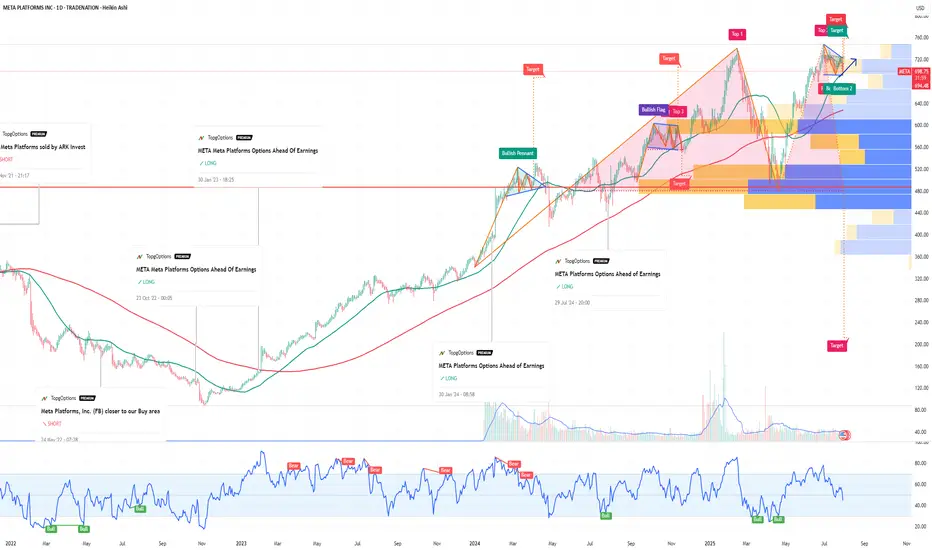
META Meta Platforms Options Ahead Of EarningsIf you haven`t bought META before the rally:
Now analyzing the options chain and the chart patterns of META Platforms prior to the earnings report this week,
I would consider purchasing the 710usd strike price in the money Calls with
an expiration date of 2026-6-18,
for a premium of approximately $89.30.
If these options prove to be profitable prior to the earnings release, I would sell at least half of them.
Disclosure: I am part of Trade Nation's Influencer program and receive a monthly fee for using their TradingView charts in my analysis.
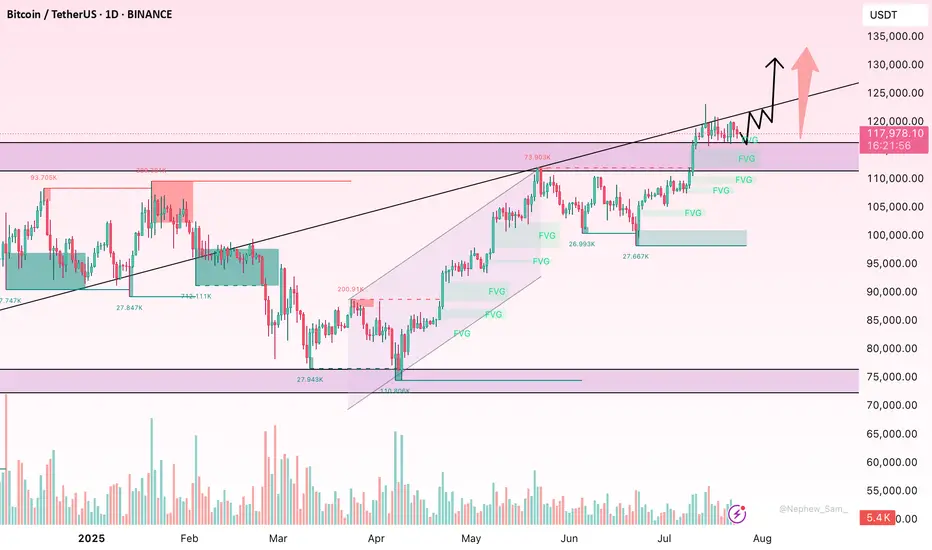
BTC Consolidates Below Key Resistance – Is a Breakout Imminent?Bitcoin is currently consolidating beneath the major psychological resistance near $120,000. The medium-term trend remains bullish, supported by a series of higher highs and higher lows. However, recent candlesticks with long upper wicks reflect hesitation among buyers at elevated levels, pointing to potential exhaustion in short-term momentum.
Despite this, there are no clear signs of bearish divergence or strong reversal patterns. The sideways range between $112,000–$120,000 likely represents a healthy consolidation phase after a strong rally. If the price maintains support around $113,000 and breaks above $120,000 with convincing volume, the next leg higher could follow swiftly.
For now, buyers remain in control, provided BTC holds key structural supports. A breakout confirmation is crucial for bullish continuation.
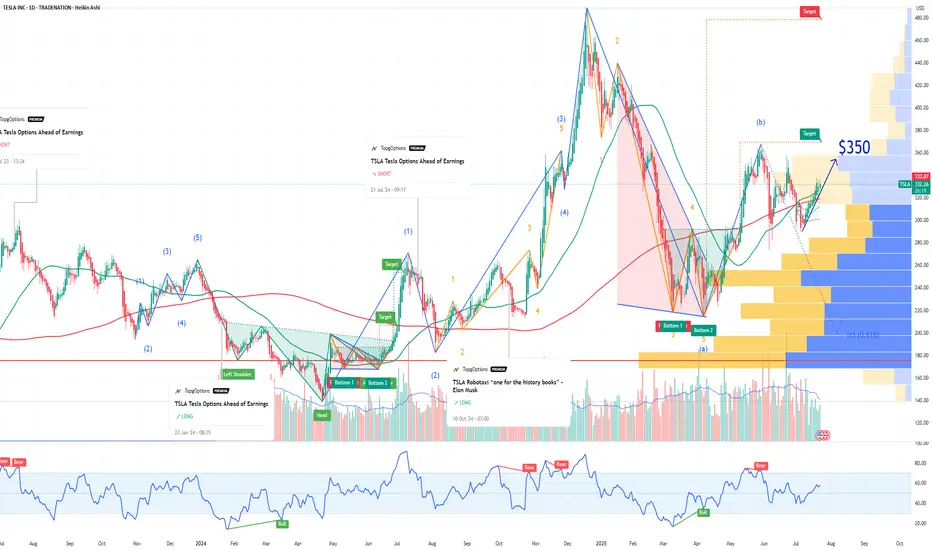
TSLA Tesla Options Ahead of EarningsIf you haven`t bought TSLA before the recent rally:
Now analyzing the options chain and the chart patterns of TSLA Tesla prior to the earnings report this week,
I would consider purchasing the 350usd strike price Calls with
an expiration date of 2025-8-15,
for a premium of approximately $14.90.
If these options prove to be profitable prior to the earnings release, I would sell at least half of them.
Disclosure: I am part of Trade Nation's Influencer program and receive a monthly fee for using their TradingView charts in my analysis.
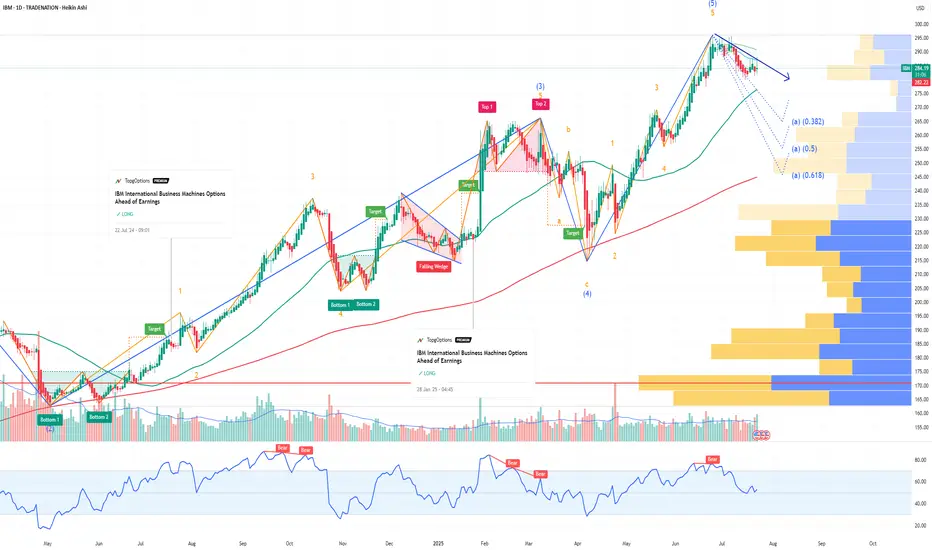
IBM International Business Machines Options Ahead of EarningsIf you haven`t bought IBM before the rally:
Now analyzing the options chain and the chart patterns of IBM International Business Machines prior to the earnings report this week,
I would consider purchasing the 290usd strike price Puts with
an expiration date of 2025-9-19,
for a premium of approximately $17.30.
If these options prove to be profitable prior to the earnings release, I would sell at least half of them.
Disclosure: I am part of Trade Nation's Influencer program and receive a monthly fee for using their TradingView charts in my analysis.
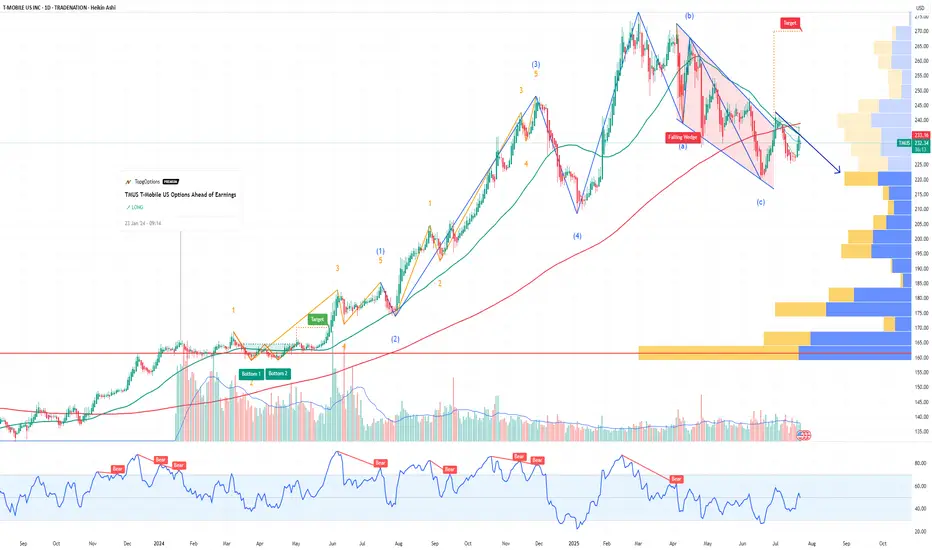
TMUS T-Mobile US Options Ahead of EarningsIf you haven`t bought TMUS before the rally:
Now analyzing the options chain and the chart patterns of TMUS T-Mobile US prior to the earnings report this week,
I would consider purchasing the 227.5usd strike price Puts with
an expiration date of 2025-7-25,
for a premium of approximately $3.50.
If these options prove to be profitable prior to the earnings release, I would sell at least half of them.
Disclosure: I am part of Trade Nation's Influencer program and receive a monthly fee for using their TradingView charts in my analysis.
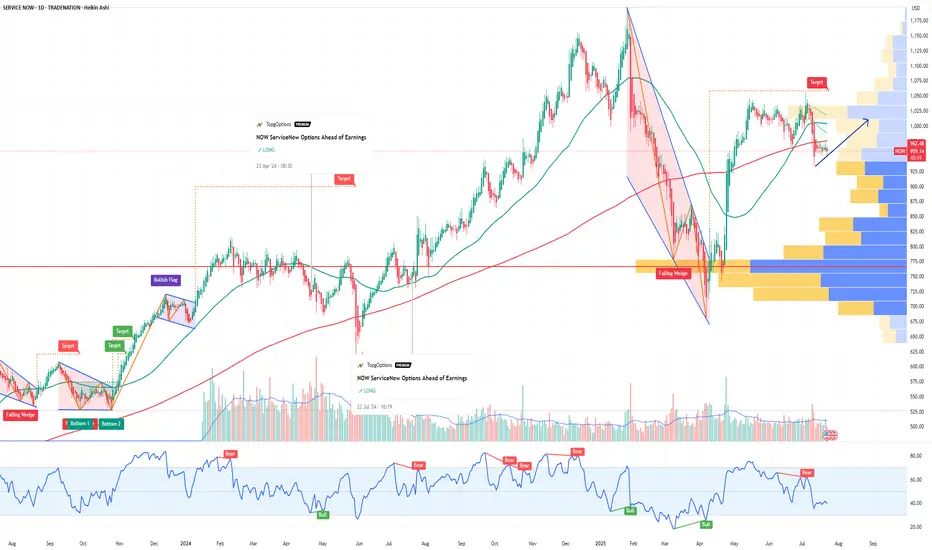
NOW ServiceNow Options Ahead of EarningsIf you haven`t bought NOW before the recent rally:
Analyzing the options chain and the chart patterns of NOW ServiceNow prior to the earnings report this week,
I would consider purchasing the 960usd strike price Calls with
an expiration date of 2025-12-19,
for a premium of approximately $97.60.
If these options prove to be profitable prior to the earnings release, I would sell at least half of them.
Disclosure: I am part of Trade Nation's Influencer program and receive a monthly fee for using their TradingView charts in my analysis.
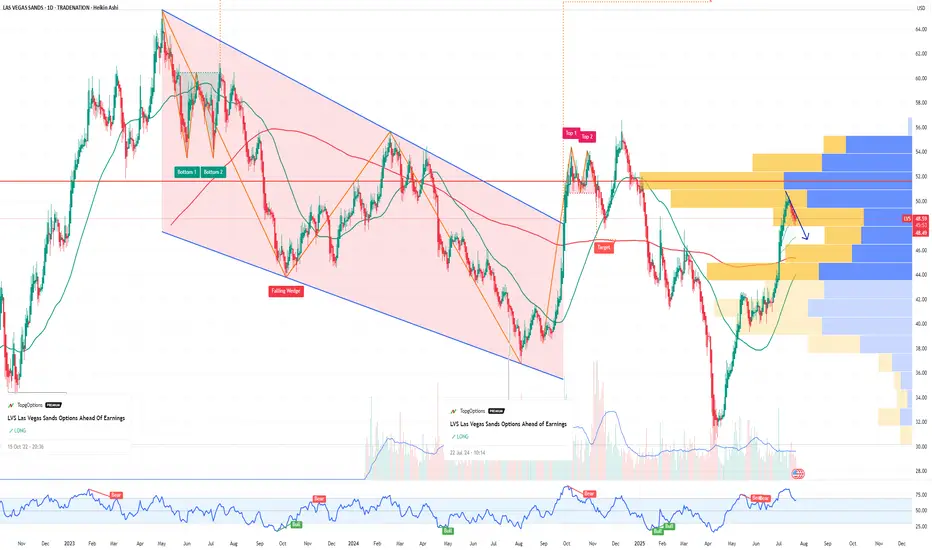
LVS Las Vegas Sands Options Ahead of EarningsIf you haven`t bought LVS before the rally:
Now analyzing the options chain and the chart patterns of LVS Las Vegas Sands prior to the earnings report this week,
I would consider purchasing the 48.5usd strike price Puts with
an expiration date of 2025-7-25,
for a premium of approximately $1.22.
If these options prove to be profitable prior to the earnings release, I would sell at least half of them.
Disclosure: I am part of Trade Nation's Influencer program and receive a monthly fee for using their TradingView charts in my analysis.
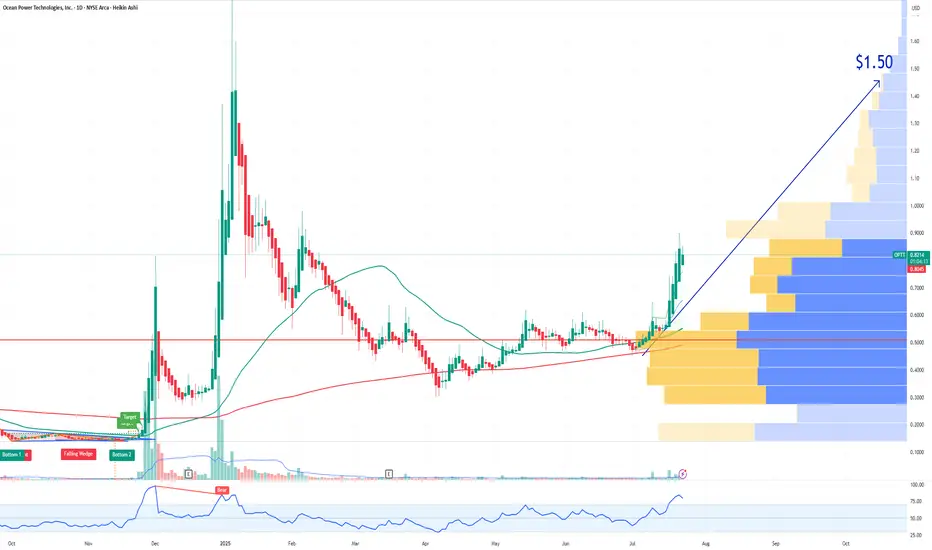
OPTT Ocean Power Technologies Options Ahead of EarningsAnalyzing the options chain and the chart patterns of OPTT Ocean Power Technologies prior to the earnings report this week,
I would consider purchasing the 1.50usd strike price Calls with
an expiration date of 2025-11-21,
for a premium of approximately $0.25.
If these options prove to be profitable prior to the earnings release, I would sell at least half of them.
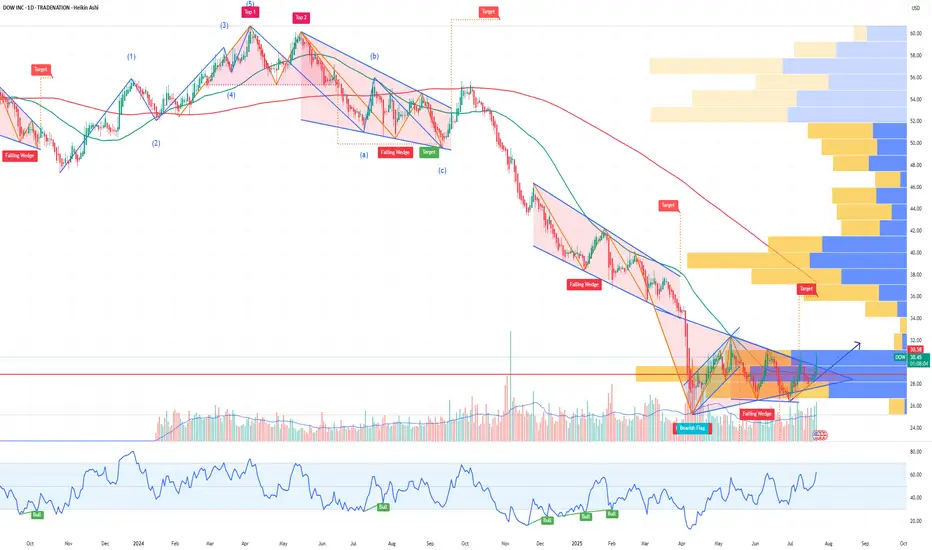
DOW Options Ahead of EarningsAnalyzing the options chain and the chart patterns of DOW prior to the earnings report this week,
I would consider purchasing the 30usd strike price Calls with
an expiration date of 2025-9-19,
for a premium of approximately $2.36.
If these options prove to be profitable prior to the earnings release, I would sell at least half of them.
Disclosure: I am part of Trade Nation's Influencer program and receive a monthly fee for using their TradingView charts in my analysis.
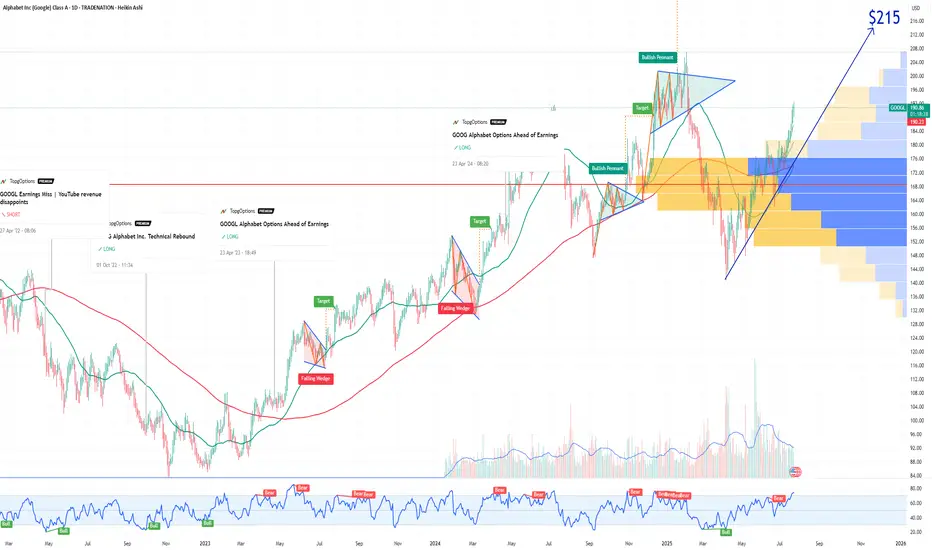
GOOGL Alphabet Options Ahead of EarningsIf you haven`t bought GOOGL before the rally:
Now analyzing the options chain and the chart patterns of GOOGL Alphabet prior to the earnings report this week,
I would consider purchasing the 215usd strike price Calls with
an expiration date of 2026-1-16,
for a premium of approximately $8.20.
If these options prove to be profitable prior to the earnings release, I would sell at least half of them.
Disclosure: I am part of Trade Nation's Influencer program and receive a monthly fee for using their TradingView charts in my analysis.
XAUUSD 24-Hour Technical Analysis Forecast - UTC+4 Current Price: $3,350.095 (Close: Friday, July 18th, 2025) UTC+4
Analysis Period : Next 24 Hours (July 21-22, 2025) UTC+4
Market Status: Weekend - Preparing for Monday Open 02:00AM 21st July 2025
EXECUTIVE SUMMARY - 24H OUTLOOK
Primary Bias: Neutral to Bearish (Short-term)
Key Resistance: $3,375 - $3,390
Critical Support: $3,285 - $3,300
Expected Range: $3,300 - $3,380
Volatility Level: Moderate to High
CANDLESTICK PATTERN ANALYSIS
Friday's Close Formation
Pattern: Doji-like formation at resistance zone
Significance: Indecision after testing $3,350+ levels
Volume: Moderate - no strong conviction breakout
Context: Failed to close decisively above $3,375 resistance
Expected 24H Patterns
Monday Gap: Potential gap down to $3,320-3,330 area
Reversal Patterns: Watch for hammer/doji at support levels
Continuation Signals: Break below $3,300 could trigger bearish continuation
HARMONIC PATTERN ANALYSIS
Current Harmonic Setup
Primary Pattern: Potential Bearish Bat completing
X: $3,285 (previous low)
A: $3,390 (recent high)
B: $3,320 (61.8% retracement)
C: $3,375 (78.6% projection - current area)
D (Target): $3,300-3,285 (88.6% completion zone)
Fibonacci Levels (24H Focus)
Golden Ratio Resistance: $3,375 (current test area)
61.8% Support: $3,320
78.6% Support: $3,300
88.6% Critical Support: $3,285
Pattern Completion Probabilities
Bearish Bat Completion: 70% probability targeting $3,285-3,300
Bullish Cypher Setup: 30% if break above $3,390
ELLIOTT WAVE THEORY - 24H COUNT
Primary Wave Count
Macro Structure: Wave 5 of larger impulse possibly topping
Current Sub-wave: Wave (c) of corrective structure
Mini Count: 5-wave decline from $3,390 high in progress
24-Hour Wave Projection
Wave 1: $3,390 → $3,320 (Completed)
Wave 2: $3,320 → $3,360 (Completed - 50% retrace)
Wave 3: $3,360 → $3,285 (In Progress - Target Area)
Wave 4: $3,285 → $3,310 (Projected)
Wave 5: $3,310 → $3,260 (Extended target)
Critical Levels
Wave 3 = 1.618 × Wave 1: $3,285 (Primary target)
Invalidation: Above $3,390 (Wave 2 high)
WYCKOFF THEORY - 24H PHASE
Current Market Phase
Phase Assessment: Distribution Phase C (Testing Supply)
Composite Operator Action: Testing demand at $3,350 area
Volume Analysis: Declining volume on recent rallies (bearish)
Expected 24H Wyckoff Action
Phase Transition: Moving toward Phase D (Markdown begins)
Supply Test: Failed test at $3,375 confirms distribution
Target: Initial markdown to $3,285-3,300 area
Key Wyckoff Signals (24H)
No Demand: Expected at current levels
Selling Climax: Possible if break below $3,285 with high volume
Automatic Rally: Dead cat bounce to $3,320-3,330
W.D. GANN THEORY - 24H ANALYSIS
Square of Nine Analysis
Current Position: 3350° on Gann wheel
Next Cardinal Point: 3375° (90° angle - strong resistance)
Support Angles: 3300° (natural support), 3285° (critical angle)
Geometric Progression: $3,285 = perfect square root relationship
Time Theory - 24H Cycle
Natural Time Window: 24-hour cycle from Friday's high
Critical Time: 14:00-16:00 UTC Monday (historical turning point)
Lunar Influence: New moon phase approaching (bearish for commodities)
Angle Theory
45° Line: Currently at $3,320 (rising support)
63.75° Line: $3,285 (steep support angle)
26.25° Line: $3,375 (resistance angle)
Price Forecasting (Gann Methods)
Primary Target: $3,285 (Square root of 81²)
Secondary Target: $3,240 (Square root of 80²)
Resistance: $3,375 (Square root of 82.5²)
Time Forecasting
Turn Time 1: 06:00 UTC Monday (18 hours from Friday close)
Turn Time 2: 14:00 UTC Monday (26 hours from Friday close)
Major Turn: 22:00 UTC Monday (34 hours - Fibonacci time)
MULTI-TIMEFRAME INTRADAY ANALYSIS
5-Minute Chart Analysis
Trend: Bearish momentum building
Pattern: Lower highs, lower lows since Friday high
Key Levels:
Resistance: $3,360-3,365
Support: $3,330-3,335
RSI: Approaching oversold (35-40 range)
Volume: Increasing on down moves
15-Minute Chart Analysis
Structure: Bearish flag formation
Breakdown Level: Below $3,340
Target: $3,300-3,310 (flag pole projection)
Moving Averages: Price below EMA 20 ($3,358)
MACD: Bearish crossover confirmed
30-Minute Chart Analysis
Primary Trend: Corrective phase active
Chart Pattern: Descending triangle
Apex: Around $3,335-3,340
Breakout Direction: 65% probability downward
Volume Profile: Heavy selling at $3,350-3,375
1-Hour Chart Analysis
Major Structure: ABC correction in progress
Current Position: C-wave development
Fibonacci Target: $3,285 (127.2% extension)
Bollinger Bands: Price touching lower band
Stochastic: Oversold but no divergence yet
4-Hour Chart Analysis
Macro Trend: Still bullish above $3,200
Correction Depth: 23.6% retracement maximum expected
Support Zone: $3,280-3,300 (confluences)
Resistance Zone: $3,375-3,390 (proven strong)
Ichimoku: Price approaching cloud support
TECHNICAL INDICATORS MATRIX
Momentum Indicators
RSI (4H): 42 (Neutral-Bearish)
RSI (1H): 35 (Oversold approaching)
Stochastic: %K: 28, %D: 35 (Oversold)
Williams %R: -75 (Strong oversold)
Trend Indicators
MACD (4H): Bearish crossover pending
ADX: 28 (Moderate trend strength)
Parabolic SAR: $3,365 (Sell signal if broken)
Volume Indicators
OBV: Declining (distribution pattern)
Volume Rate of Change: Negative
Accumulation/Distribution: Slight distribution
KEY SUPPORT & RESISTANCE LEVELS (24H)
Immediate Resistance Levels
R1: $3,365 (Previous support turned resistance)
R2: $3,375 (Major psychological & Gann resistance)
R3: $3,390 (Recent swing high)
R4: $3,410 (Extended resistance)
Critical Support Levels
S1: $3,330 (Immediate support)
S2: $3,300 (Psychological & Fibonacci)
S3: $3,285 (Major harmonic & Gann target)
S4: $3,260 (Extended support)
24-HOUR TRADING SCENARIOS
Scenario 1: Bearish Breakdown (60% Probability)
Trigger: Break below $3,330 with volume
Target 1: $3,300-3,310
Target 2: $3,285-3,290
Extended Target: $3,260-3,270
Stop Loss (Shorts): Above $3,370
Scenario 2: Range-Bound Consolidation (25% Probability)
Range: $3,320-3,375
Strategy: Fade extremes
Buy Zone: $3,320-3,330
Sell Zone: $3,365-3,375
Breakout Confirmation: Volume spike
Scenario 3: Bullish Reversal (15% Probability)
Trigger: Break above $3,375 with volume
Target 1: $3,390-3,400
Target 2: $3,410-3,420
Invalidation: Below $3,285
RISK FACTORS & CATALYSTS (24H)
Bearish Catalysts
US Dollar strength continuation
Risk-off sentiment from geopolitical tensions
Profit-taking ahead of weekend
Technical breakdown confirmation
Bullish Catalysts
Safe-haven demand surge
US Dollar weakness
Central bank buying speculation
Technical oversold bounce
High-Impact Events (Next 24H)
Asian market opening sentiment
US Dollar Index movement
Cryptocurrency correlation effects
Weekend gap analysis
TRADING RECOMMENDATIONS (24H)
For Scalpers (5M-15M)
Strategy: Fade bounces to resistance
Entry: $3,355-3,365 area
Target: $3,335-3,340
Stop: $3,375
Risk/Reward: 1:2
For Swing Traders (1H-4H)
Primary Setup: Short on retracement
Entry Zone: $3,350-3,360
Target 1: $3,300
Target 2: $3,285
Stop Loss: $3,385
Conservative Approach
Wait for: Clear breakdown below $3,330
Entry: $3,325 (confirmation)
Target: $3,285-3,290
Stop: $3,345
CONFLUENCE FACTORS
Bearish Confluence at $3,285
Harmonic Bat pattern completion (88.6% level)
Gann Square of Nine critical angle
Elliott Wave 3 = 1.618 × Wave 1 target
Fibonacci 78.6% retracement level
Previous significant support area
Wyckoff markdown initial target
Resistance Confluence at $3,375
Gann 90-degree angle resistance
Harmonic pattern resistance
Elliott Wave corrective high
Previous breakout level
Psychological round number
FINAL 24H FORECAST SUMMARY
Expected Price Action: Controlled decline toward $3,285-3,300 support zone with potential for brief consolidation before further weakness.
Primary Targets (Downside):
First: $3,300-3,310
Second: $3,285-3,290
Extended: $3,260-3,270
Key Invalidation: Sustained break above $3,375 would shift bias bullish toward $3,390-3,410.
Risk Management: Position sizing should be conservative due to high volatility expectations and weekend gap risks.
Probability Assessment:
60% - Bearish scenario
25% - Sideways consolidation
15% - Bullish reversal
Disclaimer: This analysis is for educational purposes only. Gold trading involves substantial risk. Always use proper risk management and never risk more than you can afford to lose.
Volume profile resistance

Adani Power (NSE:ADANIPOWER) Technical Analysis July 18th, 2025Current Price : ₹594.65 (as of July 18th, 2025, 02:00PM UTC+4)
Target Price: ₹633.67 (+6.56% upside potential)
Executive Summary
Adani Power is currently showing mixed signals across different timeframes. The stock has broken through key resistance levels but is facing overhead resistance. Multiple technical theories suggest a consolidation phase with potential for upward movement.
1. CANDLESTICK PATTERN ANALYSIS
Intraday Patterns (5M-1H)
Current Formation: Doji/Spinning top patterns indicating indecision
Key Pattern: Inside bar formations suggest consolidation
Volume Profile: Moderate volume with no significant breakout confirmation
Swing Patterns (4H-Weekly)
Primary Pattern: Rectangle/Channel formation identified
Support Zone: ₹513-520 (Strong support)
Resistance Zone: ₹588-600 (Current testing area)
2. HARMONIC PATTERN ANALYSIS
Potential Patterns
ABCD Pattern: Incomplete - monitoring for completion around ₹630-650 zone
Gartley Pattern: Potential bearish setup if rejection occurs at current levels
Fibonacci Levels:
Support: ₹450 (S1), ₹300 (S2), ₹200 (S3)
Resistance: ₹700 (R1), ₹850 (R2), ₹1,000 (R3)
3. ELLIOTT WAVE THEORY
Wave Count Analysis
Primary Wave: Currently in Wave 3 of a larger impulse structure
Sub-wave: Wave 4 correction potentially completing around ₹580-590
Target: Wave 5 projection towards ₹700-750 zone
Invalidation Level: Below ₹513 would negate current count
Time Cycles
Short-term: 5-8 day correction cycle
Medium-term: 21-34 day impulse cycle active
4. WYCKOFF THEORY ANALYSIS
Current Phase Assessment
Phase: Potential Mark-up Phase (Phase D-E transition)
Volume Analysis: Accumulation patterns visible on weekly charts
Smart Money: Institutional interest evident from volume profiles
Composite Operator: Testing supply around ₹600 levels
Key Levels
Spring Test: ₹513 level held as key support
Supply Line: ₹588-600 acting as resistance
Upthrust Potential: Break above ₹605 could trigger mark-up
5. W.D. GANN THEORY ANALYSIS
Square of Nine Analysis
Current Position: 594° on the wheel
Next Resistance: 625° (₹625) - significant Gann angle
Support Level: 576° (₹576) - 45-degree angle support
Cardinal Points: 600° represents a critical decision point
Time Theory
Natural Time Cycles: 90-day cycle completion expected by August 2025
Anniversary Dates: Historical significant dates align with current timeframe
Time Windows: July 25-30, 2025 represents important time cluster
Angle Theory
1x1 Angle: Currently trading above the 1x1 rising angle from ₹513 low
2x1 Angle: Resistance at ₹630 level (steep angle)
Price/Time Squares: Next square at ₹625 (25²)
Forecasting
Price Target: ₹625-650 based on geometric progressions
Time Target: 15-20 trading days for next significant move
Harmony Level: ₹594 is in harmony with previous swing levels
6. ICHIMOKU KINKO HYO ANALYSIS
Cloud (Kumo) Analysis
Current Position: Price trading above the cloud (bullish)
Cloud Thickness: Thin cloud ahead suggests easier breakout potential
Cloud Color: Green cloud in coming periods (bullish bias)
Line Analysis
Tenkan-sen (9): ₹587 - price above (bullish)
Kijun-sen (26): ₹571 - price above (strong bullish)
Chikou Span: Clear of price action (no interference)
Senkou Span A: ₹579 (support)
Senkou Span B: ₹562 (key support)
7. TECHNICAL INDICATORS
RSI Analysis
Current RSI: 58-62 range (neutral to slightly bullish)
Divergence: No major divergences detected
Overbought/Oversold: Not in extreme zones
Bollinger Bands
Position: Price in upper half of bands
Squeeze: Bands expanding, indicating increased volatility
Signal: Potential for continued upward movement
VWAP Analysis
Daily VWAP: ₹591 (price above - bullish)
Weekly VWAP: ₹584 (strong support)
Volume Profile: Heavy volume around ₹570-580 zone
Moving Averages
SMA 20: ₹583 (bullish crossover)
EMA 20: ₹586 (price above)
SMA 50: ₹567 (strong support)
EMA 50: ₹569 (upward sloping)
SMA 200: ₹524 (long-term bull market)
8. MULTI-TIMEFRAME ANALYSIS
Intraday Timeframes
5-Minute Chart
Trend: Sideways with bullish bias
Key Level: ₹592-596 range bound
Signal: Wait for breakout above ₹600
15-Minute Chart
Trend: Consolidating triangle pattern
Volume: Decreasing (typical in consolidation)
Target: ₹605-610 on upside breakout
30-Minute Chart
Trend: Higher highs and higher lows intact
Support: ₹590-592
Resistance: ₹598-602
1-Hour Chart
Trend: Bullish flag pattern forming
Breakout Level: Above ₹602
Target: ₹625-630
4-Hour Chart
Trend: Strong uptrend since ₹513 low
Pattern: Bull flag consolidation
Key Level: ₹588 as crucial support
Swing Timeframes
Daily Chart
Trend: Primary uptrend intact
Pattern: Rectangle between ₹513-588 broken upside
Target: Next resistance at ₹700 zone
Weekly Chart
Trend: Long-term bullish structure
Support: ₹450-500 major support zone
Resistance: ₹700-750 target area
Monthly Chart
Trend: Recovery from major lows
Long-term View: Potential for ₹850+ targets
Time Horizon: 6-12 months for major targets
9. FORECAST & OUTLOOK
Intraday Forecast (Next 1-5 Days)
Bias: Neutral to Bullish
Range: ₹585-610
Breakout Level: Above ₹605 for ₹625 target
Stop Loss: Below ₹582
Swing Forecast (Next 2-8 Weeks)
Primary Target: ₹633-650
Secondary Target: ₹700-720
Support Zone: ₹570-580
Risk Level: Medium (volatility expected)
Key Risk Factors
Overall market sentiment and Adani group developments
Earnings disappointment (recent -23.91% surprise noted)
Broader power sector dynamics
Regulatory changes in power sector
Trading Strategy Recommendations
For Intraday Traders
Buy: Above ₹602 with ₹610-615 target
Sell: Below ₹590 with ₹582-585 target
Risk Management: 1-2% position sizing
For Swing Traders
Accumulate: ₹580-590 zone
Target: ₹633-650 (first target)
Stop Loss: Below ₹570 (daily close basis)
Time Horizon: 4-8 weeks
Confluence Factors Supporting Bullish View
Multiple theories align for ₹625-650 targets
Strong volume accumulation patterns
Technical breakout from rectangle formation
Ichimoku cloud support
Gann squares and angles alignment
Warning Signals to Watch
Daily close below ₹580
RSI divergence formation
Volume decrease on any upward moves
Broader market weakness
Disclaimer: This analysis is for educational purposes only. Always consult with financial advisors and conduct your own research before making investment decisions. Past performance does not guarantee future results.
