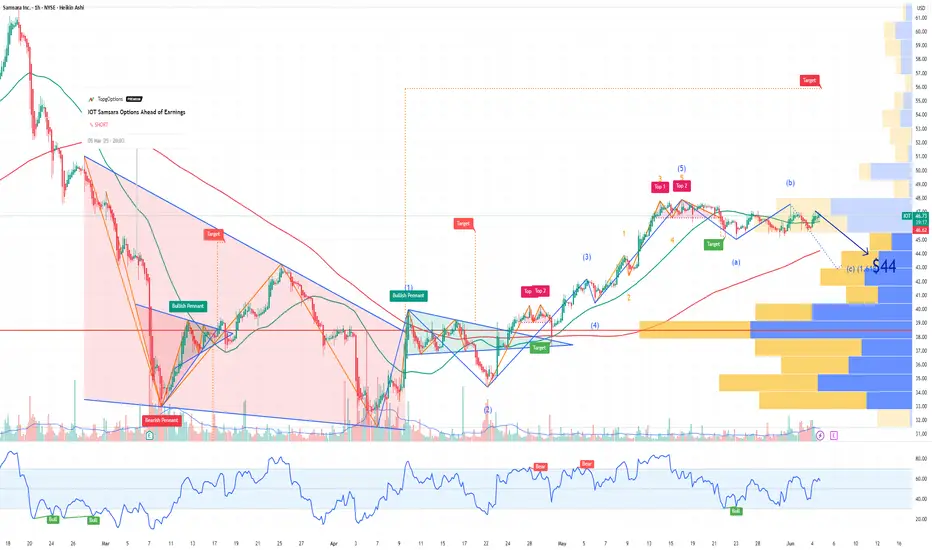
IOT Samsara Options Ahead of EarningsIf you haven`t sold IOT before the previous earnings:
Now analyzing the options chain and the chart patterns of IOT Samsara prior to the earnings report this week,
I would consider purchasing the 44usd strike price Puts with
an expiration date of 2025-6-6,
for a premium of approximately $1.90.
If these options prove to be profitable prior to the earnings release, I would sell at least half of them.
Buy
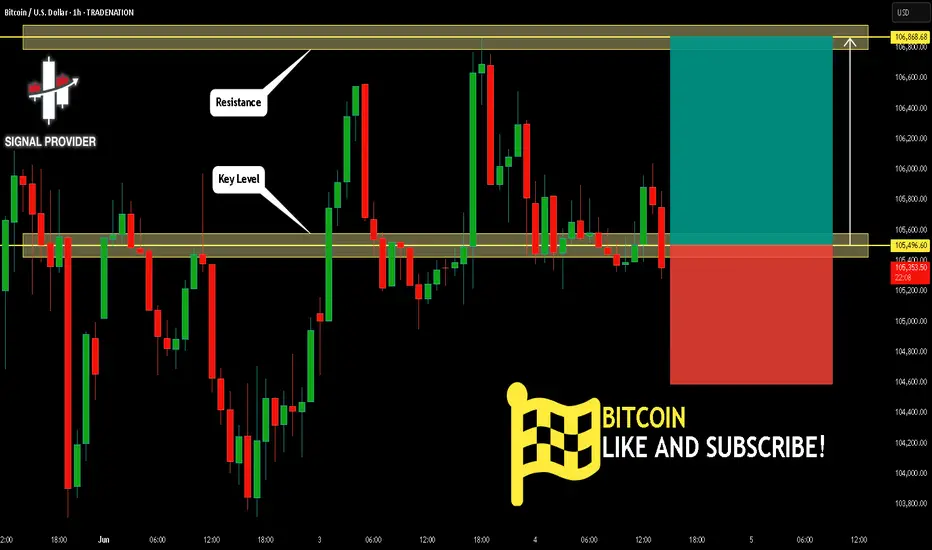
BITCOIN Will Move Higher! Long!
Please, check our technical outlook for BITCOIN.
Time Frame: 1h
Current Trend: Bullish
Sentiment: Oversold (based on 7-period RSI)
Forecast: Bullish
The price is testing a key support 105,496.60.
Current market trend & oversold RSI makes me think that buyers will push the price. I will anticipate a bullish movement at least to 106,868.68 level.
P.S
The term oversold refers to a condition where an asset has traded lower in price and has the potential for a price bounce.
Overbought refers to market scenarios where the instrument is traded considerably higher than its fair value. Overvaluation is caused by market sentiments when there is positive news.
Disclosure: I am part of Trade Nation's Influencer program and receive a monthly fee for using their TradingView charts in my analysis.
Like and subscribe and comment my ideas if you enjoy them!
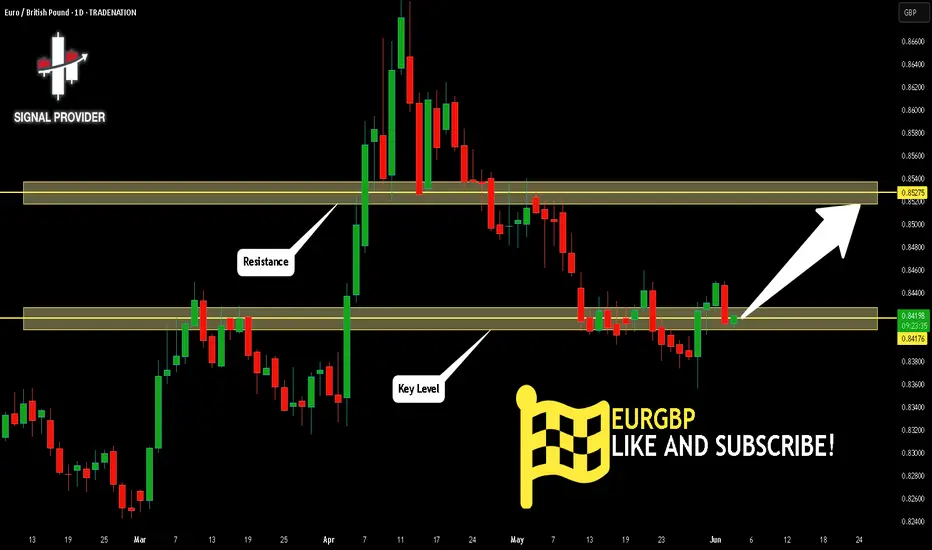
EURGBP Is Very Bullish! Buy!
Take a look at our analysis for EURGBP.
Time Frame: 1D
Current Trend: Bullish
Sentiment: Oversold (based on 7-period RSI)
Forecast: Bullish
The market is testing a major horizontal structure 0.841.
Taking into consideration the structure & trend analysis, I believe that the market will reach 0.852 level soon.
P.S
Overbought describes a period of time where there has been a significant and consistent upward move in price over a period of time without much pullback.
Disclosure: I am part of Trade Nation's Influencer program and receive a monthly fee for using their TradingView charts in my analysis.
Like and subscribe and comment my ideas if you enjoy them!
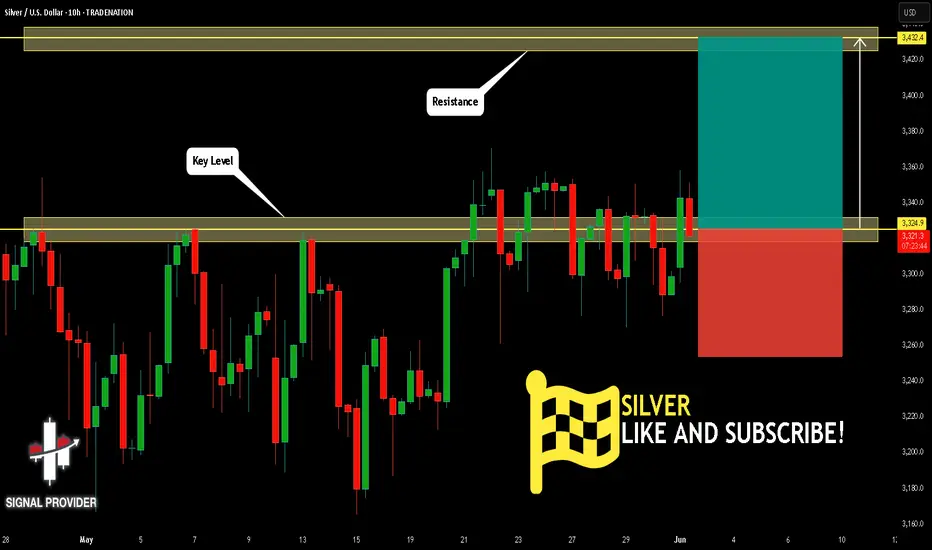
SILVER Will Go Up! Buy!
Take a look at our analysis for SILVER.
Time Frame: 10h
Current Trend: Bullish
Sentiment: Oversold (based on 7-period RSI)
Forecast: Bullish
The market is testing a major horizontal structure 3,324.9.
Taking into consideration the structure & trend analysis, I believe that the market will reach 3,432.4 level soon.
P.S
The term oversold refers to a condition where an asset has traded lower in price and has the potential for a price bounce.
Overbought refers to market scenarios where the instrument is traded considerably higher than its fair value. Overvaluation is caused by market sentiments when there is positive news.
Disclosure: I am part of Trade Nation's Influencer program and receive a monthly fee for using their TradingView charts in my analysis.
Like and subscribe and comment my ideas if you enjoy them!
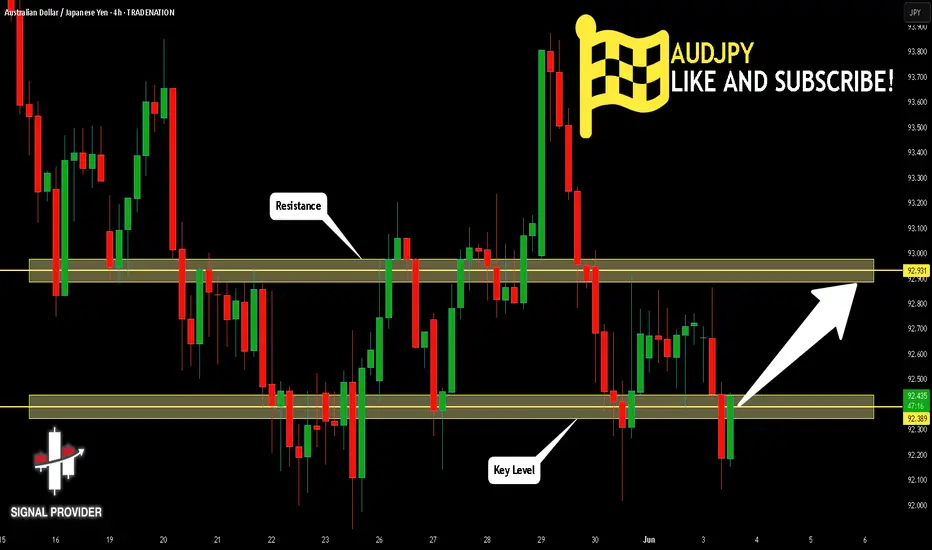
AUDJPY Will Go Up From Support! Long!
Please, check our technical outlook for AUDJPY.
Time Frame: 4h
Current Trend: Bullish
Sentiment: Oversold (based on 7-period RSI)
Forecast: Bullish
The price is testing a key support 92.389.
Current market trend & oversold RSI makes me think that buyers will push the price. I will anticipate a bullish movement at least to 92.931 level.
P.S
Overbought describes a period of time where there has been a significant and consistent upward move in price over a period of time without much pullback.
Disclosure: I am part of Trade Nation's Influencer program and receive a monthly fee for using their TradingView charts in my analysis.
Like and subscribe and comment my ideas if you enjoy them!
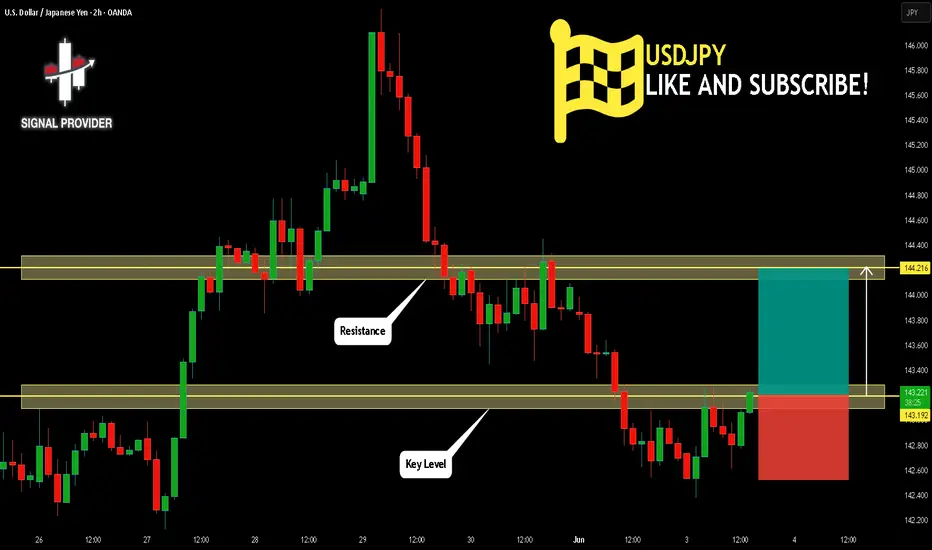
USDJPY Will Go Higher From Support! Buy!
Take a look at our analysis for USDJPY.
Time Frame: 2h
Current Trend: Bullish
Sentiment: Oversold (based on 7-period RSI)
Forecast: Bullish
The market is on a crucial zone of demand 143.192.
The oversold market condition in a combination with key structure gives us a relatively strong bullish signal with goal 144.216 level.
P.S
We determine oversold/overbought condition with RSI indicator.
When it drops below 30 - the market is considered to be oversold.
When it bounces above 70 - the market is considered to be overbought.
Disclosure: I am part of Trade Nation's Influencer program and receive a monthly fee for using their TradingView charts in my analysis.
Like and subscribe and comment my ideas if you enjoy them!
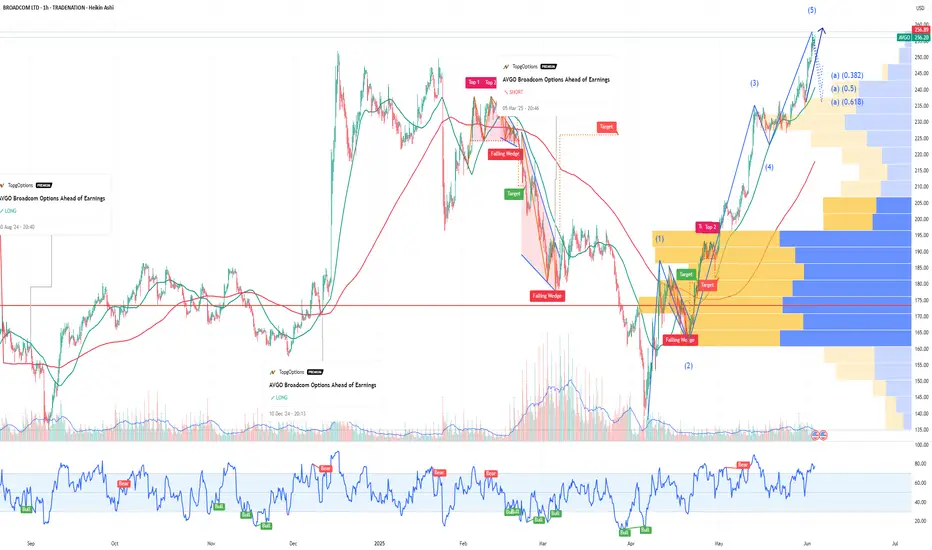
AVGO Broadcom Options Ahead of EarningsIf you haven`t bought AVGO before the rally:
Now analyzing the options chain and the chart patterns of AVGO Broadcom prior to the earnings report this week,
I would consider purchasing the 250usd strike price Calls with
an expiration date of 2025-6-13,
for a premium of approximately $14.75.
If these options prove to be profitable prior to the earnings release, I would sell at least half of them.
Disclosure: I am part of Trade Nation's Influencer program and receive a monthly fee for using their TradingView charts in my analysis.
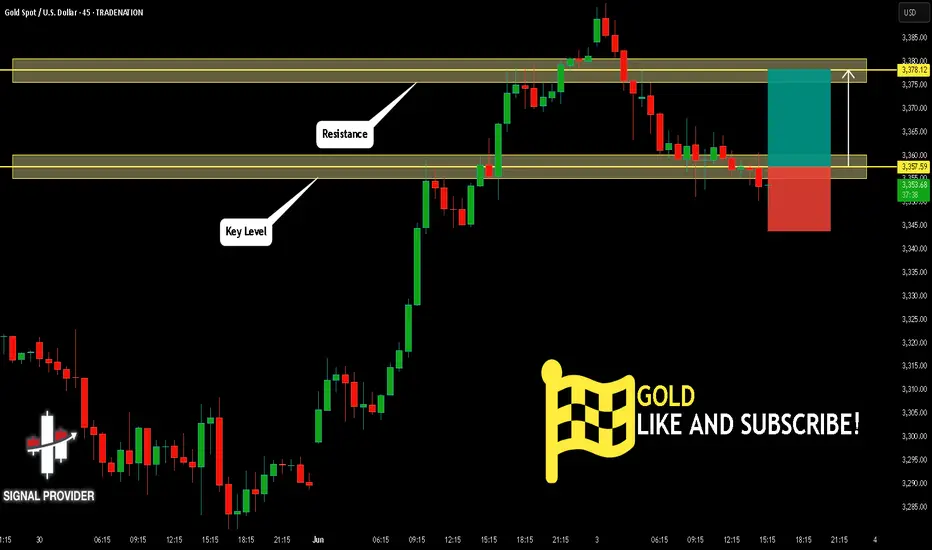
GOLD Will Grow! Long!
Here is our detailed technical review for GOLD.
Time Frame: 45m
Current Trend: Bullish
Sentiment: Oversold (based on 7-period RSI)
Forecast: Bullish
The market is approaching a significant support area 3,357.59.
The underlined horizontal cluster clearly indicates a highly probable bullish movement with target 3,378.12 level.
P.S
The term oversold refers to a condition where an asset has traded lower in price and has the potential for a price bounce.
Overbought refers to market scenarios where the instrument is traded considerably higher than its fair value. Overvaluation is caused by market sentiments when there is positive news.
Disclosure: I am part of Trade Nation's Influencer program and receive a monthly fee for using their TradingView charts in my analysis.
Like and subscribe and comment my ideas if you enjoy them!
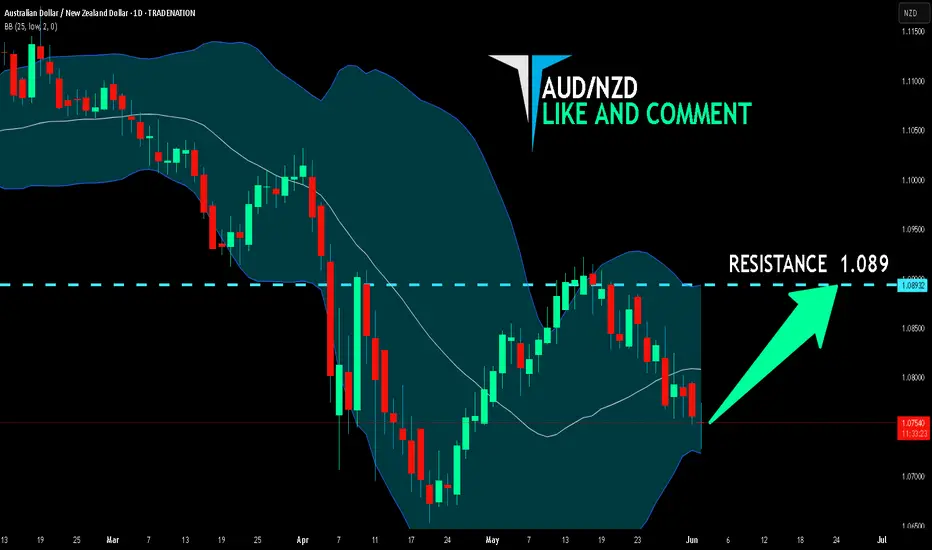
AUD/NZD SENDS CLEAR BULLISH SIGNALS|LONG
Hello, Friends!
AUD/NZD pair is trading in a local downtrend which we know by looking at the previous 1W candle which is red. On the 1D timeframe the pair is going down too. The pair is oversold because the price is close to the lower band of the BB indicator. So we are looking to buy the pair with the lower BB line acting as support. The next target is 1.089 area.
Disclosure: I am part of Trade Nation's Influencer program and receive a monthly fee for using their TradingView charts in my analysis.
✅LIKE AND COMMENT MY IDEAS✅
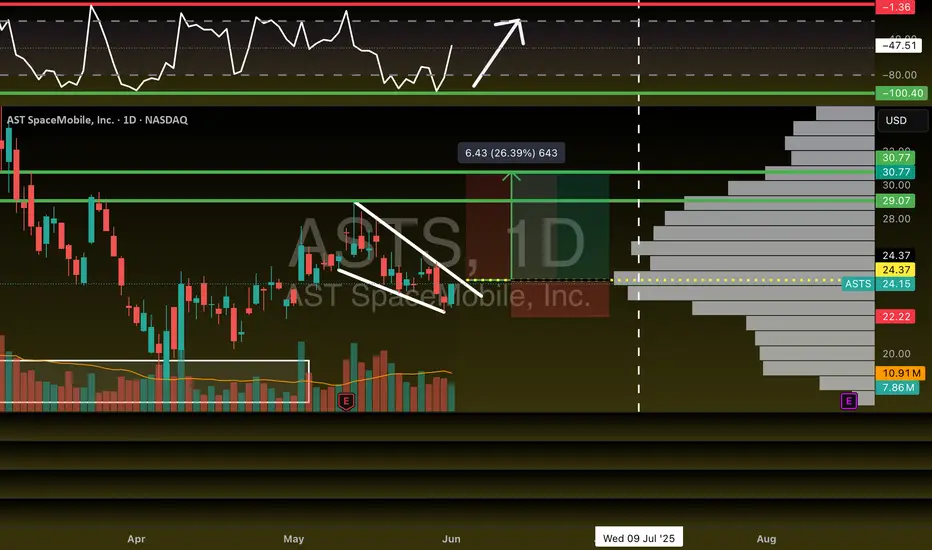
$ASTS Trade Alert Setup - 26% Upside🚨 NASDAQ:ASTS Trade Alert Setup 🚨
Falling Wedge Breakout at $24.37 =
🎯 $29.07 📏 $30.77
Trading Plan: July 11th $26 Calls on Breakout or shares
Hindcopper's Channel Breakout DueHindustan Copper Ltd. has recently garnered attention due to its strong financial performance and positive market sentiment.
Stock has broken out above key resistance around ₹240–₹245 with volume support.
Trend: Bullish
Indicators:
RSI ~67 (strong momentum)
MACD positive crossover
Above 50- & 200-DMA
Target Levels (Upside Potential)
Target Level Reason
270 Minor resistance zone (prior supply area)
292–295 Near-term swing high (Feb 2024 levels)
320+ Medium-term breakout target if momentum sustains
Stoploss Levels
Stoploss Type Level
Reason
Tight Stoploss 240 Previous breakout zone
Moderate SL 225 Near 50-day moving average
Positional SL 216 Breakdown confirmation below trend support
Buy on dips strategy around 245 -250 levels

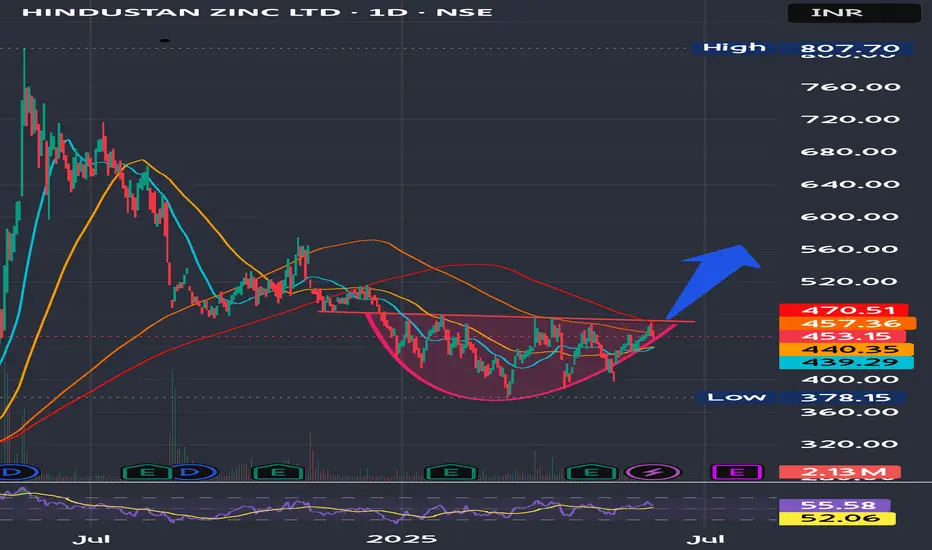
Hindustan Zinc Ltd at near breakout Hindustan Zinc Ltd. (Hindzinc) is one of the world's largest integrated producers of zinc, lead, and silver.
It is near a crucial resistance level and making higher lows indicating a breakout upwards soon.
Trading Levels-
Tgt Price-564
SL-448.5
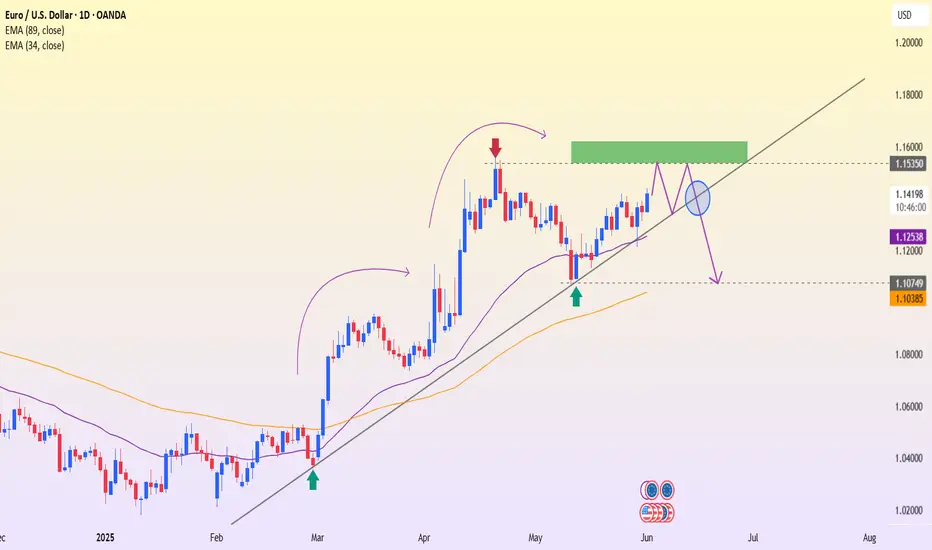
EURUSD – The bearish threat is becoming increasingly clearRecently released PMI data shows that the U.S. manufacturing sector is rebounding. This dampens expectations of monetary easing from the Fed. With a stronger U.S. dollar and rising bond yields, USD-denominated assets like EURUSD are facing downward pressure.
On the daily chart, EURUSD is approaching the resistance zone at 1.16438 – an area that has rejected prices before. The recent rebound appears to be losing strength, and the ascending trendline is at risk of breaking.
If the price fails to hold above this trendline as illustrated, a breakout to the downside could drive the market toward the 1.10757 zone – which aligns with a previous strong support level.
In summary: be cautious of a potential trend break. If a pattern of lower highs continues, sellers may soon take control.
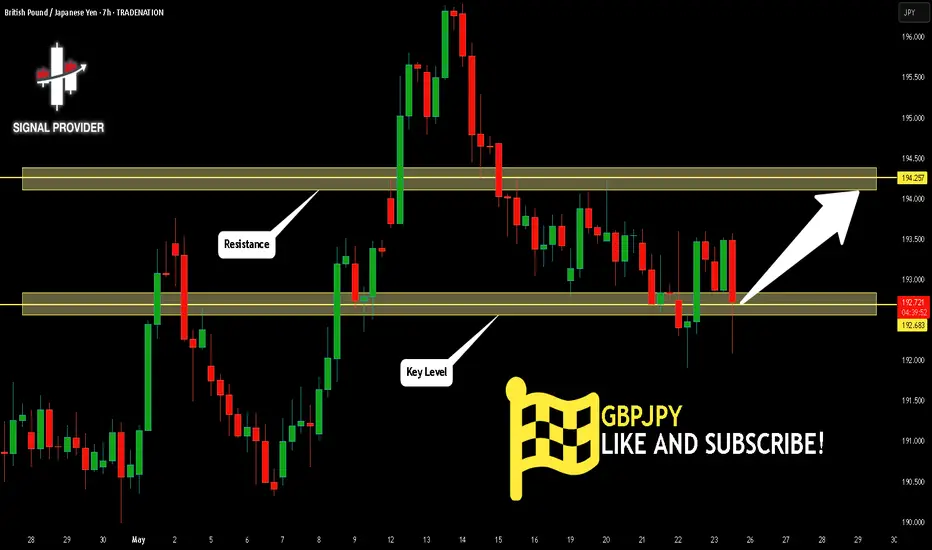
GBPJPY Is Very Bullish! Long!
Please, check our technical outlook for GBPJPY.
Time Frame: 7h
Current Trend: Bullish
Sentiment: Oversold (based on 7-period RSI)
Forecast: Bullish
The price is testing a key support 192.683.
Current market trend & oversold RSI makes me think that buyers will push the price. I will anticipate a bullish movement at least to 194.257 level.
P.S
We determine oversold/overbought condition with RSI indicator.
When it drops below 30 - the market is considered to be oversold.
When it bounces above 70 - the market is considered to be overbought.
Disclosure: I am part of Trade Nation's Influencer program and receive a monthly fee for using their TradingView charts in my analysis.
Like and subscribe and comment my ideas if you enjoy them!
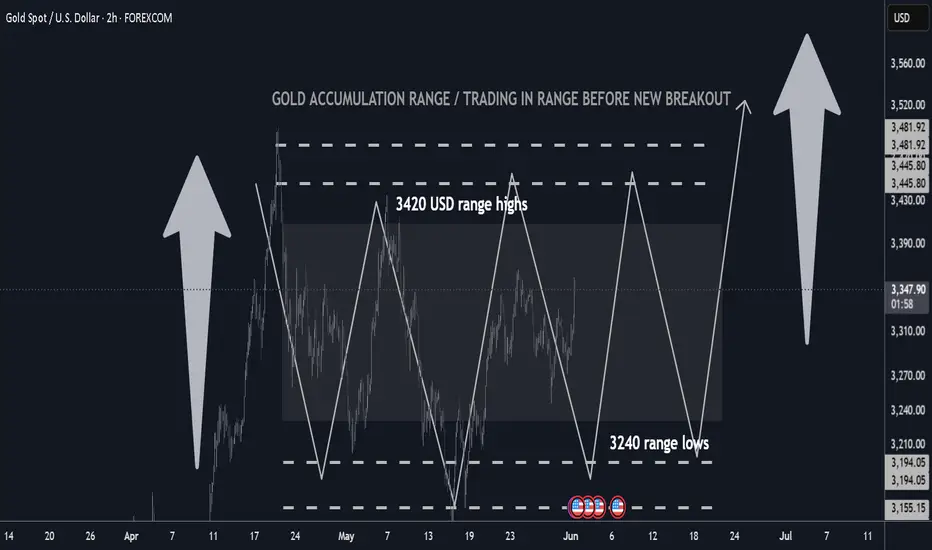
Gold H2 Market Update Ongoing Accumulation BUY LOW SELL HIGH📊 Technical Outlook Update H4
🏆 Bull Market Overview
Gold is currently trading around $3,352.69 per ounce, up 1.9% today, reaching its highest level since May 23, driven by renewed safe-haven demand amid escalating U.S.-China trade tensions and a weaker dollar. The market remains range-bound, with key resistance levels at $3,410 and $3,460, and support levels at $3,160 and $3,240. Volatility is expected to remain moderate, with potential catalysts including upcoming U.S. employment data and central bank policy decisions.
⭐️ Recommended Strategy
Continue to buy on dips near support levels and sell near resistance levels, capitalizing on the current range-bound market conditions. Monitor for potential breakouts above resistance or breakdowns below support, which could signal a shift in market dynamics.
Latest Gold Market Updates:
📈 Gold prices have surged due to renewed tariff threats from the U.S. and escalating geopolitical tensions, prompting investors to seek safety in gold.
💰 Gold miners are largely avoiding hedging strategies to fully benefit from the current market, reflecting strong bullish sentiment in the industry.
🔮 Citibank projects gold prices could rally to $3,500 over the next three months, citing strong demand and macroeconomic factors.
📊 JP Morgan anticipates gold prices exceeding $4,000 per ounce by Q2 2026, with an average of $3,675 in Q4 2025, driven by continued investor and central bank demand.
⭐️ Goldman Sachs has raised its year-end 2025 forecast to $3,700, with a potential upside scenario reaching $4,500, based on strong Asian buying and central bank purchases.
💍 Record gold prices are prompting jewelry designers to shift toward 14-karat gold and alternative materials to control costs, while consumer demand remains robust.
🔮 Outlook Summary
Gold remains in a bullish trend, supported by safe-haven demand amid geopolitical tensions and economic uncertainties. The market is currently range-bound, with key levels to watch at $3,160–$3,240 for support and $3,410–$3,460 for resistance. Upcoming economic data releases and central bank policy decisions could act as catalysts for a breakout from the current range. Analysts maintain a positive outlook, with forecasts suggesting potential for further price increases in the medium to long term.
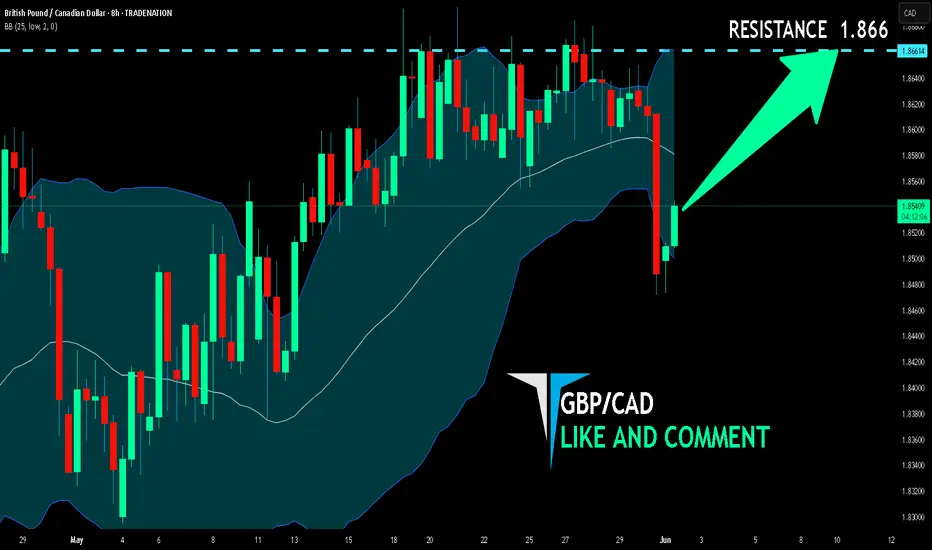
GBP/CAD BEST PLACE TO BUY FROM|LONG
Hello, Friends!
We are now examining the GBP/CAD pair and we can see that the pair is going down locally while also being in a downtrend on the 1W TF. But there is also a powerful signal from the BB lower band being nearby indicating that the pair is oversold so we can go long from the support line below and a target at 1.866 level.
Disclosure: I am part of Trade Nation's Influencer program and receive a monthly fee for using their TradingView charts in my analysis.
✅LIKE AND COMMENT MY IDEAS✅
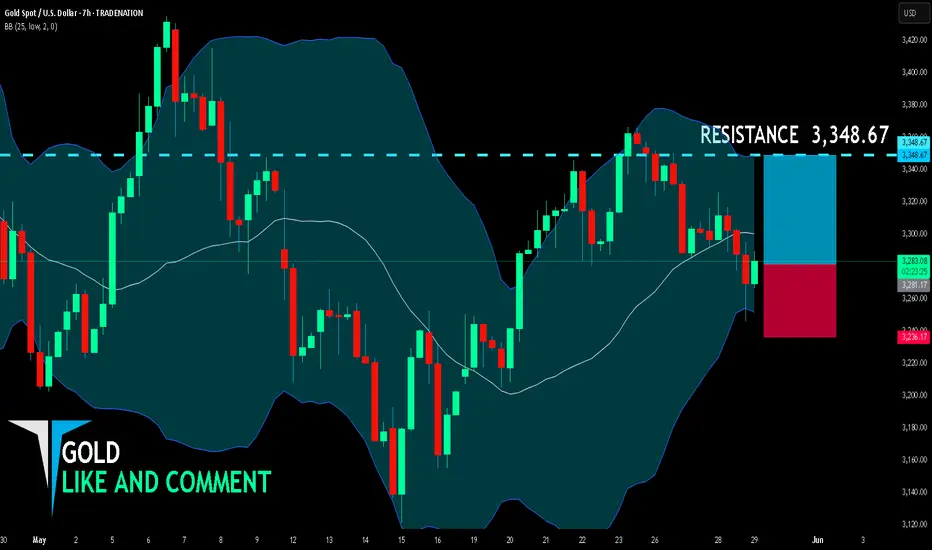
GOLD LONG FROM SUPPORT
GOLD SIGNAL
Trade Direction: long
Entry Level: 3,281.17
Target Level: 3,348.67
Stop Loss: 3,236.17
RISK PROFILE
Risk level: medium
Suggested risk: 1%
Timeframe: 7h
Disclosure: I am part of Trade Nation's Influencer program and receive a monthly fee for using their TradingView charts in my analysis.
✅LIKE AND COMMENT MY IDEAS✅
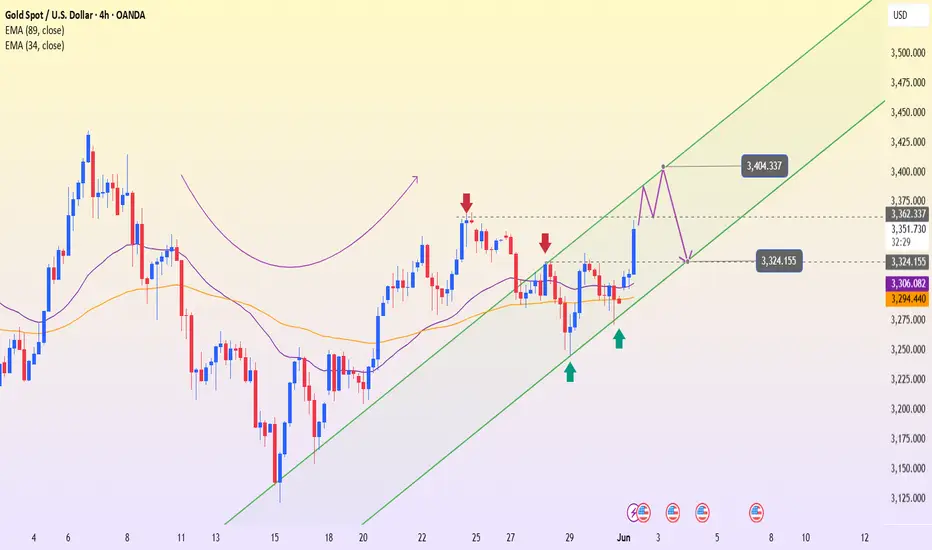
XAUUSD – Pressure becoming evident at higher price levelsAfter an impressive recovery streak, gold may soon have a chance to approach the 3,404 resistance zone – the top of the current ascending channel. This is not only the upper boundary of the technical structure but also an area where price has been rejected multiple times before, making it a likely profit-taking point or a trigger for renewed selling pressure.
In addition, the newly released U.S. PMI data exceeded expectations, signaling that manufacturing activity is recovering well. This has prompted the market to reassess expectations for Fed policy easing – pushing up both bond yields and the USD, while gold – which yields no interest – is facing pressure.
If buyers fail to produce a clear candle close above the 3,404 zone, a pullback scenario toward the 3,324 support area becomes highly plausible. This will be a “strength-testing” zone for both sides in the upcoming sessions.
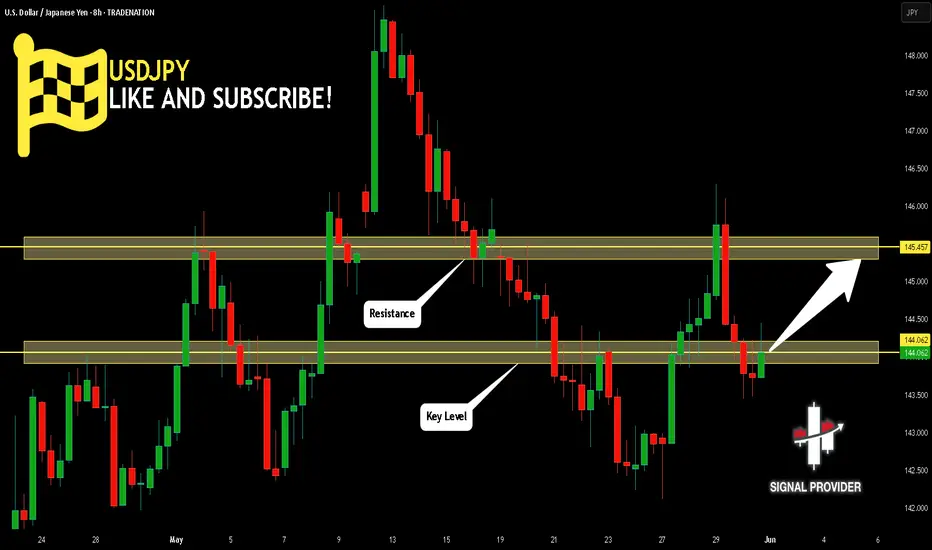
USDJPY Will Grow! Long!
Here is our detailed technical review for USDJPY.
Time Frame: 8h
Current Trend: Bullish
Sentiment: Oversold (based on 7-period RSI)
Forecast: Bullish
The market is trading around a solid horizontal structure 144.062.
The above observations make me that the market will inevitably achieve 145.457 level.
P.S
We determine oversold/overbought condition with RSI indicator.
When it drops below 30 - the market is considered to be oversold.
When it bounces above 70 - the market is considered to be overbought.
Disclosure: I am part of Trade Nation's Influencer program and receive a monthly fee for using their TradingView charts in my analysis.
Like and subscribe and comment my ideas if you enjoy them!
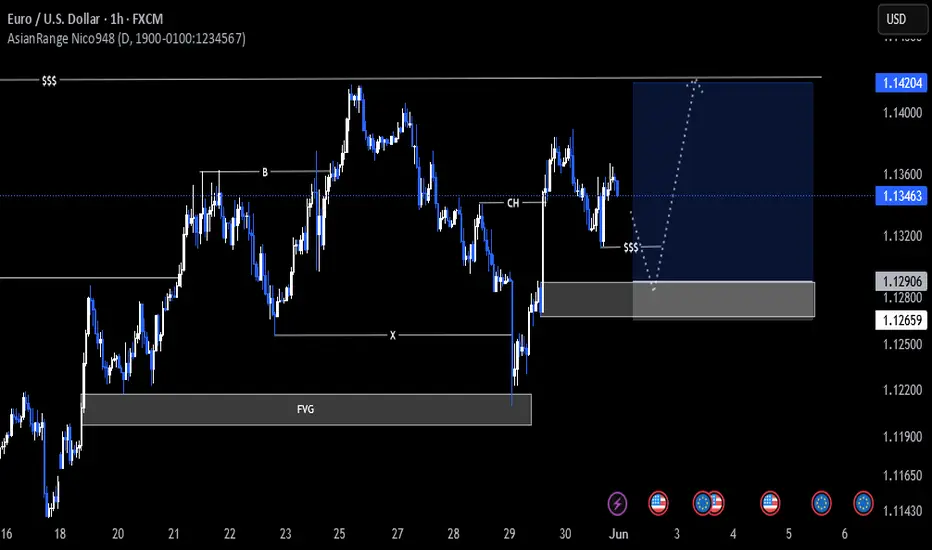
EURUSD Possible AnalysisEURUSD has been overall bullish with retracemets here and there. It has recently made a deep retracement that could be mistaken for a shift in market structure, while in reality it's just liquidity accumulation. Price recently shifted structure back to bullish on 4h timeframe where it preceded to break more structure before retracing to sweep liquidity below a low and tap a fvg in the process. It preceded to shift structure on the 1h time frame, breaking with a huge bullish candle symbolizing increase in bullish momentum. It is currently retracing towards an orderblock that was responsible for the break and could possibly retest it and fill the imbalance above it before it continues its bullish move up to take out the latest weak high.
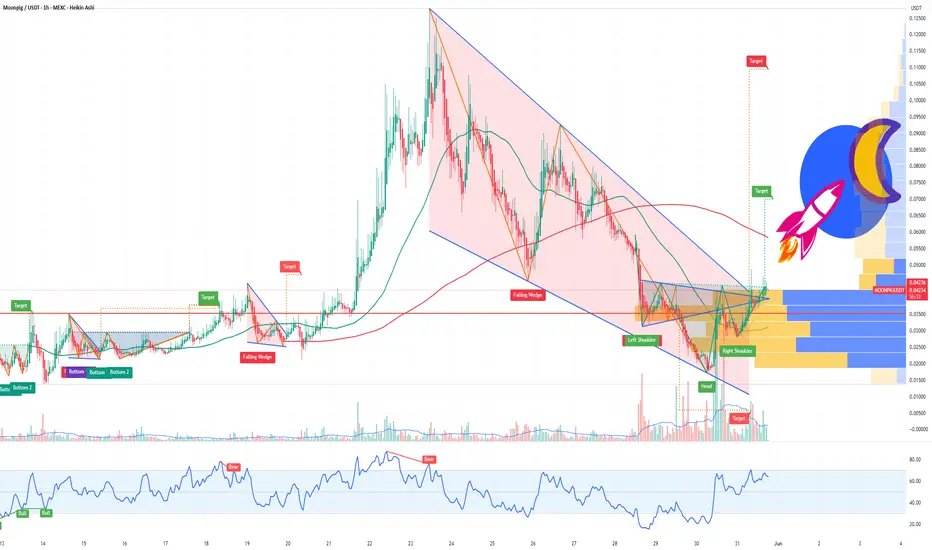
MOONPIG Is Taking Off — Thanks to James Wynn’s Viral CloutThe James Wynn Phenomenon:
James Wynn, a crypto trader who turned $4 million into $100 million before losing nearly all of it in leveraged Bitcoin futures, has become a polarizing figure in the crypto space. His massive trades, including a $1.2 billion Bitcoin long position that ended in a $17.5 million loss and a subsequent $1 billion short position with 40x leverage, have made him a viral sensation. Despite these setbacks, Wynn’s resilience and bold moves keep him in the spotlight, with thousands of traders and investors following his every step.
Wynn’s fame stems not just from his trading but from his ability to move markets. His posts on X, where he boasts a significant following, often trigger rapid price movements in the assets he mentions. This influence is now centered on $MOONPIG, a Solana-based meme coin that’s gaining traction thanks to his vocal support.
$MOONPIG: A Meme Coin with Momentum:
$MOONPIG, a meme coin built on the Solana blockchain, has seen its price surge by as much as 80% following Wynn’s endorsements, though it’s also faced volatility with a 30% drop in 24 hours and a 60% decline from its all-time high. Despite these fluctuations, the coin’s community-driven narrative and Wynn’s backing make it a compelling speculative play.
Wynn’s posts on X reveal his belief in $MOONPIG’s potential to be the “next SafeMoon” of this cycle, predicting a run to a billion-dollar market cap. He’s emphasized its appeal to retail investors, calling it “normie-friendly” and highlighting its strong community as a key driver. This narrative aligns with the meme coin mania that often propels tokens like CRYPTOCAP:DOGE or CRYPTOCAP:SHIB to explosive gains during bullish market phases.
Why I’m Bullish:
Wynn’s Influence as a Catalyst: Wynn’s fame amplifies $MOONPIG’s visibility. His posts on X, such as one claiming he transferred profits to the $MOONPIG reserves wallet, signal commitment and attract attention. When Wynn speaks, traders listen, and his endorsements have already driven significant price action, with one instance sparking an 80% surge.
Community Strength: Wynn has emphasized $MOONPIG’s community-driven ethos, stating it “doesn’t need KOLs or BS” and thrives on organic support. In the meme coin space, strong communities can sustain momentum, as seen with tokens like CRYPTOCAP:PEPE , which Wynn also supports.
Market Timing: With Bitcoin hitting new highs and retail interest flooding back into crypto, $MOONPIG is well-positioned to ride the wave. Wynn’s thesis that retail investors will soon pour into altcoins aligns with current market sentiment, making $MOONPIG a potential beneficiary.
Speculative Upside: Meme coins thrive on hype, and $MOONPIG’s low market cap relative to its potential—analysts like @KookCapitalLLC
speculate a $1 billion valuation—offers significant upside for early investors. Even after recent pullbacks, the coin’s volatility suggests opportunities for traders who can stomach the risk.
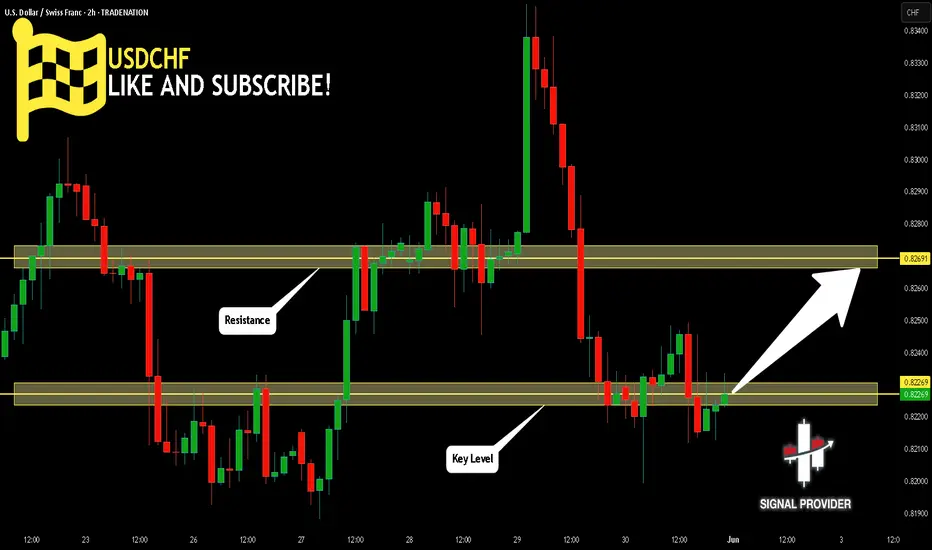
USDCHF Will Go Up From Support! Long!
Please, check our technical outlook for USDCHF.
Time Frame: 2h
Current Trend: Bullish
Sentiment: Oversold (based on 7-period RSI)
Forecast: Bullish
The market is approaching a key horizontal level 0.822.
Considering the today's price action, probabilities will be high to see a movement to 0.826.
P.S
Please, note that an oversold/overbought condition can last for a long time, and therefore being oversold/overbought doesn't mean a price rally will come soon, or at all.
Disclosure: I am part of Trade Nation's Influencer program and receive a monthly fee for using their TradingView charts in my analysis.
Like and subscribe and comment my ideas if you enjoy them!
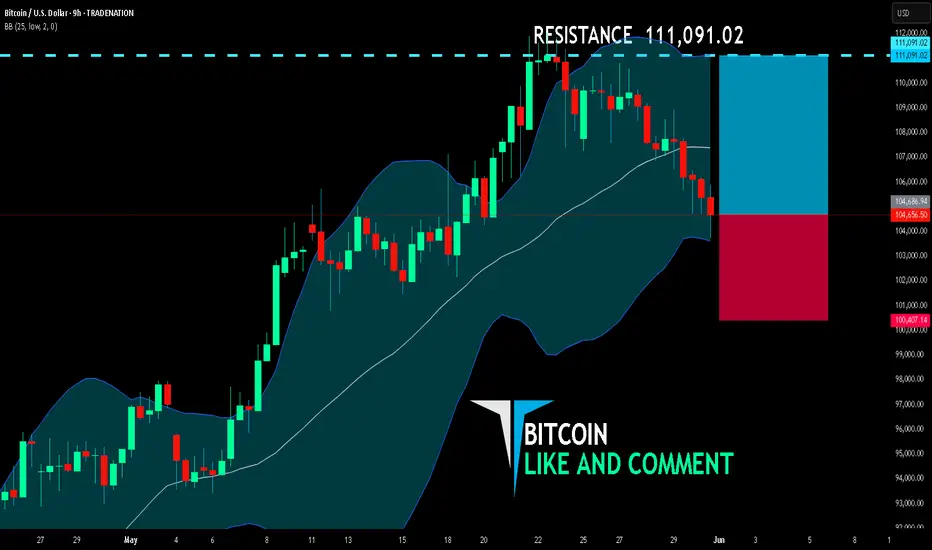
BITCOIN BULLS WILL DOMINATE THE MARKET|LONG
BITCOIN SIGNAL
Trade Direction: long
Entry Level: 104,686.94
Target Level: 111,091.02
Stop Loss: 100,407.14
RISK PROFILE
Risk level: medium
Suggested risk: 1%
Timeframe: 9h
Disclosure: I am part of Trade Nation's Influencer program and receive a monthly fee for using their TradingView charts in my analysis.
✅LIKE AND COMMENT MY IDEAS✅