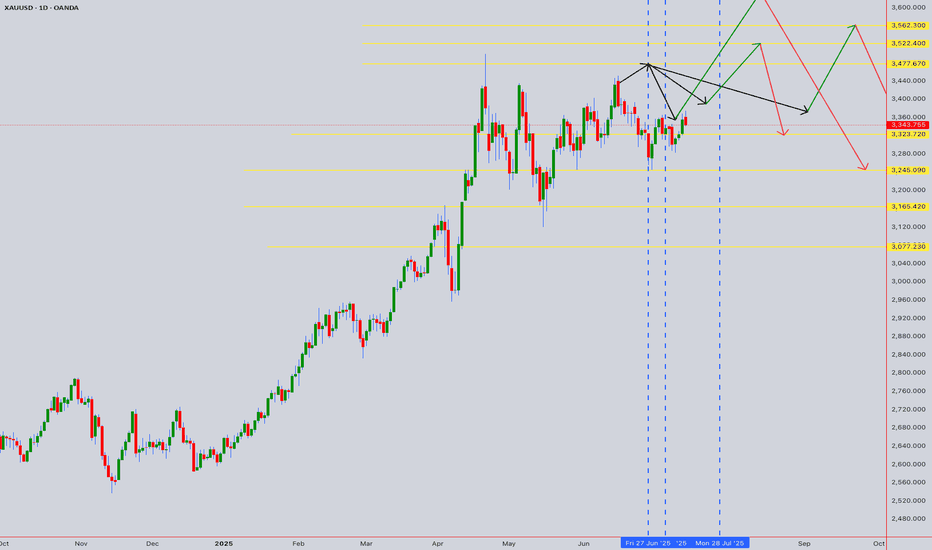
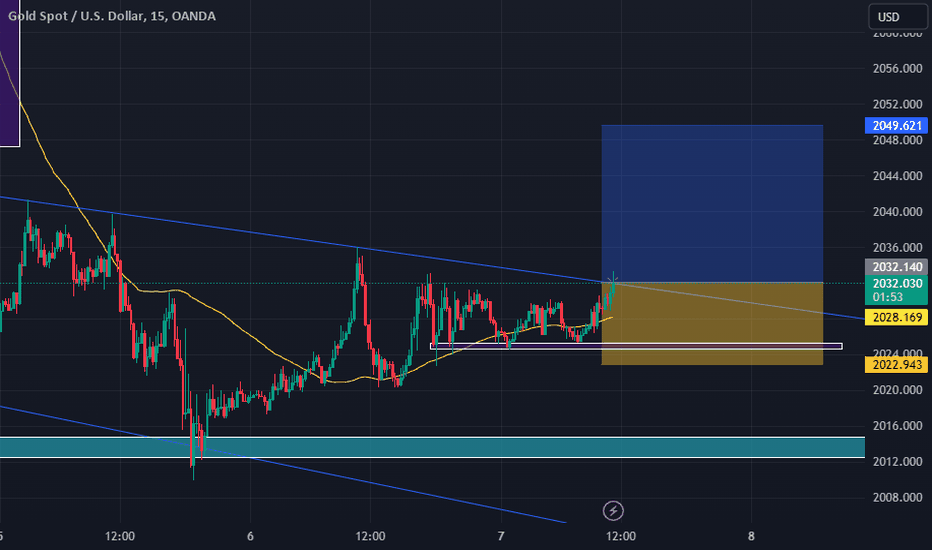
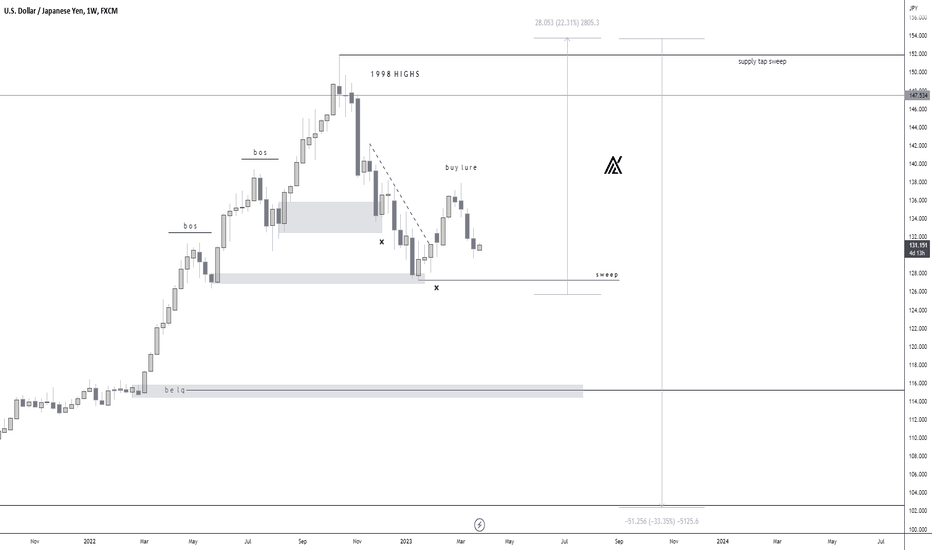
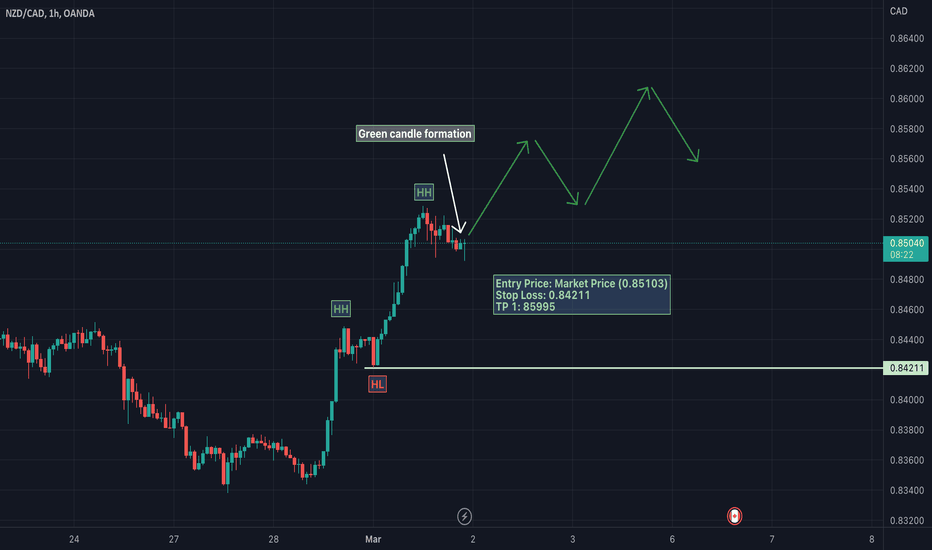
XAUUSD 1440M forecast Based on the latest available information for July 15, 2025, the overall sentiment for XAUUSD (Gold) in the next 24 hours leans towards a bullish outlook, though with potential for short-term fluctuations and pullbacks.
Key Drivers for Bullish Outlook:
Escalating Trade Tensions: US President Donald Trump's ongoing tariff and trade policies are a significant factor. New tariffs and threats against various countries (EU, Mexico, Japan, South Korea, Brazil, Canada) are creating global economic uncertainty, which typically boosts gold's appeal as a safe-haven asset.
Geopolitical Uncertainty: Broader geopolitical risks, including those related to Russia and Ukraine, also contribute to safe-haven demand for gold.
Inflation Concerns: Tariffs are linked to inflation concerns. Gold performs strongly in a high-inflation environment, and market expectations are shifting towards a more gradual easing of interest rates by the Fed, allowing for inflation to be a potential driver.
Central Bank Demand: Central banks globally, particularly the US and China, continue to be strong buyers of gold, indicating a sustained structural trend of higher gold purchases.
Technical Support: Several analyses point to gold finding support at key levels (e.g., around $3340-3345, 200 EMA), suggesting potential for bounces and continuation of an upward trend.
"Buy on Dip" Strategy: Many analysts are recommending a "buy on dip" strategy, indicating an underlying bullish bias and viewing any short-term declines as buying opportunities.
Factors to Watch (Potential for Pullbacks/Volatility):
Short-Term Weakness/Consolidation: Some technical indicators suggest short-term weakness or consolidation, with gold testing resistance levels (e.g., $3375-3380, $3400).
US Dollar Strength: While trade tensions can weaken the dollar, there are mixed signals. A stronger US dollar can put downward pressure on gold prices as it makes gold more expensive for holders of other currencies.
Inflation Data and Fed Signals: Investors are closely watching US inflation data (CPI) and signals from Federal Reserve officials regarding interest rate cuts. While some expect cuts later in the year, any hawkish surprises could temper gold's rise.
Trade Deal Hopes: Any signs of de-escalation in trade tensions or progress towards agreements could temporarily reduce safe-haven demand for gold.
Specific Price Levels Mentioned:
Resistance: $3375-3380, $3400, $3432, $3450-3470, $3500 (all-time high).
Support: $3340-3345, $3325-3330, $3289-3303, $3240-3246.
In summary, the prevailing sentiment for XAUUSD over the next 24 hours appears to be bullish, driven by ongoing global trade tensions and safe-haven demand. However, be prepared for potential short-term pullbacks or consolidation as the market digests new information and tests key resistance levels.
For those interested in further developing their trading skills based on these types of analyses, consider exploring the mentoring program offered by Shunya Trade.
I welcome your feedback on this analysis, as it will inform and enhance my future work.
Regards,
Shunya Trade
⚠️ Disclaimer: This post is educational content and does not constitute investment advice, financial advice, or trading recommendations. The views expressed here are based on technical analysis and are shared solely for informational purposes. The stock market is subject to risks, including capital loss, and readers should exercise due diligence before investing. We do not take responsibility for decisions made based on this content. Consult a certified financial advisor for personalized guidance.
Buyers
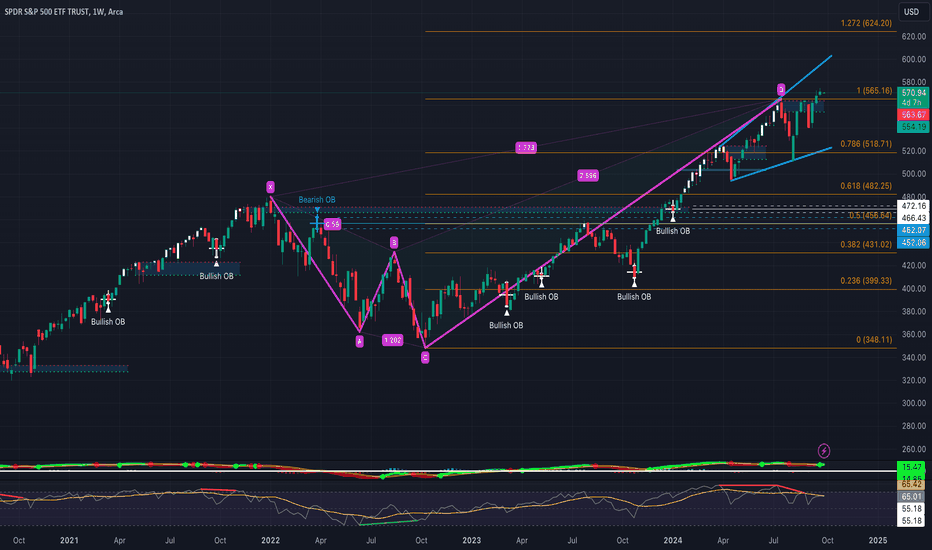
Megaphone - BearishSPY weekly looking interesting heading into the week. Staying hedged with the SPY holding another megaphone. The SPY is being carried by buyer volume with some hidden bearish divergence on the RSI and nearing overbought territory yet again.
With so many sectors and indexes flashing red and a massive bearish cipher on the weekly timeframe as further confirmation, looking forward to playing the downside.
Some FIB levels and RSI-based supply and demand zones to keep an eye on in the meantime (Accompanying Charts Attached Below)
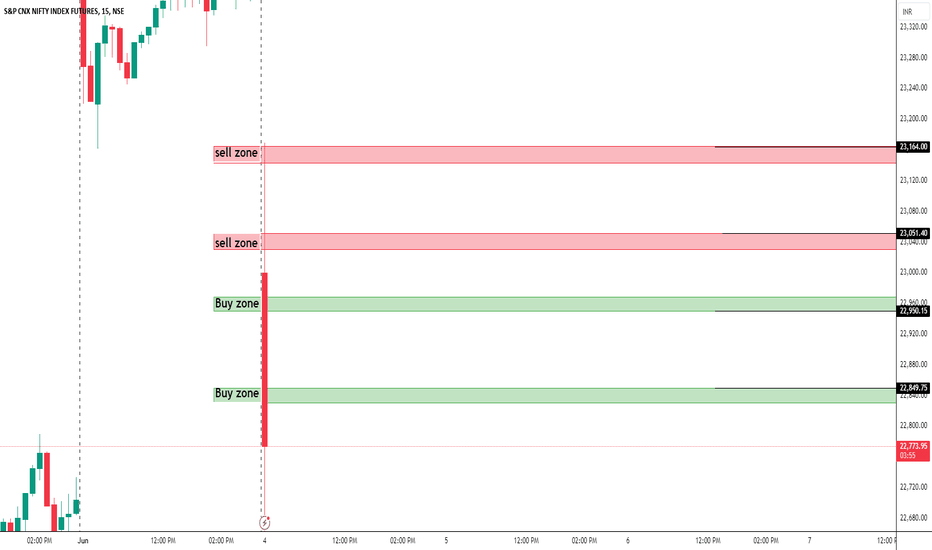
Nifty Institutional levels | Intraday 4-JUNE-2024 | 9:15 IST#Optionbuyers
#Niftyoptionscalping
🚀Get ready to explore live options trading with me, where we Trade in real-time analysis and predictions for Nifty. 💼💰Don't miss out the chance to turbocharge your portfolio and achieve your financial goals!!!
1) Zones you always Like:-
Green zone- institutional support
Red zone - institutional resistance
Gap between institutional zones is always of 100 points
Zone making is helped by pivot points and Fibonacci
Advance version of price action
2) Trade Execution:-
Trade based on order flow data
Timeframe - 1 min
Risk Reward Ratio always 1:2
Strike price always ATM & slightly ITM
Position sizing
3) House Rules in trading:-
Sharp at 9;15 AM
Priority to risk management
Fast execution (morning breakfast)
Stop-loss 10 points (strictly)
#ThankU For Checking Out Our Content , We Hope U Liked IT 📌
🙏FOLLOW for more !
👍LIKE if think is useful !
✍️COMMENT Below your view !
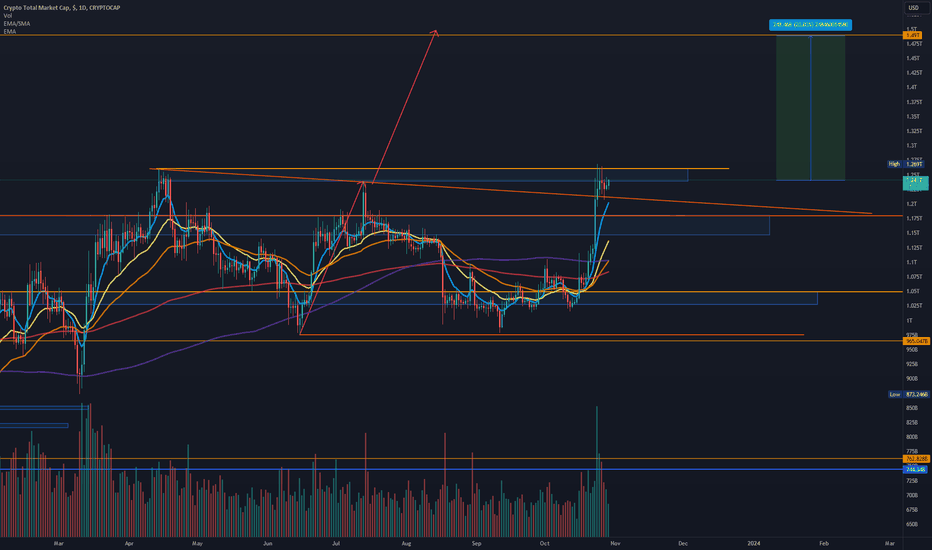
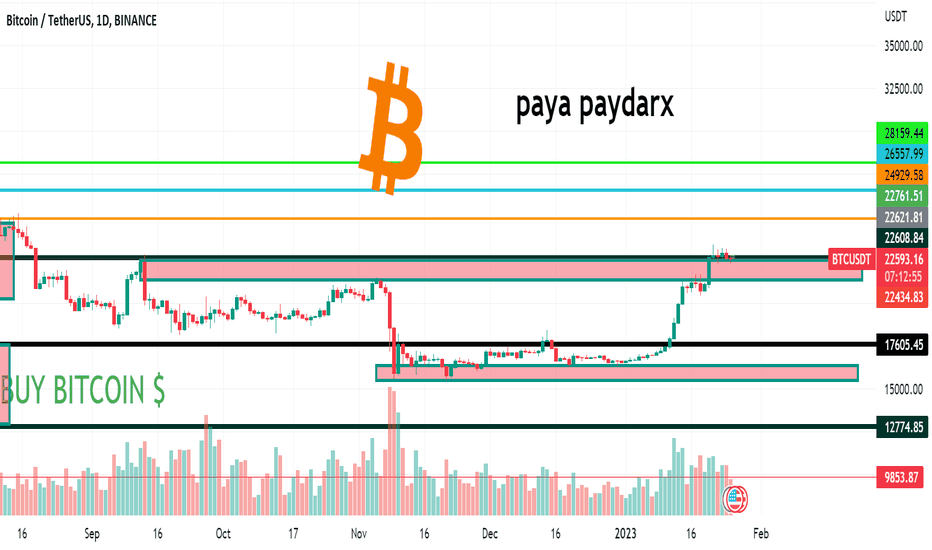
TOTAL 1 Will Crypto Christmas come early?I was thinking to wait till tomorrow till I post this analysis so more people could see it but oh well, let us do it today cause you never know what happens.
I think this is one of the most important charts when following crypto markets. (cause it shows crypto markets money inflows and outflows).
Bitcoin has broken out already from this years highs week ago (I'll add picture down), BUT Total 1 marketcap hasn't made higher highs yet.
If and when this breaks I believe we will see surge on BTC and possibly on alts that will wake up the bull narrative again. (News etc)
Target is 1.49 Trillion so that would be 250 Billion inflows to crypto markets, that's 20% rise!
Better to be prepared than get caught with pants down
Two active trades going on DYDX and GOLD
-PalenTrade
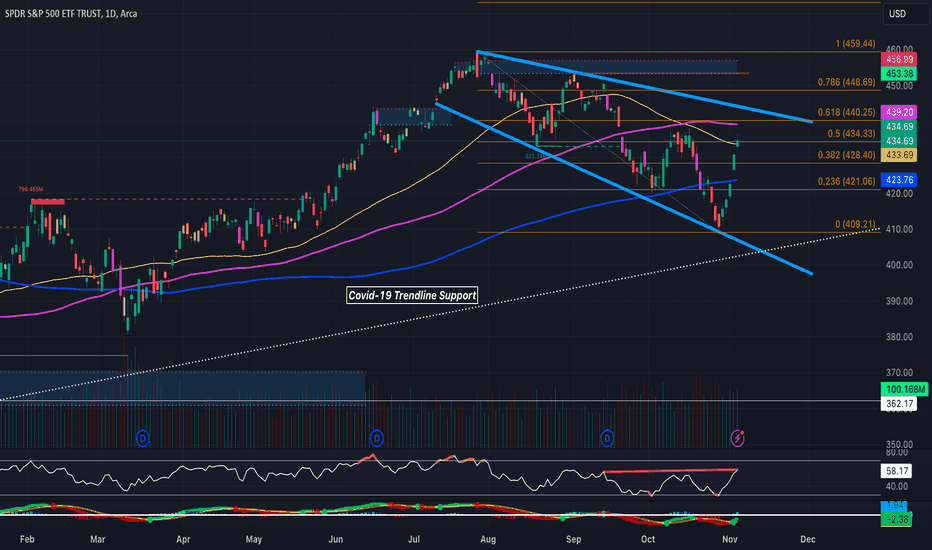
SPY- Bearish Megaphone - UpdatePosting another quick update here on the SPY as it closed last week sitting on its 50-day SMA, after the 50-day SMA crossed below the 100-day SMA, while simultaneously rejecting the .50 FIB level. The SPY is holding yet another bearish megaphone as buyers and sellers continue to fight, accompanied by some slight bearish divergence on the RSI. Just some key FIB levels to keep an eye on in the interim, along with some RSI-based supply and demand zones, staying hedged.
--Previous Charts Attached In Description --
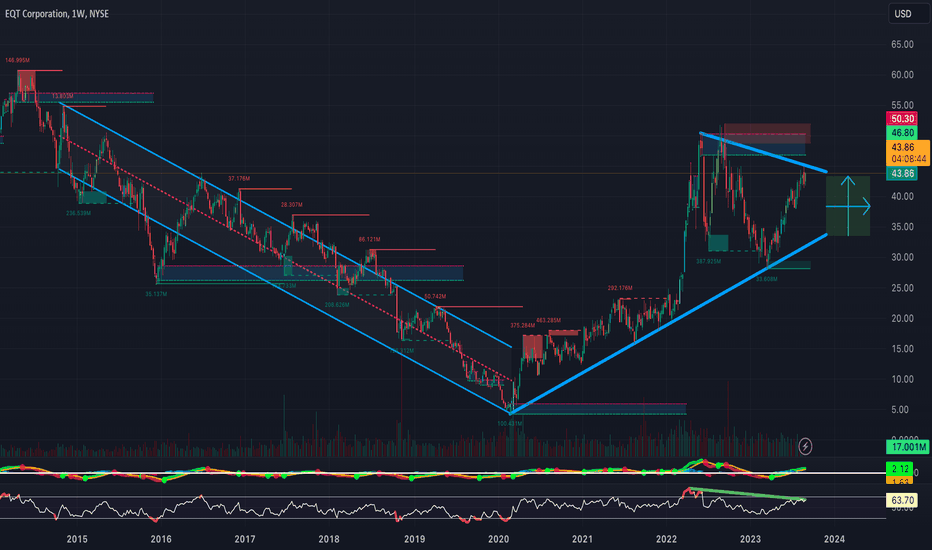
EQT- Going LongAfter being shorted to the N'th degree, and finally breaking out of the downwards channel EQT has been holding, EQT is seemingly consolidating here within a symmetrical triangle, as buyers continue to step in.
After breaking out of the downtrend, EQT has formed an inverse head and shoulders on the daily timeframe, along with finding support right in the FIB golden pocket, accompanied by a SMA golden cross. (See Attached Chart Below)
Will be keeping a close eye on the daily timeframe to start building a position in some synthetic longs and/or leaps. Bullish and am looking for another push upwards from here.
Falling Wedge- BullishAfter finally retracing, the lithium sector is starting to look ready to breakout with buyers starting to step in. Watching LAC & PLL closely here as both are holding massive falling wedges, however, PLL is seemingly forming an ascending triangle as well on its weekly timeframe (See Attached Chart Below). Additionally, PLL is holding the same falling wedge on the 4-Hour timeframe with its Bollinger bands squeezing, along with a Bullish Butterfly Harmonic Pattern, MACD golden cross. Bullish and will be looking for a breakout from this wedge (Broader Market Conditions Permitting)- Just some support and resistance levels to keep an eye on along with some RSI-based supply and demand zones in the meantime -- Price Targets & Previous Charts Attached In Description --
PT1- $56.12
PT2- $58.74
PT3- $60.07
PT4- $61.26+
--Weekly Timeframe--
--4-Hour Timeframe--
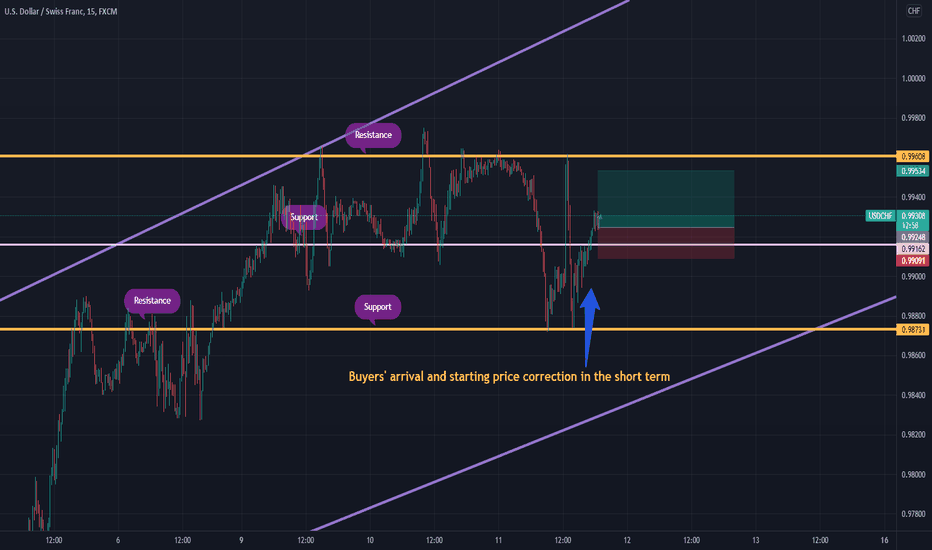
USDCAD : Possible Pull back from major support levelOANDA:USDCAD
Hi trader's .. Market breakout downside from descending Triangle
Market reached major support level , as market now in over sold area
so possible pull back from support level expected
Price Can make double bottom at 1.3556 area and from there buyer's can push market toward's 1.3645 area
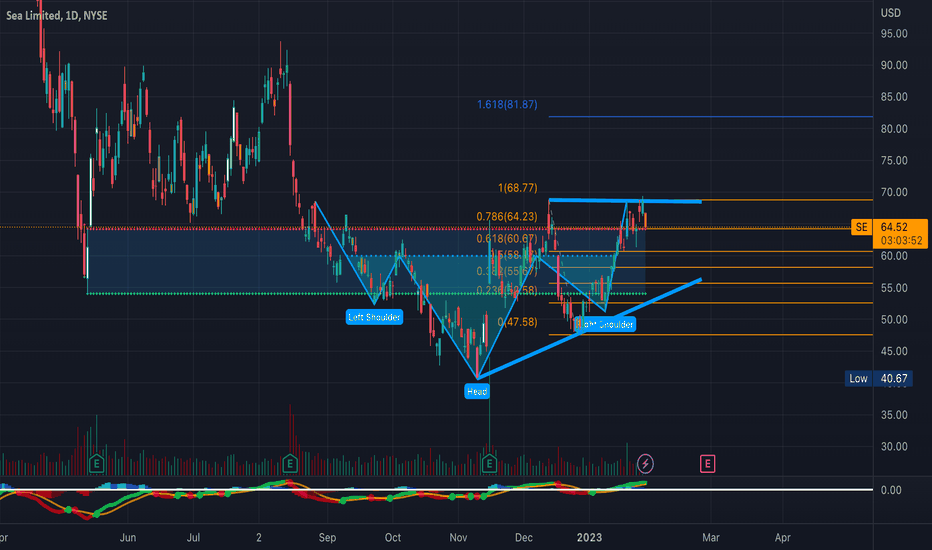
Ascending Triangle Forming- BullishEyeing SE here as it heads into earnings as it's been trading sideways for quite some time now after finding a bottom stemming from a big downtrend. SE has formed an inverse head and shoulders on the 4-Hour and daily timeframes, along with holding a massive bullish shark harmonic pattern on the weekly timeframe with the neckline between 62.45 and 63.95 (See Attached Chart Below). Additionally, SE has some nice bullish hidden divergence on the weekly timeframe along with its Bollinger Bands Squeezing. With buyer volume ramping up relative to seller volume, definitely will be keeping a close eye on this one. Bullish & will be watching closely for a breakout if buyers continue to step in (broader market conditions permitting)- Just some FIB levels along with some RSI-based supply and demand zones to keep an eye on in the meantime- Price Targets & Previous Charts Attached Below
PT1- $65.44
PT2- $66.88
PT3- $67.51
PT4- $69.02+
--Weekly Timeframe--
--Previously Charted--
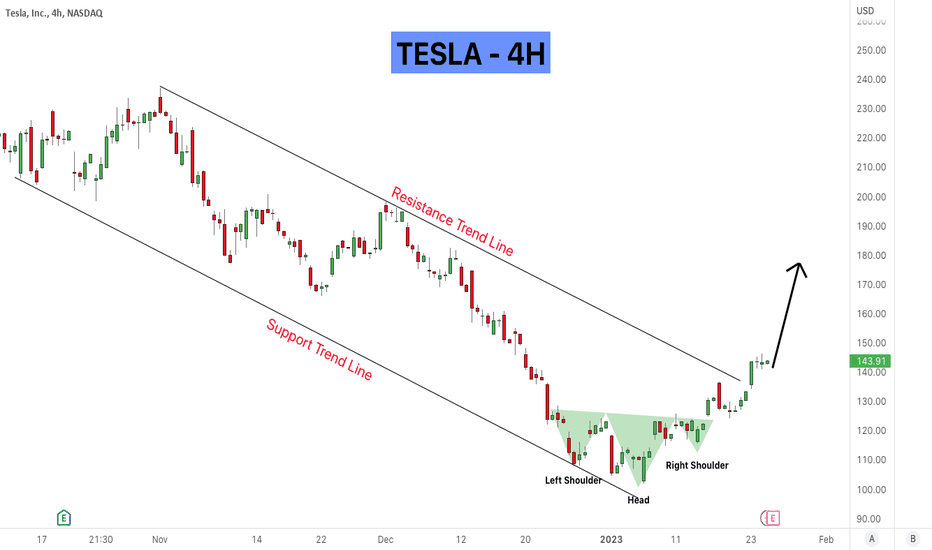
Tesla - upcoming earnings reportLet's look at Tesla from the technical point of view. On the chart we have an inverse head and shoulder pattern which signifies an onset of a bullish movement with current price also breaking the resistance trend line indicating strong momentum from the bulls ( buyers).
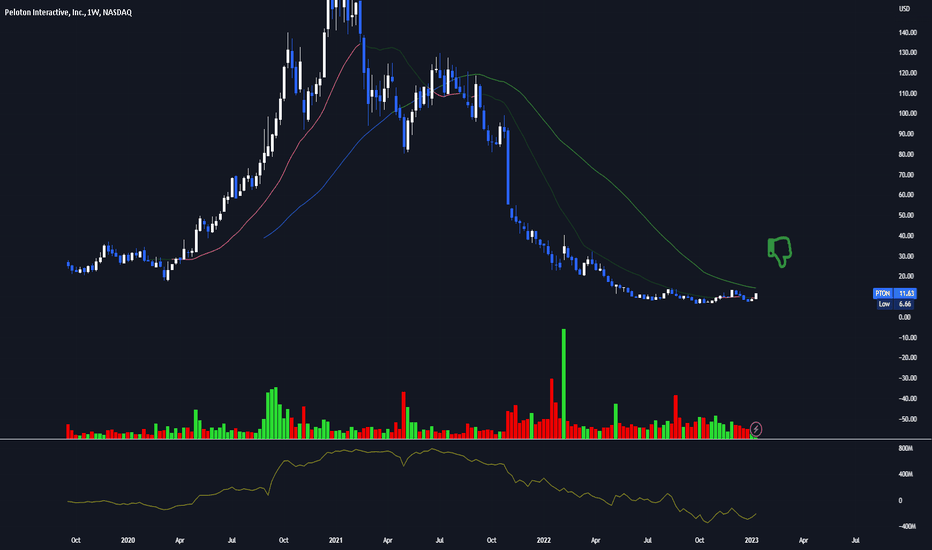
Investing in exercise bicycles...?People can say Peleton is sooo much more than an exercise bike. I don't disagree, however, it's core business and most valuable product is it's bike. Sure, subscriptions and add-ons bring in lots of cash, but you won't get any of that subscription money if your target market is as small as this one's is. I say that because you have to be financially in a decent position in life to even afford a service like Peleton, and I just don't buy into the idea that Amazon or Apple or some big tech will come along and eat this company. I think they have a better ability to scale the bikes and services making PTON a buyout in my opinion. Who says the acquiring tech company won't pay them $5/share? Buyer's beware.
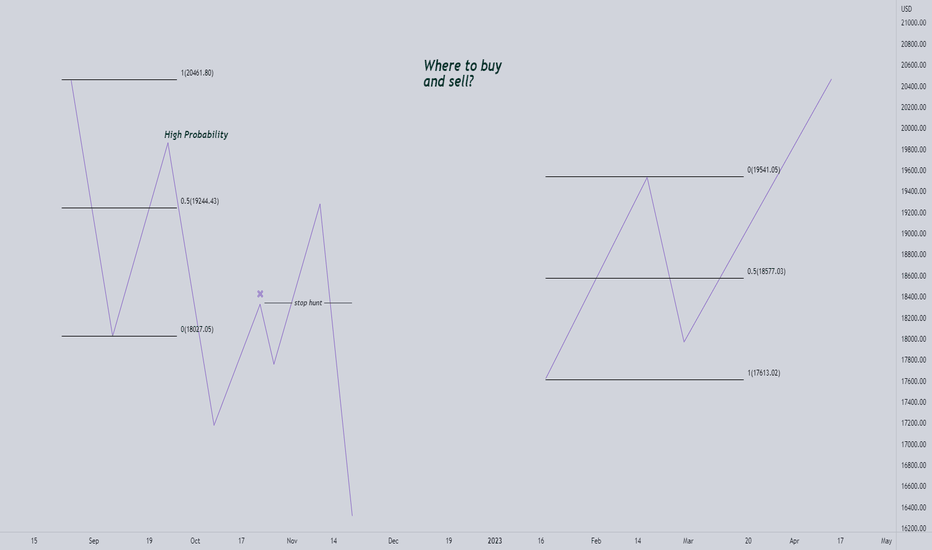
Where and when are our setups more probable?Setup probability drastically increases when we sell in premium (above 50% of a marked range) and buy in discount (below 50% of a marked range) . You are made to believe that 0.38 fib is magical and mesmerising since it repeats everywhere in nature and in human interactions but It's exactly where stop hunts actually occur. We want to engage from a different angle and follow the logic of price action. Institutions engage in a different way. If they want to achieve a higher high or a lower low that's going to happen from a premium or a discount almost all the time. Go see your desired chart and recognise the pattern and you will grasp a very important element of how price action really works
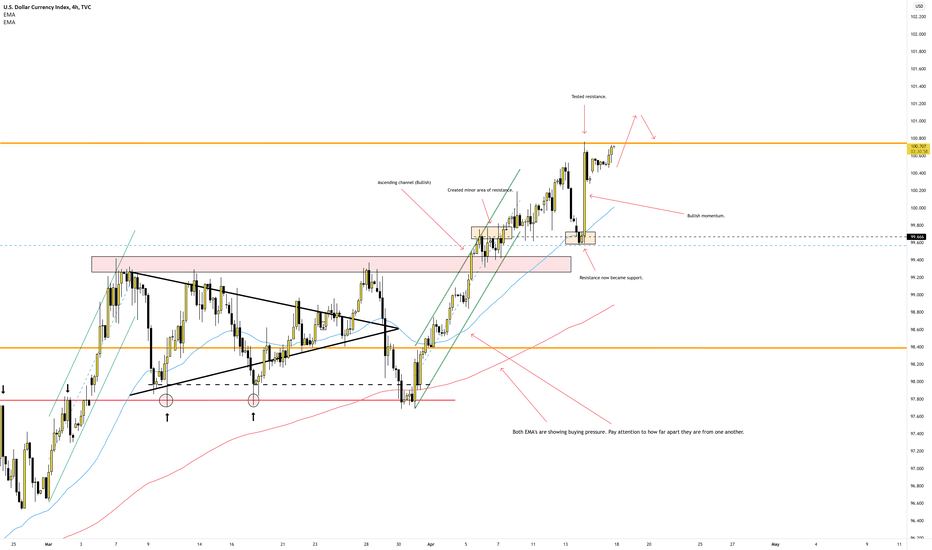
DXYThis is a quick breakdown on the DXY (Dollar index) and what I see for start of the trading week. Overall, I see the DXY bullish breaking 100.750 area and doing a simple break/retest on that previous high. You will also notice on the 4H chart that engulfing bullish candlestick that shows that the buyers are not done in this market followed up by the ascending channel that was created prior. Pairs to watch for this week; GBP/USD, USD/JPY, XAU/USD, & EUR/USD.
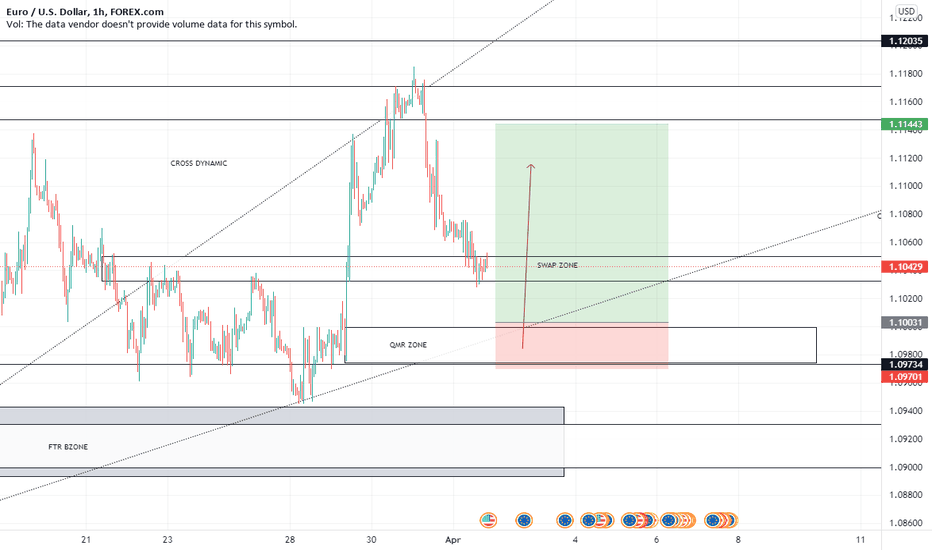
EURO POTENTIALLY WILL STRENGTHENCURRENCY EURUSD, will experience a price increase if it manages to penetrate the transition area to enter a new demand zone, namely the block order zone.
the best opportunity and opportunity is to wait for the price to enter the demand range area, followed by a price rejection.
