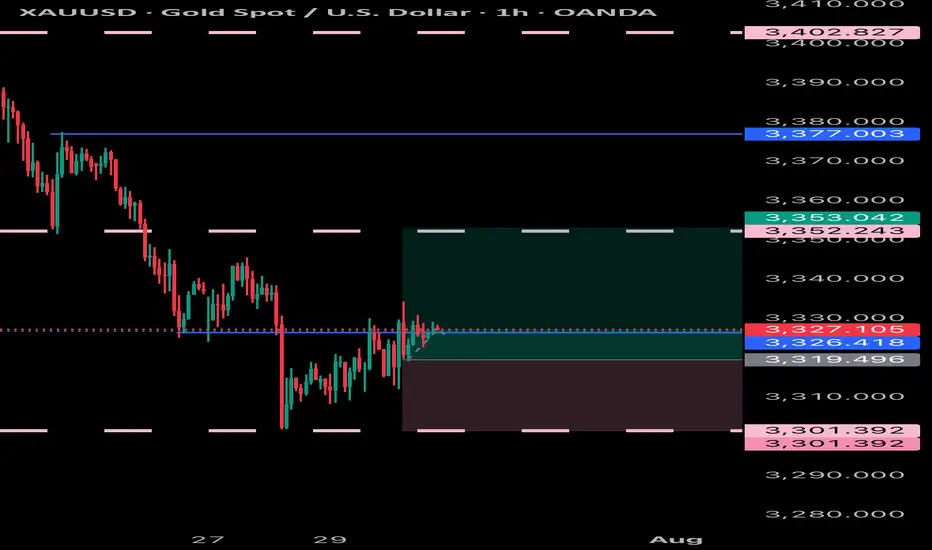
SUPER BUY GOLD XAUUSD Gold has ripped all levels of take profit and has gone up and gave us a small amount of drawdown with huge gains in return, simple trading price action and (M&Ws)
Buyopportunity
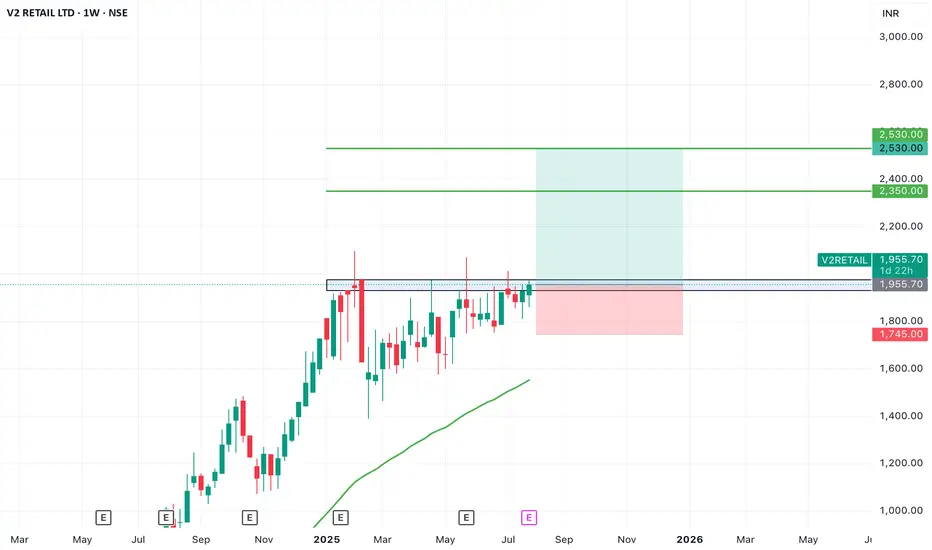
SWING IDEA - V2 RETAILV2 Retail , a small-cap value fashion retailer with a pan-India presence, is showing strong bullish momentum and a textbook swing trade setup backed by multiple breakout signals.
Reasons are listed below :
Breakout from a VCP (Volatility Contraction Pattern) – indicating accumulation and strength
Ascending triangle breakout – classic continuation pattern
Cleared major resistance zone, confirming bullish intent
Maintains a clear uptrend with higher highs and higher lows
Target - 2350 // 2530
Stoploss - weekly close below 1745
DISCLAIMER -
Decisions to buy, sell, hold or trade in securities, commodities and other investments involve risk and are best made based on the advice of qualified financial professionals. Any trading in securities or other investments involves a risk of substantial losses. The practice of "Day Trading" involves particularly high risks and can cause you to lose substantial sums of money. Before undertaking any trading program, you should consult a qualified financial professional. Please consider carefully whether such trading is suitable for you in light of your financial condition and ability to bear financial risks. Under no circumstances shall we be liable for any loss or damage you or anyone else incurs as a result of any trading or investment activity that you or anyone else engages in based on any information or material you receive through TradingView or our services.
@visionary.growth.insights
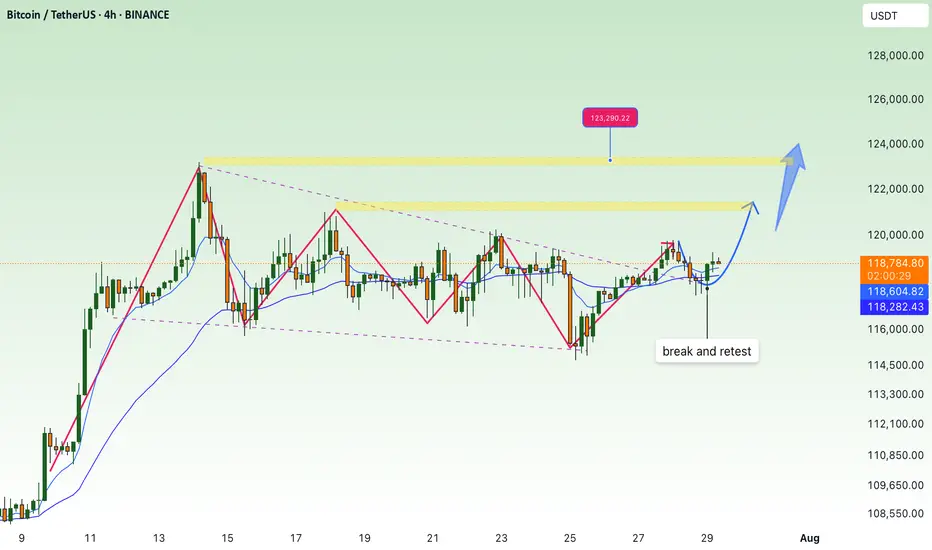
BITCOIN BULLYING Bitcoin hit take profit previously and now I will be looking at another buy within this trend and price action combined with patterns
GOLD GOLDEN XauUsd is now still respecting the trend and will keep holding expecting an even stronger push to the up side
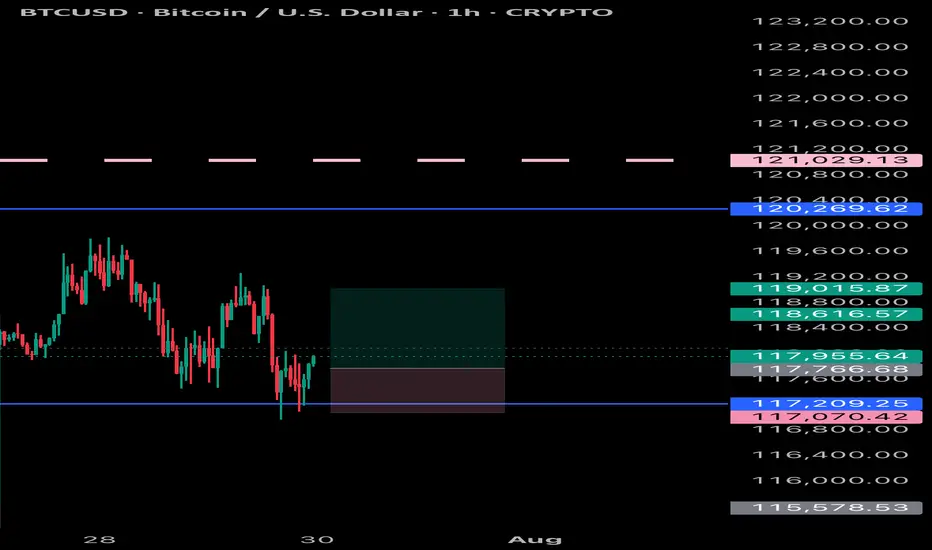
BTC Accumulation, Bullish Breakout Signs💎 BTC PLAN UPDATE
1. Key Chart Features:
Currently, the BTC/USD price is at $118,893.
The chart shows a strong upward trend recently, and we are seeing accumulation with short-term corrections.
2. Fibonacci Levels:
The Fibonacci retracement levels are drawn from the lowest point ($114,460) to the highest point ($119,809).
At the moment, the price is hovering near the 0.5 retracement level ($113,000), which is a key support level.
If the price holds above this level, a rebound is likely.
3. Trendlines and Price Patterns:
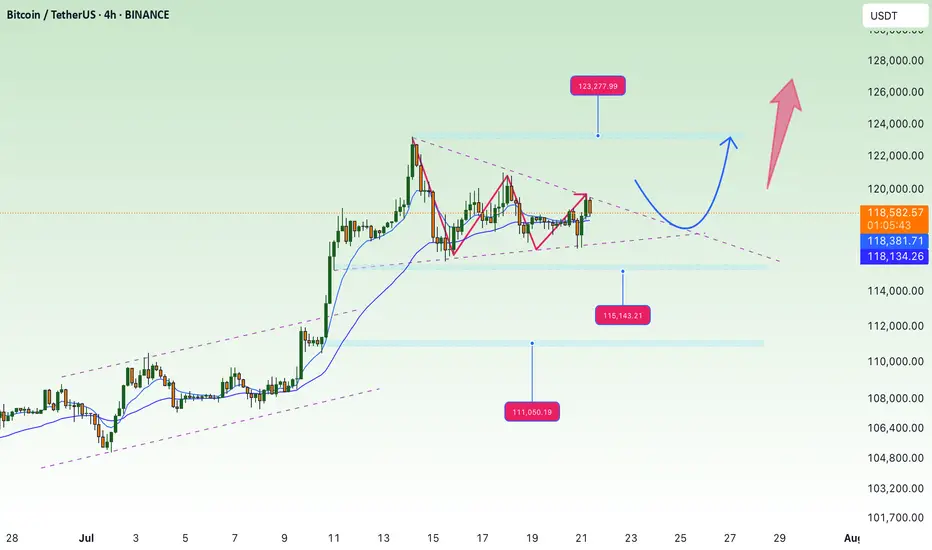
The trendlines (dashed blue lines) are indicating a descending triangle pattern, which could lead to a breakout if the price surpasses resistance levels.
A potential Head and Shoulders pattern might be forming, though it is not yet clear and needs confirmation by breaking key resistance.
4. Breakout and Retest Zone:
The breakout zone (red area) is around $119,000.
If the price breaks and holds above this level, we may see a continuation of the uptrend toward the next target around $122,792 (Fibonacci 1.618 level).
After the breakout, the price might retouch (retest) this support area before resuming the upward movement.
5. Technical Indicators:
• Moving Averages (MA):
• The red MA (long-term) is below the current price, indicating a strong uptrend.
• The yellow MA (medium-term) is near the current price, providing support for the uptrend if it holds.
• RSI Indicator:
The RSI has not yet reached overbought levels, suggesting that the market still has potential to rise without being overheated.
6. Conclusion:
If the price breaks above the $119,000 resistance and maintains that level, BTC/USD could continue its strong bullish trend, potentially targeting $122,792 or even $127,941.
Note: If the price fails to hold above $119,000 and drops back below, a pullback to the nearest support level at $114,460 may occur.
GOLD XAUUSD BUY We shall be looking to scalp a bit on the gold as it has been selling for a while now and can expect a reversal as nothing sells forever in the market, so can buy a dip and expect it to push a fair amount
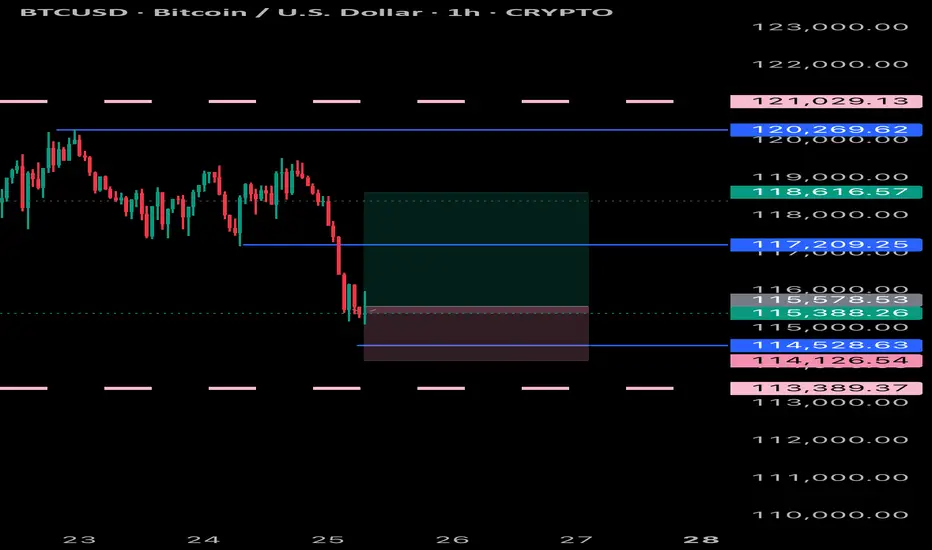
BTCUSD BUYING can expect a bullish move from bitcoin as it has dropped a fair amount and can extract a reversal to the up side due to being oversold
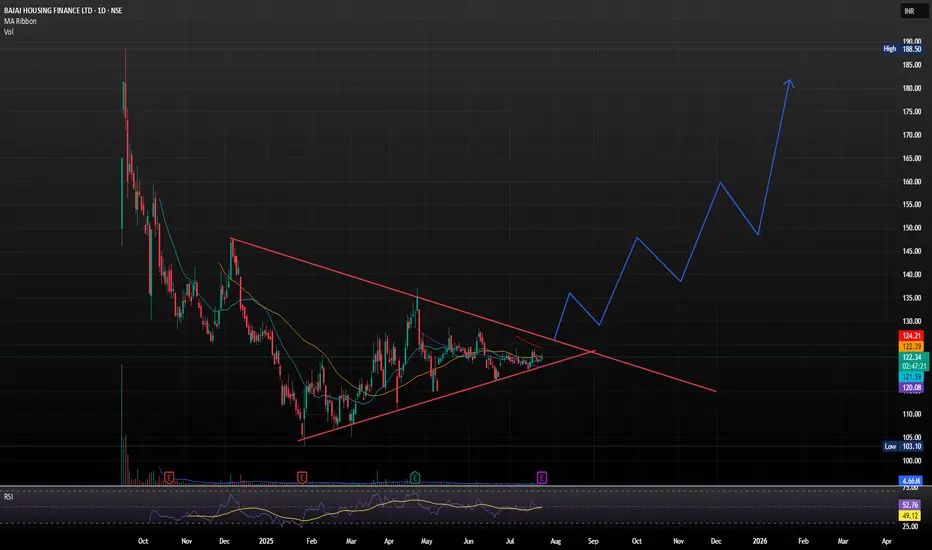
BAJAJ HOUSING FINANCE LTD GOOD TIME TO PICK IT Bajaj Housing Finance Ltd. (BHFL) is a prominent non-banking financial company (NBFC) in India, specializing in housing-related finance. It's a subsidiary of Bajaj Finance Ltd., and has been classified as an Upper-Layer NBFC by the RBI under its Scale-Based Regulations.
📊 Latest Financial Highlights (Q1 FY26 Preview)
- Assets Under Management (AUM): 1.2 lakh crore, up 24% YoY and 5% QoQ
- Loan Assets: 1.05 lakh crore, up 24.2% YoY
- Disbursements: 14,640 crore, up 22% YoY
- Net Profit (PAT): Expected to rise 19–21% YoY to 574–584 crore
- Net Interest Income (NII): Estimated to grow 24–28% YoY to 827–851 crore
- Net Interest Margin (NIM): Projected at ~3.2%, slightly compressed due to rate cuts
The company is well-positioned to benefit from the rising demand for housing loans, as more people seek to buy homes. With a focus on technology and customer service, BHFL is likely to enhance its operational efficiency, attracting more clients and growing its market share. As a result, the stock price of BHFL could rise, with steady growth by its expanding loan portfolio and strong brand recognition. In 2026, its share price target would be 253, as per our analysis.
SHORT TERM VIEW
entry - 119.50-123
stop loss - 117.60
target - 135-140
News mentions of Nuclear this & Uranium that, whats the Macro?This is a look into the macro developments happening currently in UROY.
This is strictly a TA look into the big picture. We zoom out to Timeframes bigger than 1W.
At times zooming in to check (3 Day, 5 Day, maybe 1D) for potential swing trades.
I tend to look into things like price action, indicators, volume and other data to sway probabilities of where an asset may go and determine best opportunities of supply and demand zones based on my interpretations.
So jumping right in this is a look into price action on the 1 Month timeframe.
Looks to me like a massive macro falling wedge.
But theres massive volume. So thats a little contradicting.
In anycase always look for confirmation of breakouts.
On another negative note: this is only 5 years of data. Would have loved more price data.
Also note potential bullish cross of STOCH RSI, a momentum indicator. Still need confirmation though. If blue and orange line above 20 level on STOCH at monthly candle close.
COuld be a positive.
But key is to watch for confluence of many signs and or indicators.
I will be keeping my eyes on this.
Look for more posts as things develop on UROY.
DISCLAIMER: This is not financial advice, i am not a financial advisor. The thoughts expressed in the posts are my opinion and for educational purposes. Do not use my ideas for the basis of your trading strategy, make sure to work out your own strategy and when trading always spend majority of your time on risk management strategy.

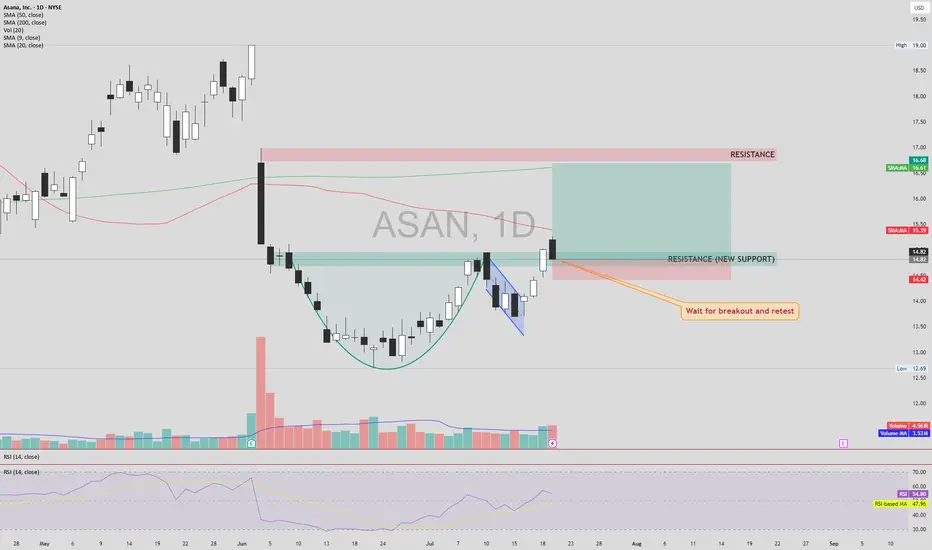
ASAN – Cup & Handle Breakout SetupASAN NYSE:ASAN has formed a classic Cup & Handle pattern and has broken above the neckline, turning previous resistance into new support. However, the price is still trading below both the 50 and 200 SMAs, which calls for cautious confirmation.
📌 Entry: Wait for a confirmed retest of the breakout level (new support) with healthy volume.
🔒 Stop Loss (SL): Just below the newly established support zone, in case of a failed retest.
🎯 Take Profit (TP):
First TP: Next visible resistance zone above.
If this level breaks and holds (confirmed by retest),
Next TP: The large gap overhead could potentially be filled.
This setup provides a strong risk-reward structure if confirmation aligns with volume and momentum. Avoid early entry without retest.
⚠️ DYOR (Do Your Own Research) – This is not financial advice.
accumulate, continue to aim for new ATH💎 Update Plan BTC (July 21)
Notable news about BTC
CEO of Charles Schwab, Rick Wurster, said the company plans to deploy Bitcoin and Ethereum transactions for customers.
This company aims to compete with Coinbase, where customers buy BTC.
This development takes place after the progress of cryptocurrencies when President Donald Trump signs the Genius bill into law.
In an interview on Friday, the CEO of Charles Schwab, Rick Wurster, said the company plans to launch Bitcoin (BTC) and Ethereum (ETH) to compete with Coinbase cryptocurrencies. The move took place after President Donald Trump signed the Genius bill, officially confirming the first cryptocurrency law in the United States.
Technical analysis angle
🟠 Main trend:
BTC is sideway accumulated in the amplitude of 117,000 - 122,000 after a sharp increase.
The chart shows the descending triangular model - a potential sign for Breakout.
🔍 important areas:
Resist:
122,000 - 122,700: Strong resistance area, fibonacci mold 1.0.
130,600 - 131,100: The expected area if Breakout is successful (Fibonacci extension 1.618).
Support:
116,000: Support close, coincide with EMA 200.
111,100: The support area is stronger if the current support breaks.
✅ Scenario 1 - Rise:
If the price turns from supporting 116k → Test the resistance area of 122k.
If the 122K break is definitive, the next goal is 130k - 131k.
❌ Scenario 2 - Discount:
If the 116k area is lost, the possibility of falling will fall more deeply at 111k.
This is also the strong EMA area Fibo 0.382 of the previous wave.
Please follow the channel to receive the latest and continuous updates on XauUSD, currency and BTC
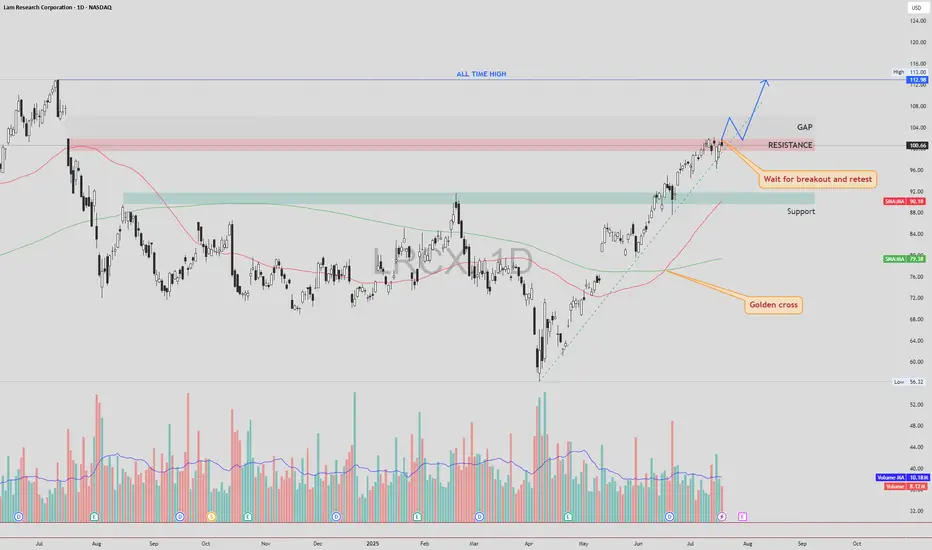
LRCX – Gap Fill First, Then Retest and Potential Move to ATHLRCX NASDAQ:LRCX is currently trading just below a key resistance zone, supported by strong bullish momentum and a confirmed Golden Cross formation.
🔍 Technical Scenario
There is a high probability that price may fill the gap above without retesting the current resistance. After the gap is filled, we could see a pullback to retest the previously untouched resistance zone (now acting as support).
If this retest is successful and holds, the structure may support a continuation move toward the All-Time High (ATH) zone.
📌 Trade Plan
Entry: Avoid chasing the breakout candle. Wait for a gap fill, followed by a clean retest of the broken resistance zone. Enter on confirmation of support holding.
Stop Loss: Place SL just below the retest zone or under the most recent higher low (structure-based stop).
Target 1: Gap fill completion
Target 2 : All-Time High (ATH), if retest confirms
⚠️ Risk Management
The gap-fill rally without retest can be volatile. Patience is key — let the price come back and confirm the breakout zone as new support.
As always, DYOR and manage your position sizing based on your risk profile.
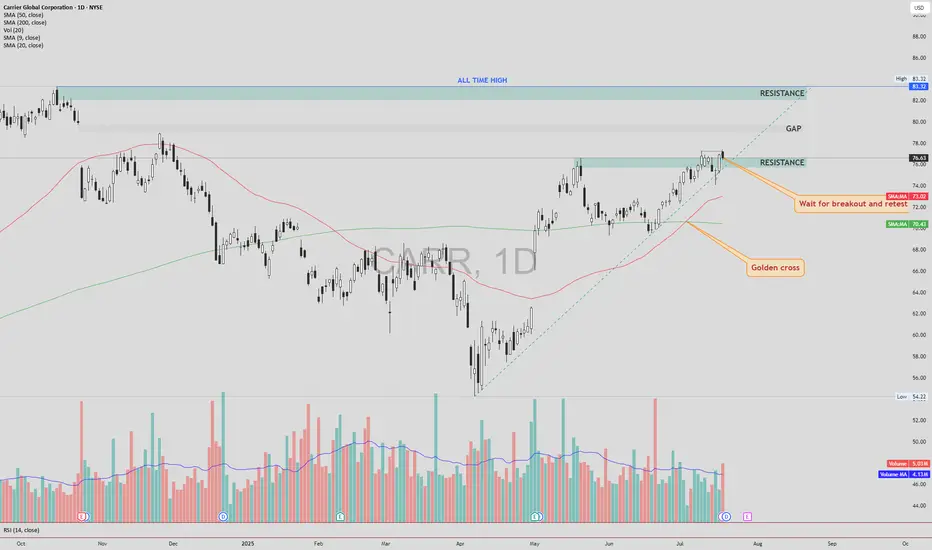
CARR – Bullish Breakout Toward Gap and ATHCarrier Global NYSE:CARR has closed above a key resistance zone near $76.50–$77.00 , indicating a possible breakout setup in progress. This move comes after a Golden Cross , where the 50 SMA crossed above the 200 SMA — a long-term bullish signal.
🔍 Technical Highlights:
✅ Golden Cross: Bullish momentum building.
✅ Breakout level: Price broke above horizontal resistance zone.
🔄 Next step: Wait for a potential retest of the breakout zone.
🔊 High volume on the breakout and retest would increase the strength and reliability of the setup.
🎯 Target Levels:
First Target (TP1): ~$80.00 — near the top of the existing gap.
Second Target (TP2): ~$83.32 — the current All-Time High (ATH).
🛡 Trade Plan:
Entry idea: After a clean retest of the breakout level with supportive volume.
Stop-loss: Below the retest zone or under 50 SMA (~$72-74 area).
Invalidation: If price falls back below resistance on high volume.
Conclusion:
CARR shows a strong breakout setup after a Golden Cross. A confirmed retest with volume could open the door toward the gap fill and new all-time highs.
DYOR – This is not financial advice.
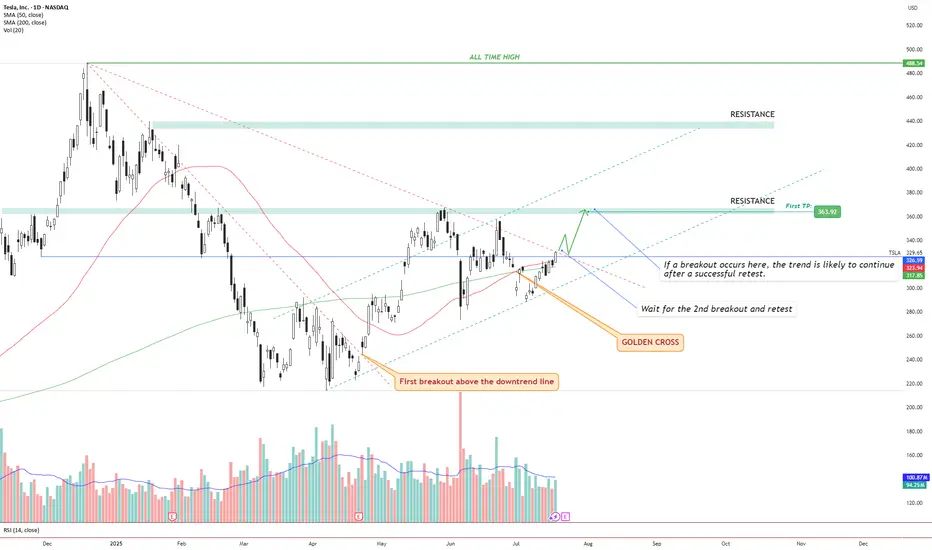
TSLA – Golden Cross + Dual Breakout Structure Targeting $363 andIdea Text:
Tesla NASDAQ:TSLA has recently printed a powerful Golden Cross , where the 50 SMA has crossed above the 200 SMA — signaling a potential long-term bullish shift in trend.
But price action shows more:
We’re observing a dual-breakout structure, where the first breakout above the long-term downtrend line has already occurred (see orange label), and the price is now approaching a critical horizontal resistance zone.
Let’s break it down step-by-step:
🔸 Step 1: Golden Cross
The 50 SMA crossed above 200 SMA — a classic signal for trend reversal. This often attracts institutional interest, especially if followed by breakout confirmation.
🔸 Step 2: First Breakout (Already Confirmed)
Price broke above the descending trendline, retested it, and maintained higher structure. This breakout initiated a shift in market sentiment from bearish to neutral-bullish.
🔸 Step 3: Second Breakout (Setup Forming)
Price is now testing horizontal resistance around $330–$335 zone. This zone also coincides with dynamic resistance from prior failed swing attempts. A successful breakout above this level, followed by a clean retest, can serve as confirmation for a bullish continuation.
🔸 Step 4: Target Setting
🎯 First TP is set at $363.92, a well-defined resistance level. If the breakout holds, next potential targets may develop around key zones such as $395 and $440, depending on price strength and continuation.
🔸 Risk Management
✅ Ideal entry after retest of breakout above ~$335.
❌ Stop-loss below the breakout level or below 50 SMA (~$315 area), depending on entry style.
🔄 Monitor volume: breakout without volume = weak move.
Conclusion:
We are watching a classic price action + moving average confluence setup. Golden Cross, breakout + retest structure, clean resistance level, and defined targets all align.
This setup is valid only with confirmation. No breakout = no trade.
⚠️ Not financial advice. DYOR.
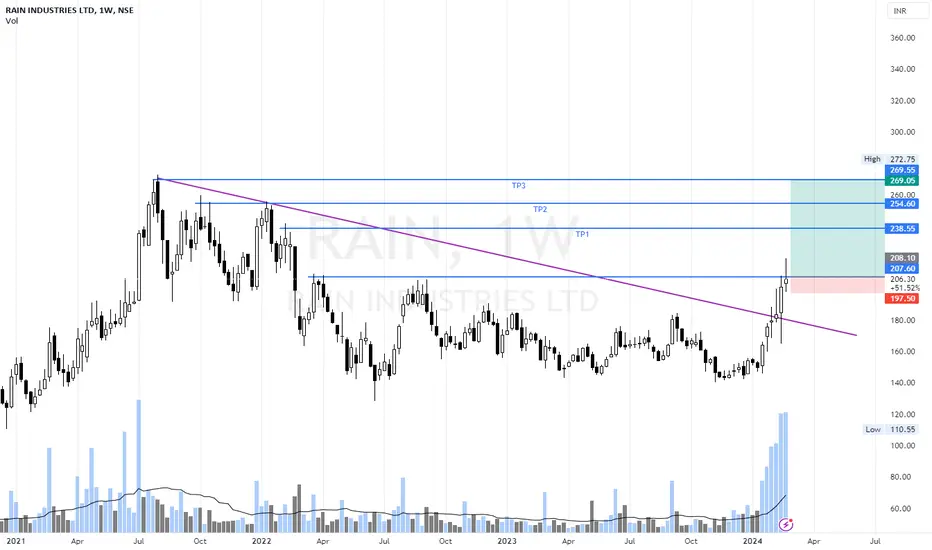
RAIN Industries Swing IdeaRain Industries has given Multiyear breaks out with spike in volume we can expect a good upside movement in the stock.
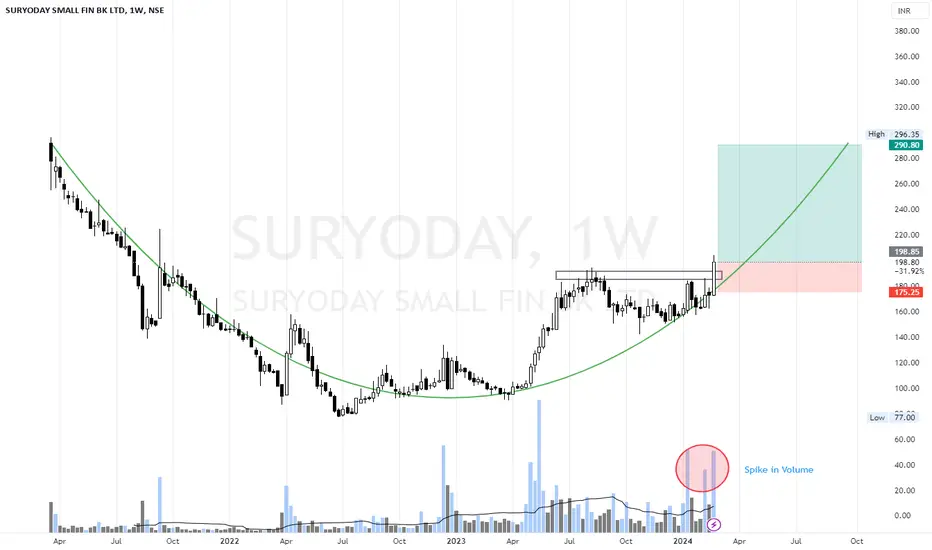
Suryoday Bullish long Term Buy IdeaAfter consolidation of Monts Finally Suryodaya has given a breakout and we can see the Volume is also on higher side, Since the Listing of the stock it was in downward direction, and from past year Stock is now in its bullish Run We can see a good upward move.
Disclaimer: I am not SEBI Registered; this is not a recommendation. Analysis shared for educational purpose only.
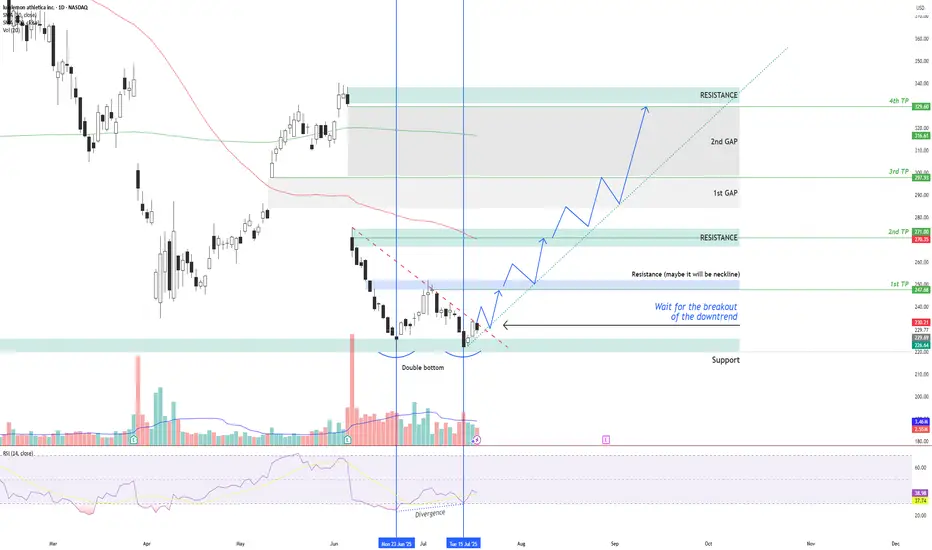
LULU – Double Bottom + RSI Divergence: Multi-Target Setup After LULU NASDAQ:LULU is showing signs of a potential bullish reversal after forming a double bottom structure around the $220 support zone , along with a bullish divergence on the RSI indicator.
Two vertical lines highlight the divergence: while price made a lower low, RSI formed a higher low – indicating a possible momentum shift in favor of buyers.
Currently, price is moving just below a descending trendline, which has been acting as dynamic resistance. The first condition for a long setup is a confirmed breakout above this trendline followed by a successful retest. If that happens, an entry can be considered .
📌 Entry Plan:
Entry: After a breakout and retest of the descending trendline.
1st TP: ~$247 — This level coincides with a local resistance zone, which may act as a neckline of the double bottom.
If price breaks above $247 and retests, it confirms bullish continuation.
📈 Target Structure:
2nd TP: ~$271 — next major resistance zone.
3rd TP: ~$297 — aligns with the first major gap zone.
4th TP: ~$329 — final gap resistance from previous sell-off levels.
This structure allows for scaling into the trade in stages — each breakout and retest offers a new confirmation and extension to the next target zone.
Volume analysis, price action, and RSI momentum all support the probability of a trend reversal — but confirmation is key.
Not financial advice. Always conduct your own research and risk management.
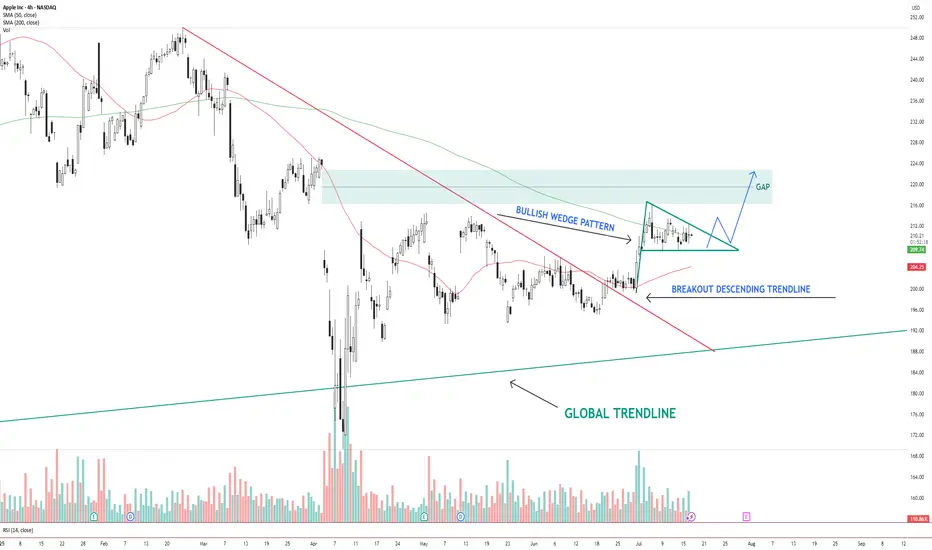
AAPL – Bullish Wedge Breakout Setup Toward Gap FillAAPL NASDAQ:AAPL has broken out of a descending trendline and is now consolidating inside a bullish wedge pattern . Price is holding above the 200 SMA and hovering near the 50 SMA.
The structure suggests a potential breakout above the wedge, with a clear gap area between $216–$224 acting as the next upside target.
Key levels:
Support: $206 (wedge base / 50 SMA)
Resistance: $216–$224 (gap zone)
Trend structure: Bullish consolidation after breakout
A clean breakout from the wedge with volume could trigger a continuation move toward the gap zone.
📌 Watching for confirmation and potential entry on a breakout + retest.
This is not financial advice. Always do your own research.
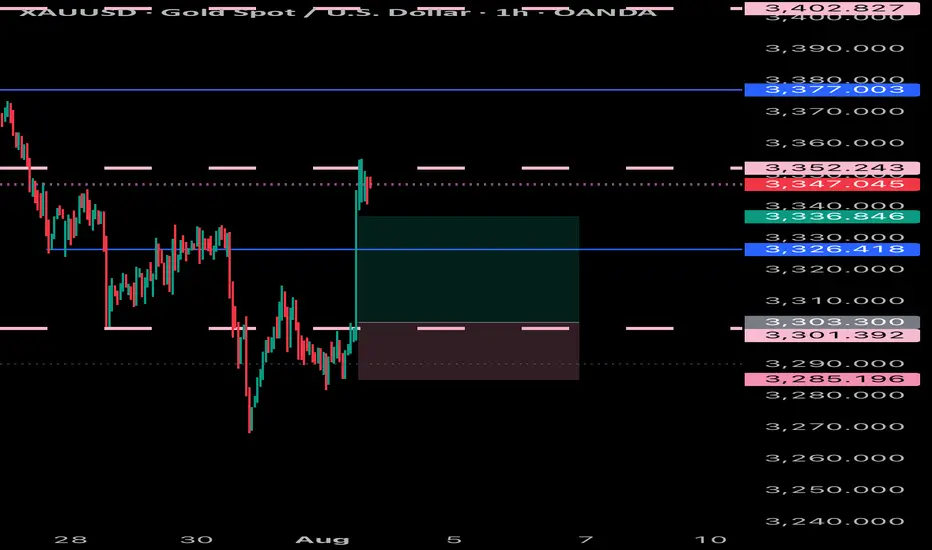
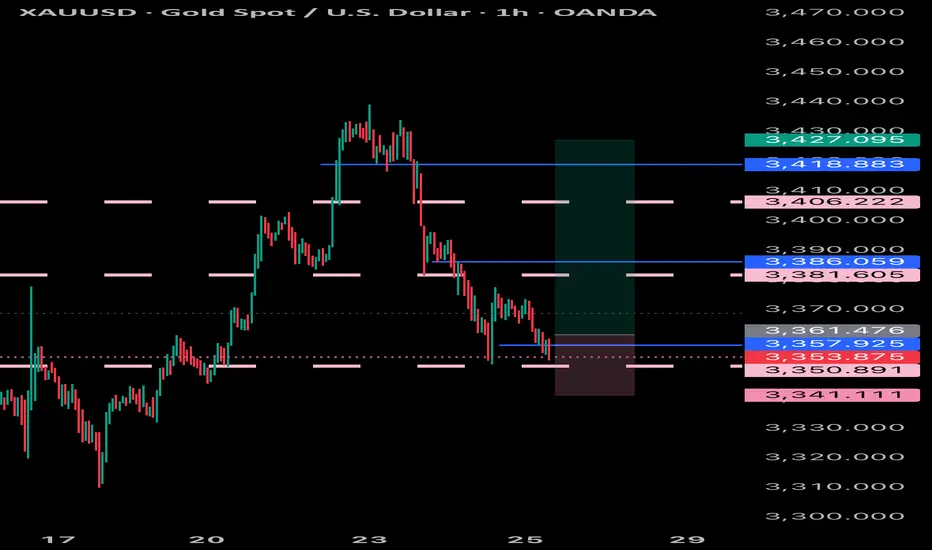
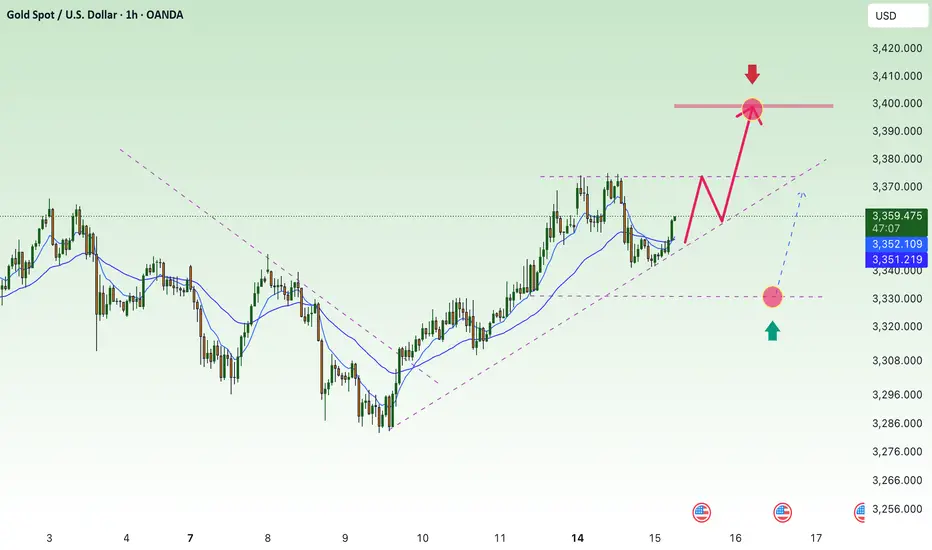
uptrend, heading towards 3400⭐️GOLDEN INFORMATION:
Gold prices (XAU/USD) climb toward $3,350 in early Asian trading on Tuesday, supported by renewed safe-haven demand after US President Donald Trump threatened sweeping 100% tariffs on Russia. Traders now shift focus to the upcoming US Consumer Price Index (CPI) report, which could offer further cues for the Federal Reserve’s policy outlook.
Late Monday, Trump warned that unless Russian President Vladimir Putin agrees to a peace deal to end the Ukraine conflict within 50 days, the US will impose 100% tariffs on Russian goods. The proposed sanctions, described as secondary tariffs, lack detailed clarification but have already fueled market anxiety. Heightened geopolitical tensions are likely to sustain near-term demand for gold as investors seek safety in the yellow metal
⭐️Personal comments NOVA:
Maintaining buying pressure above 3350, gold price in an uptrend, paying attention to CPI results to assess the inflation level of the world's number 1 economy
⭐️SET UP GOLD PRICE:
🔥SELL GOLD zone: 3400- 3402 SL 3407
TP1: $3390
TP2: $3380
TP3: $3370
🔥BUY GOLD zone: $3330-$3328 SL $3323
TP1: $3340
TP2: $3350
TP3: $3360
⭐️Technical analysis:
Based on technical indicators EMA 34, EMA89 and support resistance areas to set up a reasonable BUY order.
⭐️NOTE:
Note: Nova wishes traders to manage their capital well
- take the number of lots that match your capital
- Takeprofit equal to 4-6% of capital account
- Stoplose equal to 2-3% of capital account
Bullish trade idea for EUR/JPYBullish trade idea for EUR/JPY:
Buy near 171.15
Take Profit at 171.78
Stop Loss below 171.10
Risk Management is important

Insiders are selling Roblox ! Heres the levels you need to knowIn this video I lay out a solid plan for a move to the downside for Roblox after a 100% move to the upside since April of this year .
I demonstrate why I believe we will take a 30% retracement and provide confluent evidence to support this theory.
There are some fundamental reasons that I also did include alongside the technical analysis which is not my regular style but important given the context.
Tools used in the video 0.382 Fib , Standard Fib pull, Trend based fib and pivots .

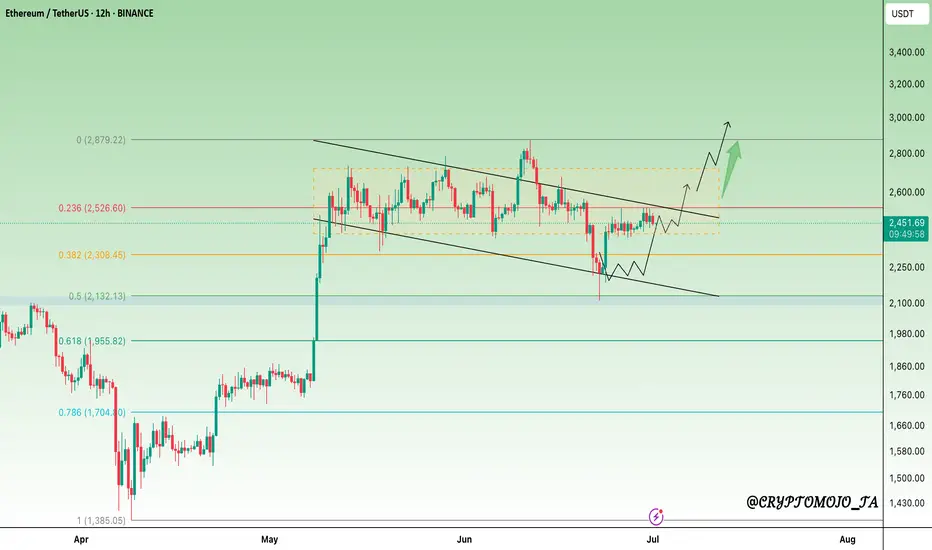
Q3 Could Be Big for #ETH, Breakout Watch ON#ETH bounced exactly from the 0.5 level of Fib Retracement, as expected.
Now it appears to be gearing up for its next breakout move!
After weeks of chopping inside a falling channel, ETH is showing signs of strength. It's reclaiming key levels and slowly pushing toward the breakout zone near $2,520.
A breakout above this resistance could trigger a sharp move toward $2,880 and beyond.
However, bulls need to hold the $2,300 zone, a drop below might delay the pump.
Structure is bullish, just needs confirmation.
IMO, Q3 could be massive for ETH.
Like & retweet for more updates.
#Ethereum
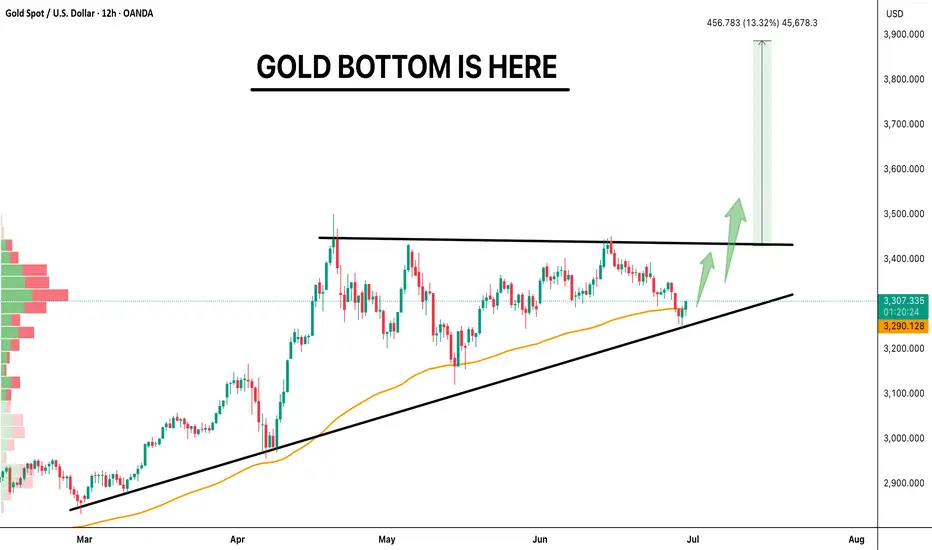
GOLD Bouncing from Trendline, Breakout Ahead?GOLD BOTTOM IS HERE 🔥
Gold has taken support from the rising trendline and is now close to breaking a key resistance. The chart is showing an ascending triangle, which usually means a big move is coming.
If price breaks above the resistance, we might see a strong rally of 13% or more.
The setup looks positive as long as the support stays strong.
Looks like Gold is ready to shine again!
Retweet if you're bullish.
Like and follow for more updates!
#GOLD TVC:XAU