Called The Top on ETH! In this post I'm going cover the TA and indicators I used to call the short on Ethereum!
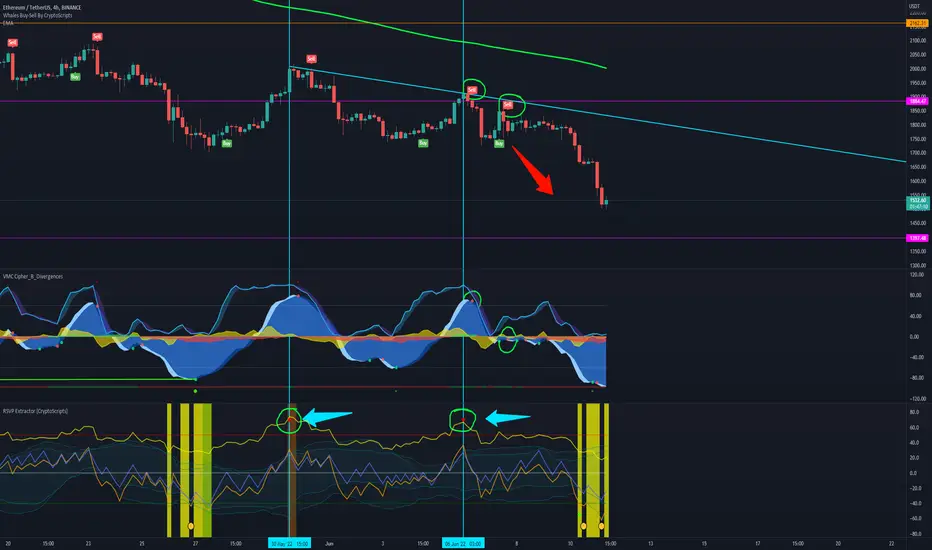
The current indicators I'm using on the 4h chart are the Whales buy-sell indicator (mine), VMC Cipher B (free), and RSVP Extractor (mine). Looking at our major support/resistance levels, we can see there is Daily resistance on ETH at 2160, as well as Weekly resistance at 1884 and Weekly support at 1397.
The first major short opportunity I saw was the Red Diamond indication on my RSVP Extractor (outlined by the first vertical blue line). I saw we were below the 200 EMA so I was only going to look for shorting opportunities and it played out perfectly (shorting ETH at 1980). Next I received another Red Diamond on June 6th and shorted again at 1900. Finally, there were two more shorting opportunities which came with the combination of the Whales buy-sell indicator "Sell" signal and the VMC "red dot" combined, which I love to use together. That was outlined by the green circles I drew. This also coincided with the trend line resistance I drew as well (teal diagonal line).
The next major support I'm looking at is 1397 on ETH. We may or may not get there but that will be your best R/R position for a long. There's currently an oversold "Moon" signal on the RSVP Extractor so we could have short-term relief but I'm not holding my breath.
If you have any questions about the indicators I use or my technical analysis, please comment below or send me a message! Thanks for reading :)
Buysellindicator
STEPN GMT short Price Targets and Stop LossGMT/USDT short
Entry Range: $1.22 - 1.50
Price Target 1: $1.06
Price Target 2: $0.86
Price Target 3: $0.70
Stop Loss: $1.84
last chart

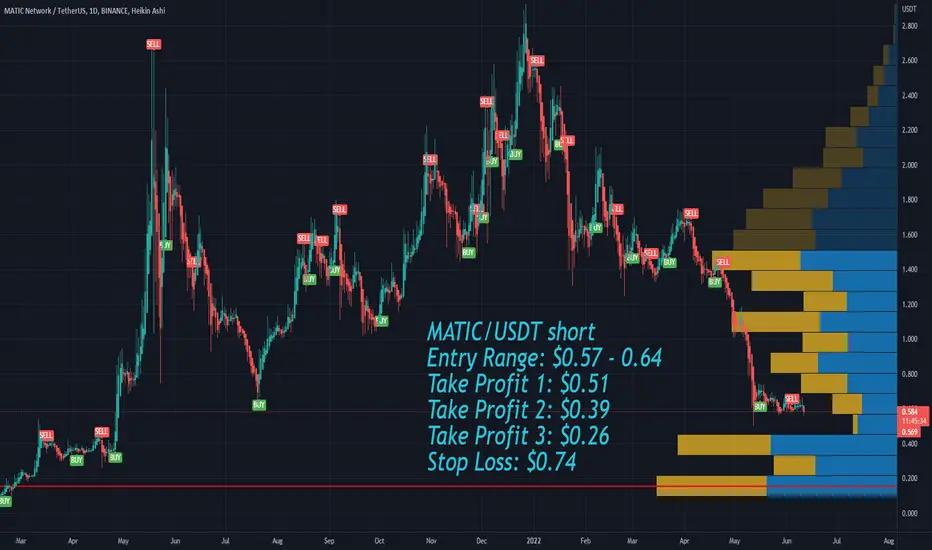
Polygon MATIC short Entry Range, Take Profit and Stop LossMATIC/USDT short
Entry Range: $0.57 - 0.64
Take Profit 1: $0.51
Take Profit 2: $0.39
Take Profit 3: $0.26
Stop Loss: $0.74
Polkadot DOT Entry Range, Take Profits and Stop LossDOT/USDT
Entry Range: $8.77 - 10.13
Price Target 1: $11
Price Target 2: $14.35
Price Target 3: $15.28
Stop Loss: $7.27

Chiliz CHZ Entry Range, Take Profits and Stop LossCHZ/USDT short
Entry Range: $0.11 - 0.13
Take Profit 1: $0.10
Take Profit 2: $0.085
Take Profit 3: $0.060
Stop Loss: $0.15

XRP Entry Range, Take Profits and Stop LossXRP/USDT
Entry Range: $0.38 - 0.43
Take Profit 1: $0.54
Take Profit 2: $0.61
Take Profit 3: $0.78
Stop Loss: $0.32

Ethereum Classic ETC Price Targets and Stop LossETC/USDT short
Entry Range: $46 - 50.15
Price Target 1: $39.90
Price Target 2: $32.80
Price Target 3: $25.90
Stop Loss: $53.30

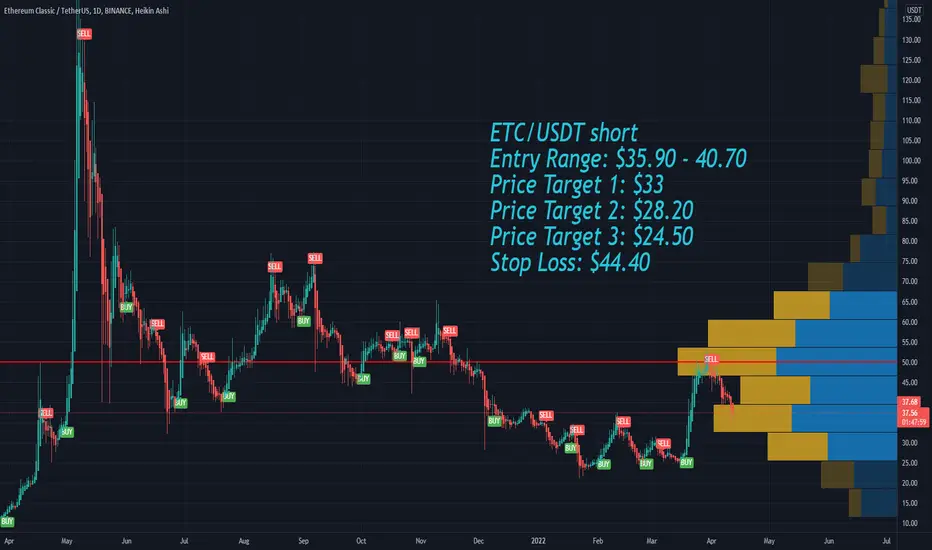
Ethereum Classic ETC short Price Targets and Stop LossETC/USDT short
Entry Range: $35.90 - 40.70
Price Target 1: $33
Price Target 2: $28.20
Price Target 3: $24.50
Stop Loss: $44.40
Previews short chart
GALA Entry Range, Take Profits and Stop LossGALA/USDT
Entry Range: $0.073 - 0.10
Take Profit 1: $0.12
Take Profit 2: $0.15
Take Profit 3: $0.18
Stop Loss: $1.0.057

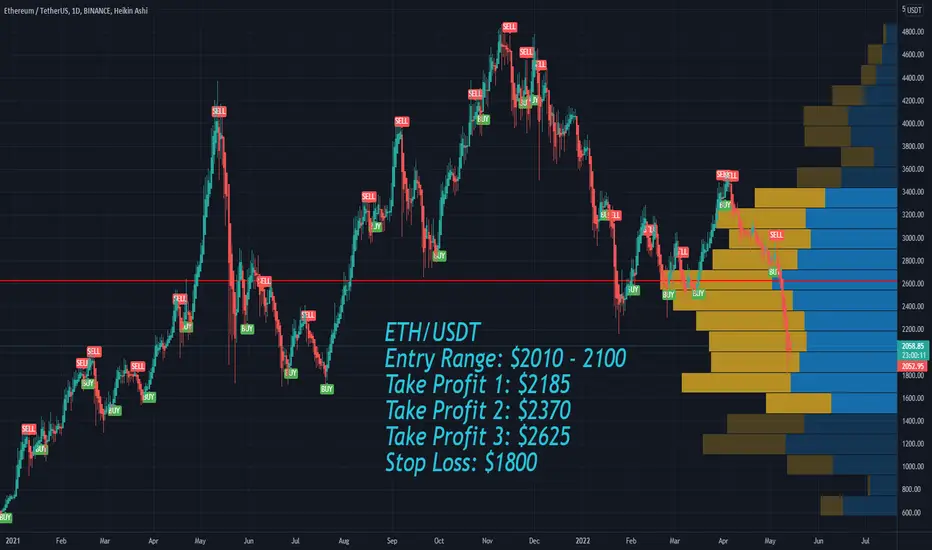
ETH Ethereum Price Targets and Stop LossETH/USDT
Entry Range: $2010 - 2100
Take Profit 1: $2185
Take Profit 2: $2370
Take Profit 3: $2625
Stop Loss: $1800
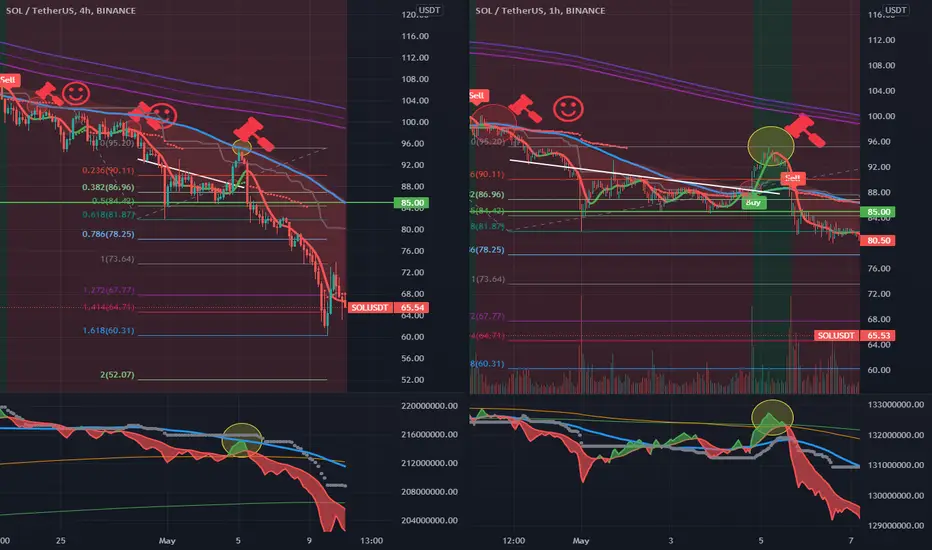
How to Profit using the 4 hour and 1 hour CombinedCombining the 4 Hour and the 1 Hour chart to catch more profitable trades.
Usually, the 1 hour chart will give you a better entry and can mean the difference between catching a very profitable trade vs. missing the trade waiting for the 4 hour trendline.
Often in strong downward moves, especially on the 4 hour, price may not retrace back to the trendline until a few days.
It may be frustrating to see a trade you knew was going to drop on the 4 hour, to be left alone.
In these cases, you can switch down to the 1 hour timeframe, to catch the move quicker and get a better entry. Not just that, but you can take profits on the way down and re-short at the Blue trendline on the 1 hour.
It's important if you are doing this, to make sure you draw in resistance trendlines (see the white line), to see if you can detect a breakout. This may lead to a "BUY" signal on the 1 hour chart.
HOWEVER, we do not always take trades purely based on "BUY" or "SELL" signals - we must analyse market structure on multiple different timeframes to get a better picture of what the market is doing.
So here, on the 1 hour chart, we saw price reject the thick green line at $85 and an upward push with rising bull volume towards the blue trendline again.
OK, the volume isn't massive - but it's rising after rejecting support.
At this point, closing your short would be wise.
If for whatever reason you hadn't noticed this, you would close your short on the breakout on the 1 hour chart. This could happen if you are not looking at the chart for a couple of days, so if you are watching the chart regularly, you can avoid these potential losses.
So now that we have a breakout on the 1 hour chart, we first have to look at the 4 hour chart to see what is happening.
Now check the 4 Yellow circles on the chart. Look where price is - at the 4 hour Blue trendline. This is finally our opportunity to get an amazing low risk, high reward SHORT entry.
Check out the Yellow circle on the Volume indicator at the bottom of the 4 hour - Since the volume is UNDERNEATH the Blue trendline, and so is price. This confirms again how low risk high reward this SHORT entry is.
Even though the 1 hour Chart says BUY, this is only mid term, and we must remember that higher time frames play a big part in what happens.
So after we had shorted the 4 hour blue trendline, we could tell a potential BART pattern happening, with distribution at higher levels than previously.
After this, within 4-5 days, SOL had crashed from $95-$60 (around 30%). Not bad eh?
And how exactly do we predict where the bottom of this move is?
Well the best way, is to use the Fibonacci Expansion tool.
We first clicked at the top of the candle where we first got our "SELL" signal. As price retreated down, we saw a big clear wick signalling a local bottom around $81.87. From here, price eventually rose up to $95.20 where we shorted.
Now that we have 3 different levels, we can plot our Fibonnaci Expansion Tool to set our targets:
1) 0.786 ($78.25)
2) 1 ($73.64)
3) 1.272 ($67.77)
4) 1.414 ($64.71)
and finally, the likely end of the move full stop...
the great 1.618, in this case, $60.31 ON THE NOSE :)
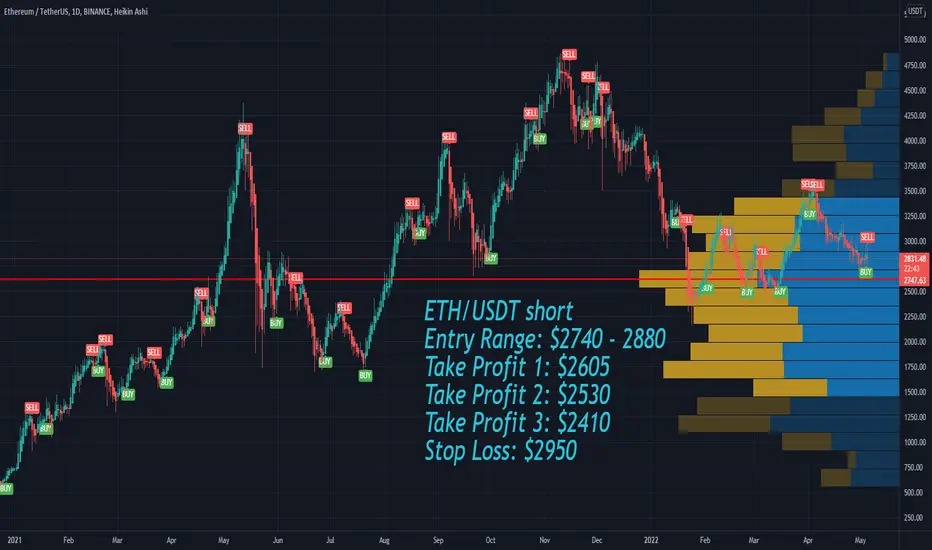
Ethereum ETH short Price Targets and Stop LossETH/USDT short
Entry Range: $2740 - 2880
Take Profit 1: $2605
Take Profit 2: $2530
Take Profit 3: $2410
Stop Loss: $2950
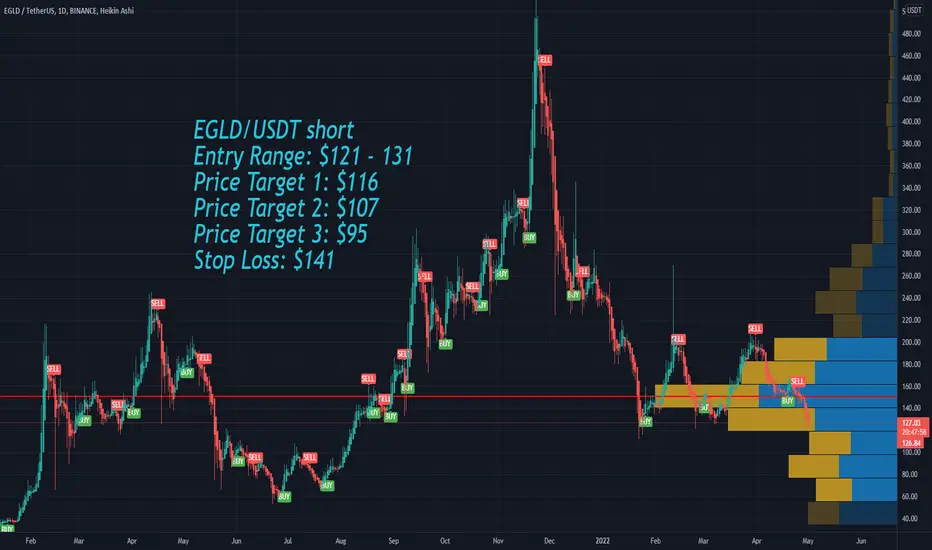
Elrond EGLD short Price Targets and Stop LossEGLD/USDT short
Entry Range: $121 - 131
Price Target 1: $116
Price Target 2: $107
Price Target 3: $95
Stop Loss: $141
BNB short Price Targets and Stop LossBNB/USDT short
Entry Range: $370 - 390
Price Target 1: $363
Price Target 2: $349
Price Target 3: $325
Stop Loss: $420
last BNB chart

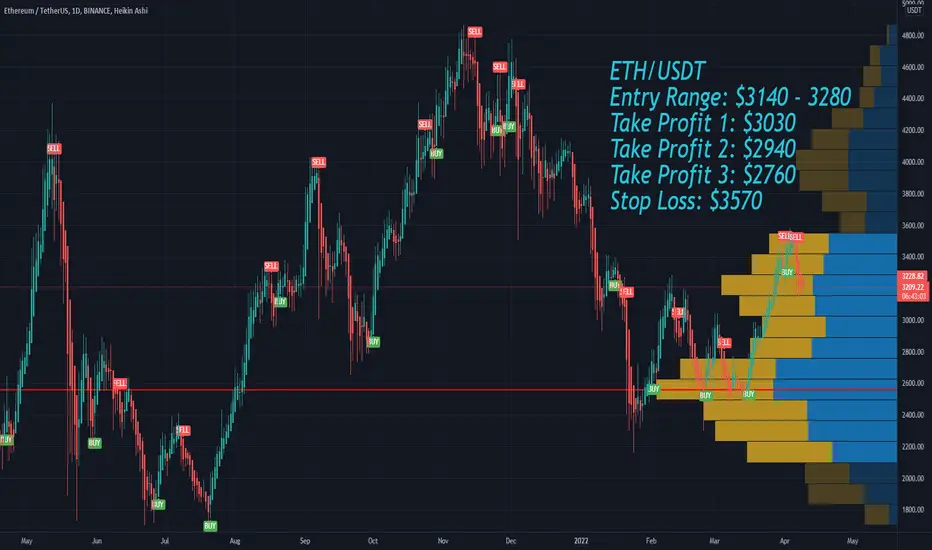
Ethereum ETH short Price Targets and Stop LossETH/USDT short
Entry Range: $3140 - 3280
Take Profit 1: $3030
Take Profit 2: $2940
Take Profit 3: $2760
Stop Loss: $3570
last eth chart
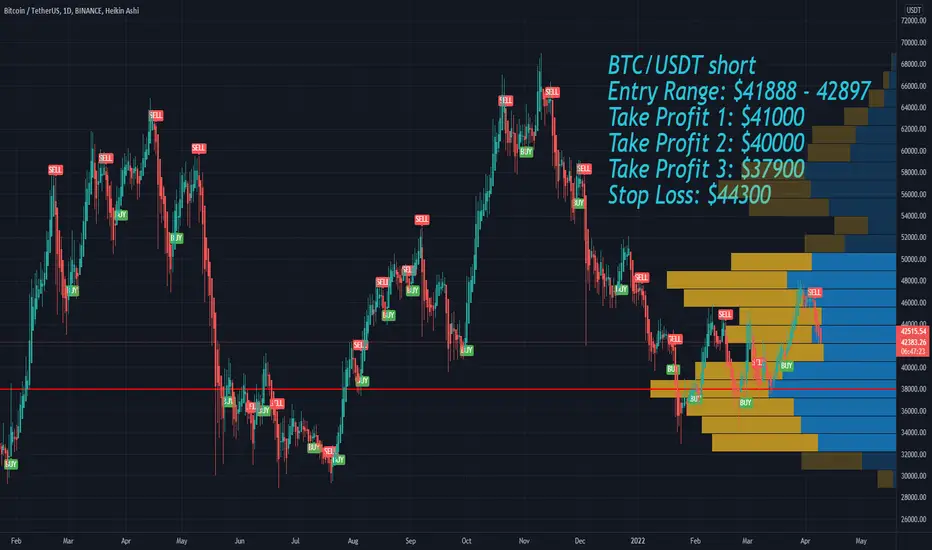
BTC/USDT short Price Targets and Stop LossBTC/USDT short
Entry Range: $41888 - 42897
Take Profit 1: $41000
Take Profit 2: $40000
Take Profit 3: $37900
Stop Loss: $44300
last short
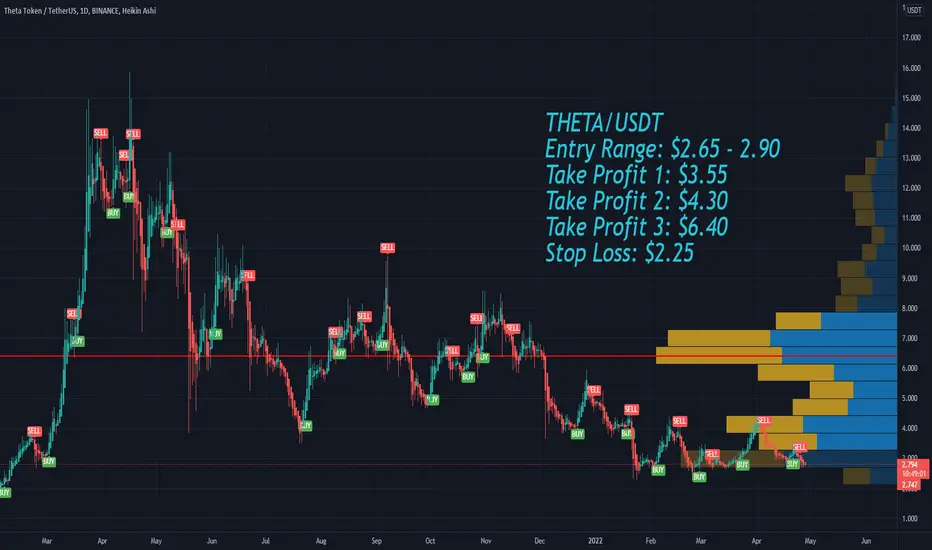
THETA Price Targets and Stop LossTHETA/USDT
Entry Range: $2.65 - 2.90
Take Profit 1: $3.55
Take Profit 2: $4.30
Take Profit 3: $6.40
Stop Loss: $2.25
UMA Price Targets and Stop LossUMA/USDT
Entry Range: $5.20 - 5.90
Price Target 1: $7.68
Price Target 2: $10.95
Price Target 3: $13.05
Stop Loss: $4.70

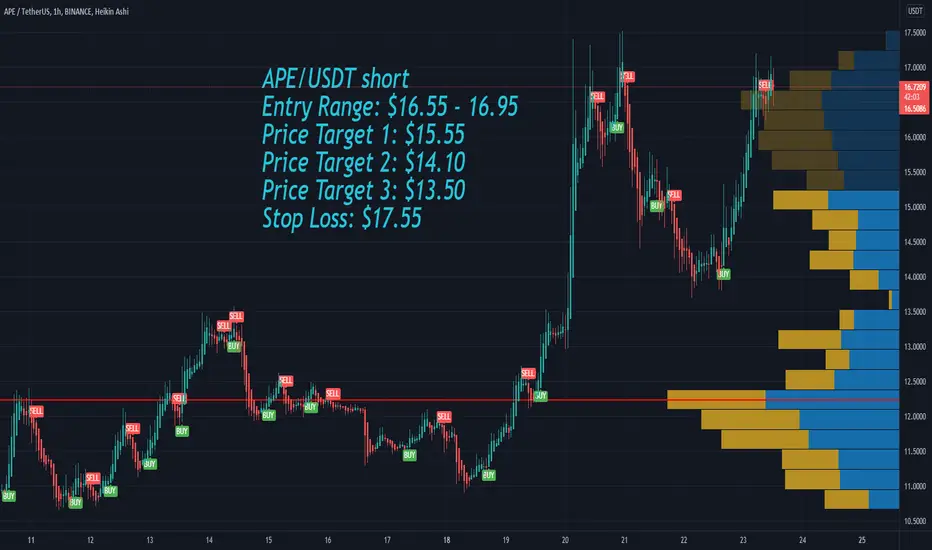
ApeCoin APE short Price Targets and Stop LossAPE/USDT short
Entry Range: $16.55 - 16.95
Price Target 1: $15.55
Price Target 2: $14.10
Price Target 3: $13.50
Stop Loss: $17.55
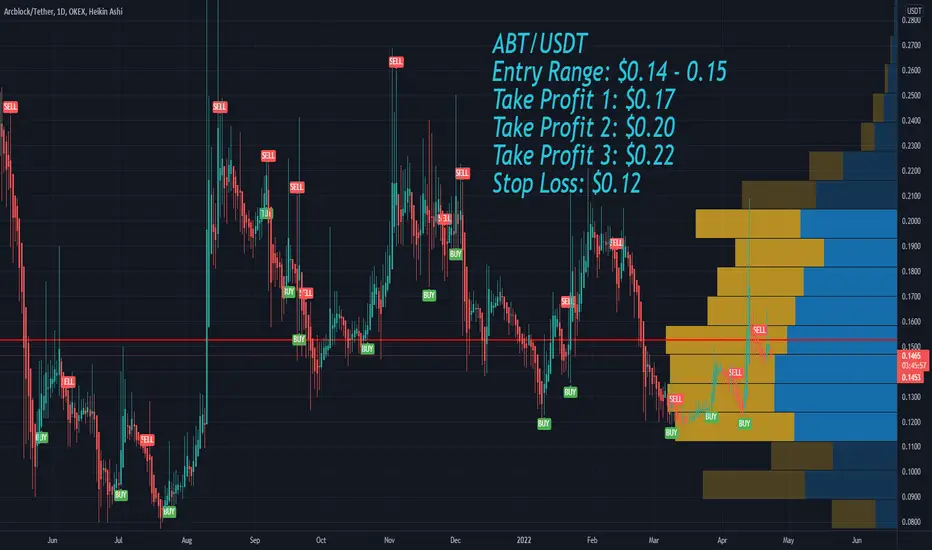
Arcblock ABT Price Targets and Stop LossABT/USDT
Entry Range: $0.14 - 0.15
Take Profit 1: $0.17
Take Profit 2: $0.20
Take Profit 3: $0.22
Stop Loss: $0.12
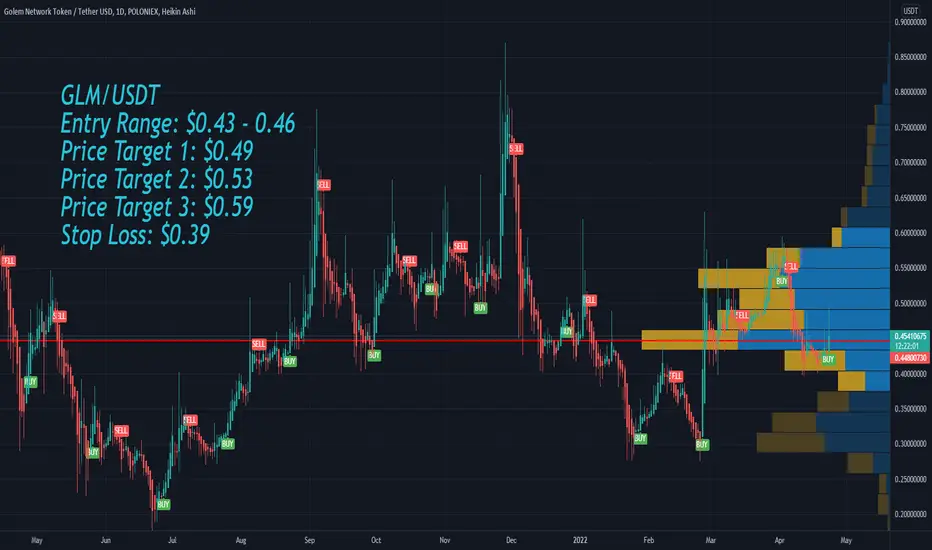
Golem GLM Price Targets and Stop LossGLM/USDT
Entry Range: $0.43 - 0.46
Price Target 1: $0.49
Price Target 2: $0.53
Price Target 3: $0.59
Stop Loss: $0.39
CELO Price Targets and Stop LossCELO/USDT
Entry Range: $2.90 - 3.10
Take Profit 1: $3.40
Take Profit 2: $3.80
Take Profit 3: $4.90
Stop Loss: $2.70

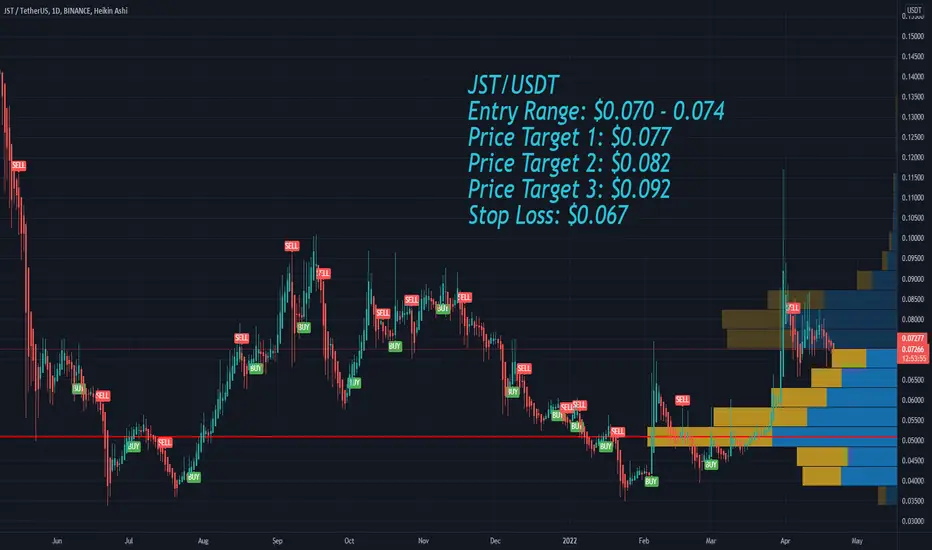
JUST JST Price Targets and Stop LossJST/USDT
Entry Range: $0.070 - 0.074
Price Target 1: $0.077
Price Target 2: $0.082
Price Target 3: $0.092
Stop Loss: $0.067
first entry
sell signal