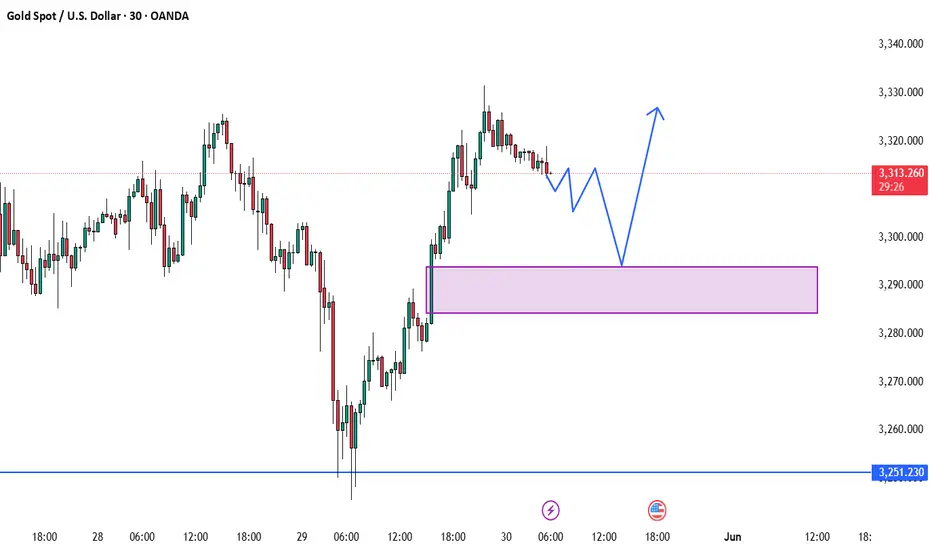
BEST GOLD M30 BUY SETUP FOR TODAY📉 Gold is currently showing signs of a potential pullback towards the key demand zone around 3,290–3,285 marked in purple. This area has previously acted as a strong support and could trigger a bullish reversal if price reacts positively here. 🟪 Once the price enters this zone and forms a bullish confirmation (like a rejection wick or bullish engulfing candle), we could see a strong upward move targeting 3,320+ 📈. Traders should stay alert for buying opportunities from this zone and avoid chasing the price before a clear confirmation! 🎯⚡
Buysellsignal
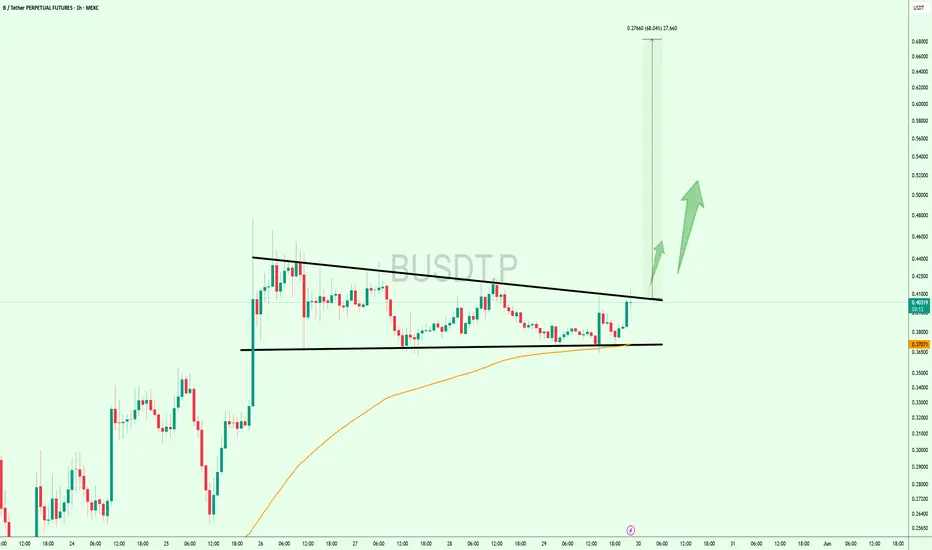
$BUSDT Ready to Explode? Breakout Could Send It Flying#BUSDT is demonstrating strong potential for a pennant breakout.
A successful breakout could trigger a +60% bullish rally in the coming days. 🚀
#Altseason2025
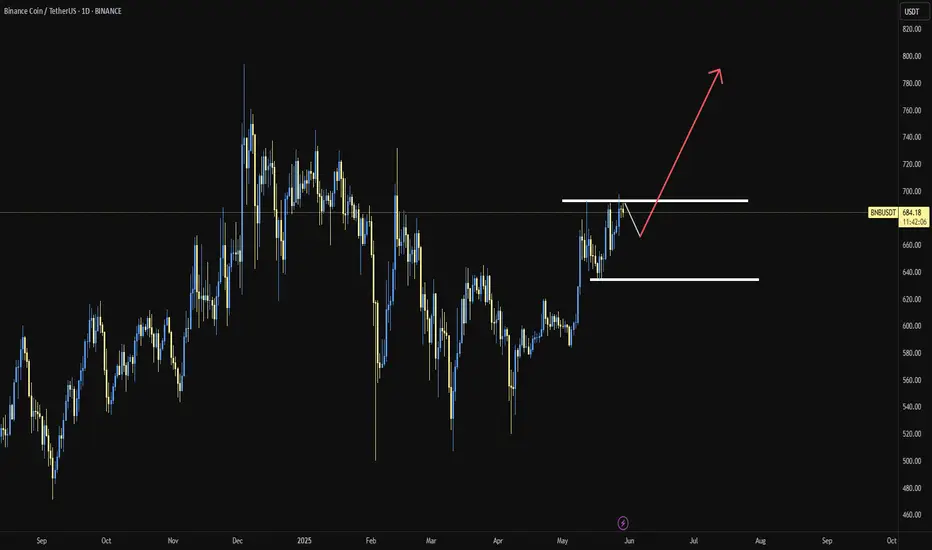
BNB/USDT"Binance, like Ethereum, is in its best condition right now. Do you think it will go up or down?"
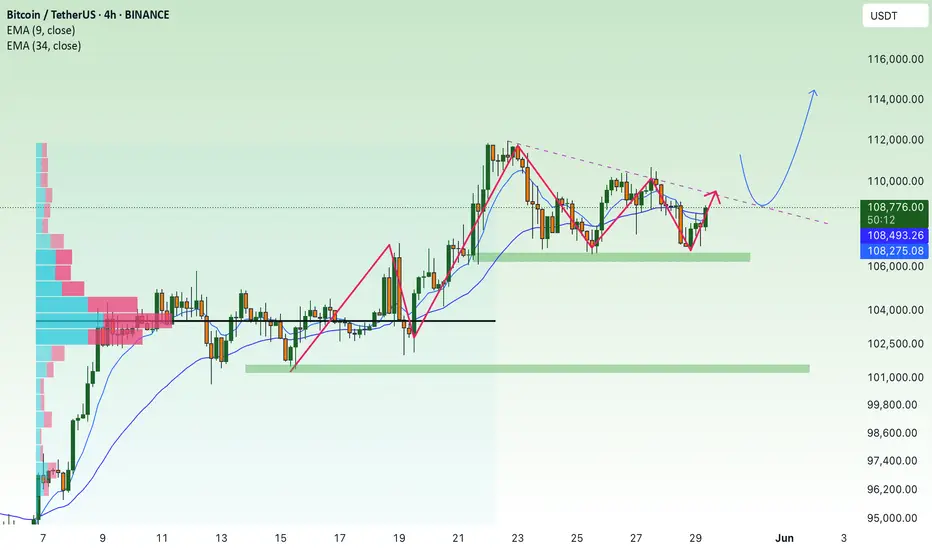
BTC breakout soon and return to ATH💎 Update Plan BTC (May 29)
Notable news about BTC:
The overall cryptocurrency market capitalization has remained relatively stable over the past 24 hours, hovering near the $3.42 trillion level. Digital assets appear largely indifferent to the recent rally in equities, as gains in traditional markets are driven by corporate earnings and tariff-related developments rather than shifts in monetary policy or liquidity conditions. Meanwhile, the US Dollar is strengthening for a third consecutive session, adding further pressure.
Bitcoin (BTC) has pulled back from the upper end of its recent trading range near $110,000, settling closer to the $107,000 mark. This pause near previous highs has helped ease short-term market overheating. As institutional participation in Bitcoin deepens, its price behavior is increasingly mirroring that of traditional financial instruments like equities and commodities—marked by more tempered momentum and fewer fear-driven surges.
Technical analysis angle
It is still a 107k bumper area that brings profits to Buyer. But the worrying thing here is that the vertices of BTC are lower.
We will have two scenarios for BTC:
) First within the next 1 week, the organizers still go in this flag model and gradually narrow towards the top. If the price line follows this model, it will be negative for BTC and investors
) Secondly: BTC price will breakout area 109k, the target will go straight to 113k-115k and lower boundary if Breakout area 107k will return to 102k-100k
🔥BTC 4H is currently in the adjustment phase, this time will cause a lot of traders, Future - Margin to lose money, this rhythm will last long
At this time, whether new or old, should spend more time to practice, load more knowledge about the PTKT, as well as find knowledge posts at the channel ..., to strengthen the solid foundation, as well as avoid losing money at this time offline
==> Comments for trend reference. Wishing investors successfully trading
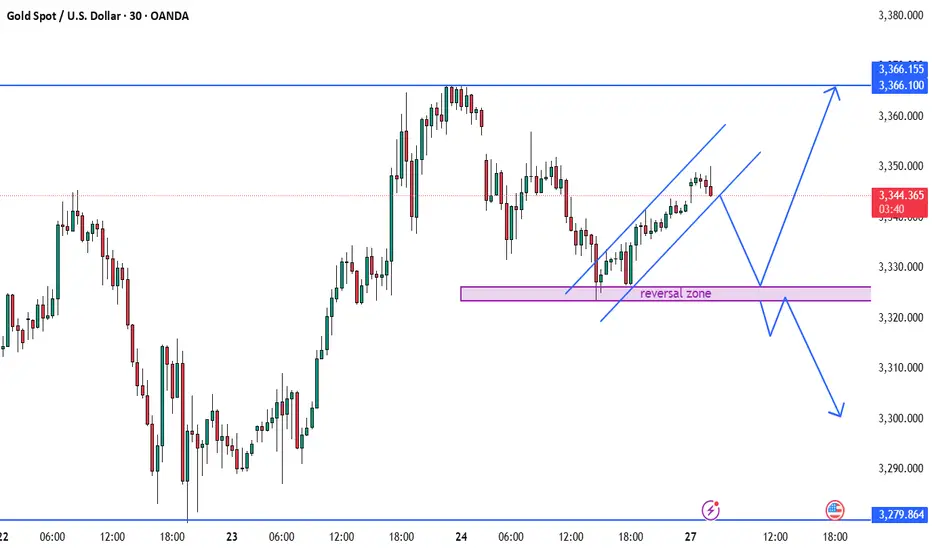
BEST XAUUSD M3 BUY AND SELL SETUP FOR TODAY 📊✨ Gold (XAU/USD) Technical Outlook – 30-Min Chart ✨📉
Price is currently trading within a rising channel after a bounce from the marked reversal zone 💜, suggesting a short-term bullish trend 📈. However, the chart outlines two key scenarios: if price breaks out upward, we may see a move towards the 3,366 resistance zone 🔼. Conversely, if the channel fails and price breaks downward, a retest of the reversal zone could trigger a deeper bearish move 📉, potentially targeting the 3,300 area or lower. Traders should watch for confirmation at key levels and react accordingly — not predict impulsively. 🧠⚖️📍
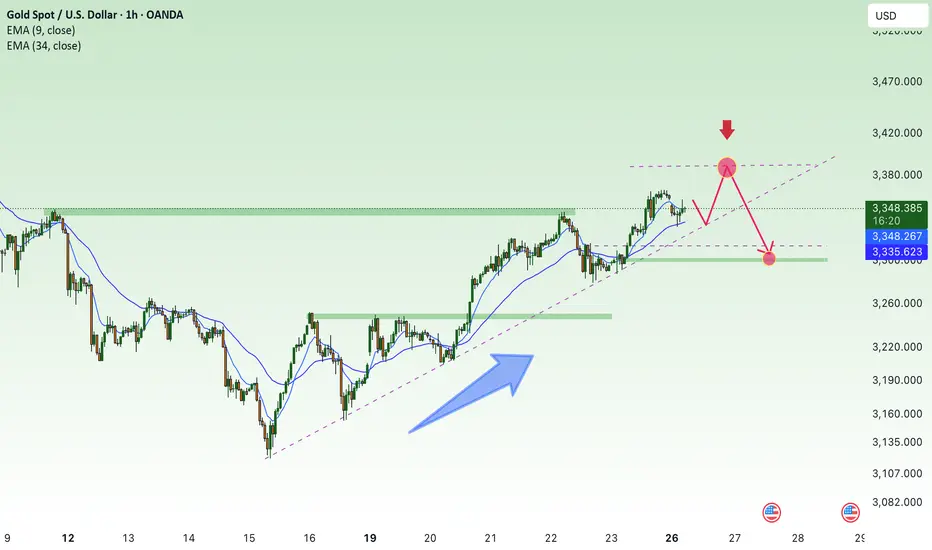
XAUUAD UPDATE 28 - 5 - 2025This is a technical analysis chart for Gold (CFDs on Gold, USD/OZ) on a 45-minute timeframe from TradingView. Here's a breakdown of the key elements:
Chart Summary (as of May 28, 2025):
Current Price: $3,321.640 (up +0.64%)
Chart Timeframe: 45 minutes
Highlighted Zones:
Resistance Zone (Top Yellow Area): Around 3,355–3,360
Support Zones (Middle to Bottom Yellow Areas):
~3,280
~3,240
~3,200
Chart Annotations:
Blue Arrows: Indicate a projected price movement:
1. Short-Term Bullish Move: A rise toward the resistance area near 3,360.
2. Followed by Bearish Reversal: A sharp drop expected after reaching the resistance zone, possibly down to the 3,280 or lower support zone.
Volume Bars: Shown at the bottom, giving insight into trade activity. A noticeable spike in volume supports the prior price drop and recovery pattern.
Interpretation:
The analyst expects a bullish continuation in the short term, reaching the resistance zone around 3,360.
After testing resistance, a rejection and bearish reversal is anticipated, targeting the support zone around 3,280 or even 3,240.
This strategy appears to rely on support/resistance trading and reversal patterns.
Would you like an assessment of the likelihood of this move or suggestions for entry/exit points?

$EGLD Gearing Up for Next Leg – Bull Flag in PlayCRYPTOCAP:EGLD is forming a clean bull flag on the 6H chart after a strong move up.
Price is holding the trendline, and a breakout above $19.7 could target $27 that’s a 47% potential move.
This setup appears solid, incorporating confluence from Fib levels and volume zones.
Eyes on this breakout that could be explosive.
Flag breakout incoming?
DYOR, NFA.
#EGLDUSDT #Altseason2025

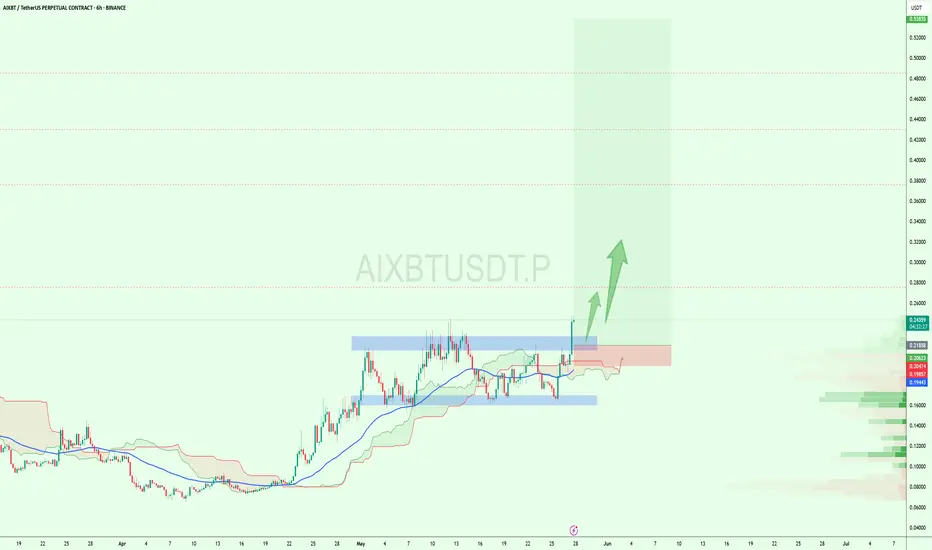
$AXIBT Breakout Confirmed – 2x Potential Ahead?$AXIBT just broke above a key accumulation zone after days of consolidation.🚀
Strong volume, bullish Ichimoku support, and a clean breakout above resistance suggest this could be the start of a major move.
If this rally continues, we could see a sharp push toward the $0.50+ zone, nearly 2x from here.
Reclaiming and holding above the $0.22–$0.24 zone is crucial for confirmation.
Eyes on this one.
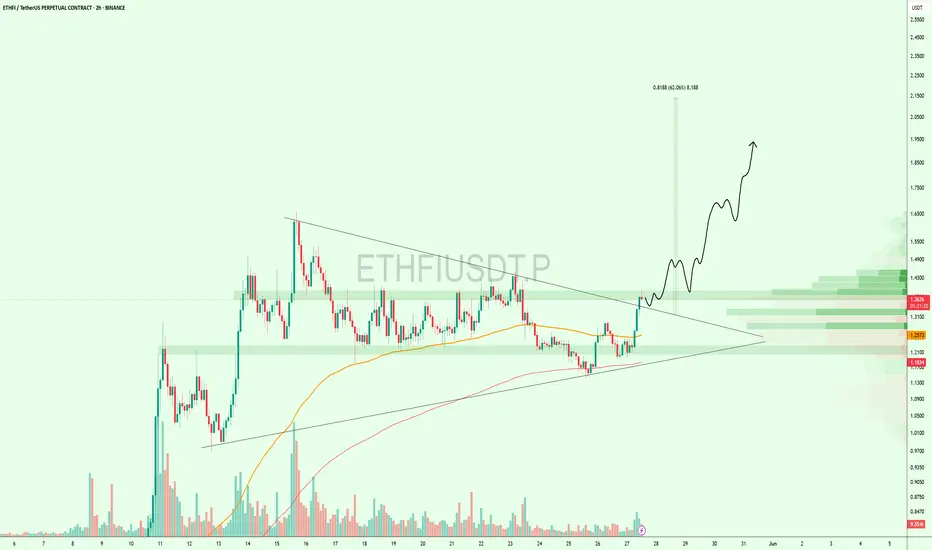
Symmetrical Triangle Breaks – $ETHFI Targets $2+CRYPTOCAP:ETHFI just broke out of a strong symmetrical triangle on the 2H chart finally escaping a long consolidation phase.
Price surged above resistance and reclaimed key EMAs, showing clear bullish momentum. If this breakout sustains, the next leg could take us toward $2.00+
Risk is tight below $1.27 the breakout zone and previous resistance-turned-support.
This move could be the start of something big.
Watch closely!
S SentinelOne Options Ahead of EarningsIf you haven`t bought S before the recent rally:
Now analyzing the options chain and the chart patterns of S SentinelOne prior to the earnings report this week,
I would consider purchasing the 20usd strike price Calls with
an expiration date of 2025-9-19,
for a premium of approximately $2.50.
If these options prove to be profitable prior to the earnings release, I would sell at least half of them.

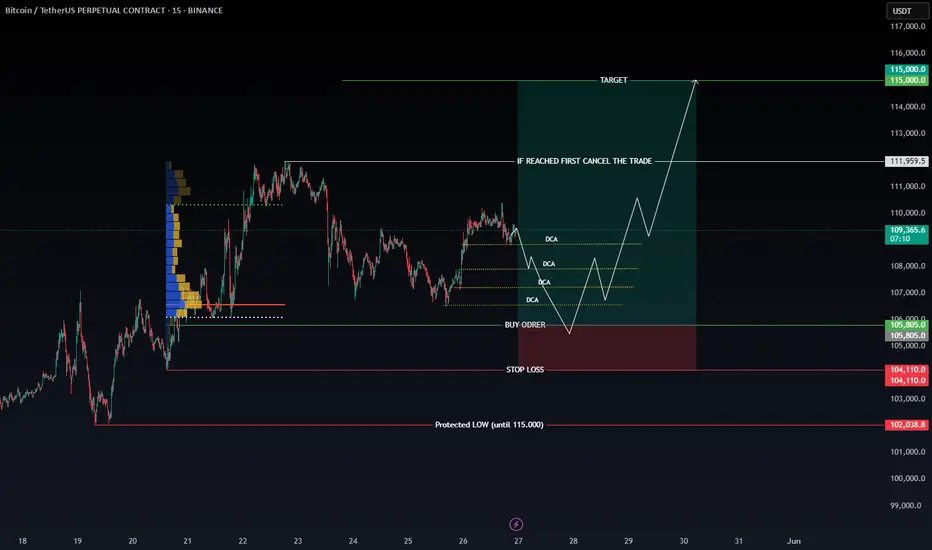
Short-Term BTC Scalping Opportunity⚡Say less
💥Setup and forget
💥the position is off if price hits 111,959 first.
💥leverage maybe used according to your risk management
$PENGU Approaching Apex – Breakout Watch On!CSECY:PENGU is forming a symmetrical triangle on the 4H chart, and price is getting close to the apex.
It’s currently holding above the support trendline and the 200 EMA a key zone to watch.
A breakout above the triangle could push the price toward the $0.022–$0.023 range.
I’m watching closely. If it breaks out with strong volume, it could be a solid setup.
Use a tight stop-loss and manage your risk properly.

Gold price accumulates above 3300, new week⭐️GOLDEN INFORMATION:
Gold (XAU/USD) faced some selling pressure around the $3,335 mark during Monday’s early Asian session, as easing trade tensions slightly dampened demand for the safe-haven asset. The recent softening in rhetoric surrounding global trade disputes has contributed to the metal’s pullback, though upcoming economic events could shift momentum.
On Sunday, US President Donald Trump announced a delay in imposing the proposed 50% tariffs on the European Union until July 9, easing fears of an imminent escalation in trade hostilities. This development has weighed on bullion prices by reducing immediate risk aversion in the markets.
Nonetheless, investor attention now turns to Wednesday’s release of the FOMC Minutes, which could offer further clarity on the Federal Reserve’s monetary policy outlook. Meanwhile, market participants will continue to monitor trade negotiations between the US and Japan, as well as other major economies. Any renewed tensions or setbacks in these discussions could quickly revive demand for gold as a protective hedge.
⭐️Personal comments NOVA:
Gold prices reacted slightly lower after the official announcement of tariff postponement. Accumulated above 3300
⭐️SET UP GOLD PRICE:
🔥SELL GOLD zone : 3388- 3390 SL 3395
TP1: $3376
TP2: $3363
TP3: $3350
🔥BUY GOLD zone: $3301- $3299 SL $3294
TP1: $3312
TP2: $3325
TP3: $3338
⭐️Technical analysis:
Based on technical indicators EMA 34, EMA89 and support resistance areas to set up a reasonable BUY order.
⭐️NOTE:
Note: Nova wishes traders to manage their capital well
- take the number of lots that match your capital
- Takeprofit equal to 4-6% of capital account
- Stoplose equal to 2-3% of capital account
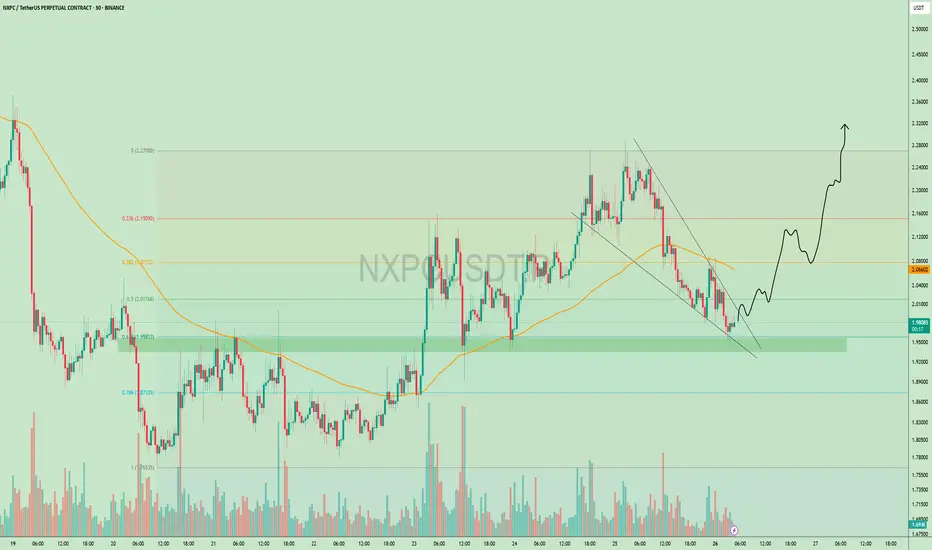
$NXPC Rebounding from Golden Zone!!$NXPC
Based on the Fib retracement, the price is currently sitting in the golden zone between 0.5–0.618 levels a common area for strong bounces.
Also, the price is reacting well near the demand zone, and a small falling wedge has just broken out.
This setup offers a clean risk-reward with tight invalidation.
I’m keeping a close eye on it could be a solid opportunity if momentum builds.

Top M30 XAU/USD Trade Setups for Today – Buy & Sell Opportuniti📊📉📈 Gold (XAU/USD) is currently trading within a key support zone 🟣, retesting after a previous bullish breakout. If the price holds this zone and forms strong bullish candles, we could see a move toward the 3,366 resistance level 🔵 and potentially higher toward 3,389 📈. However, if the price breaks below this zone with strong bearish momentum, a drop toward 3,280 🔽 becomes likely. Watch the price action closely within this zone, as it could lead to a decisive move. ✅ Patience and confirmation are crucial to avoid false breakouts. 💡

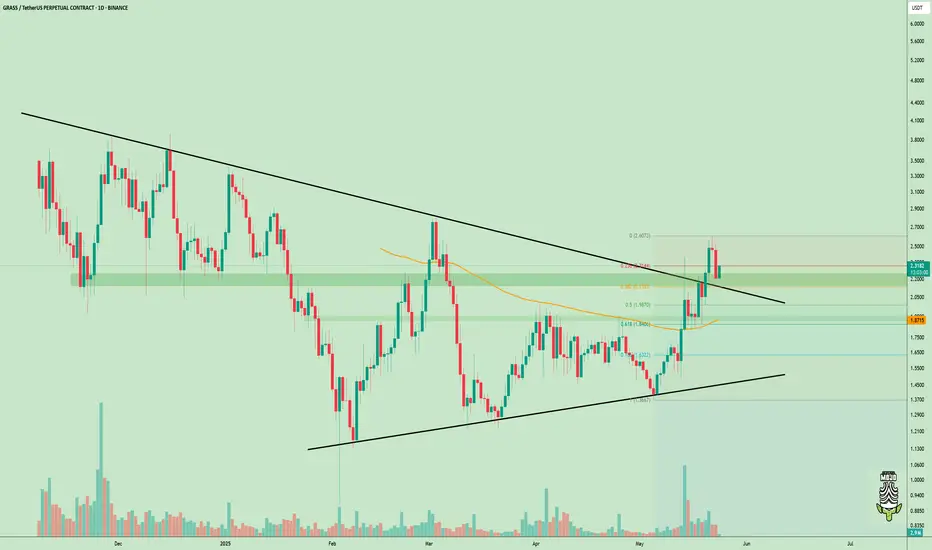
$GRASS just broke out of a long-term downtrend!$GRASS just broke out of a long-term downtrend!
#GRASS has broken out of a long-term symmetrical triangle and flipped the trend bullish.
Price is currently holding above the breakout zone and also respecting the 0.786 fib level from the recent range.
As long as it stays above the $2.13–$2.14 zone, the move toward $2.60+ looks likely.
This breakout could be the start of a bigger trend shift. Let’s see how it holds up in the coming days.
DYOR, NFA
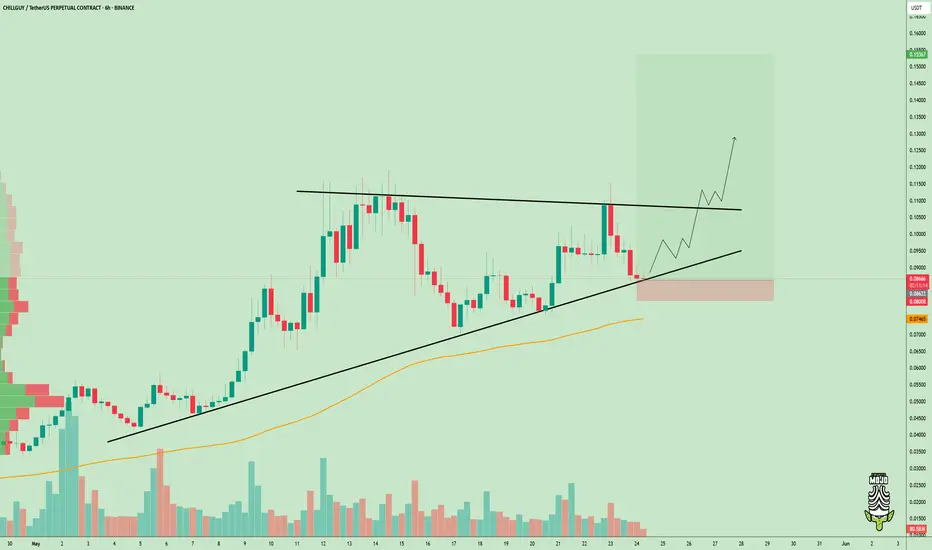
$CHILLGUY is holding strong!$CHILLGUY is holding strong!
Price is respecting the ascending trendline and gearing up for a breakout.
A move above that top resistance could open the gates to $0.13
Entry zone: $0.086–$0.088
Stop-loss: $0.080
Looks like a clean setup with a good risk-reward.
Just manage your risk properly and don’t chase.
DYOR, NFA
#chillguy #cryptocurrency
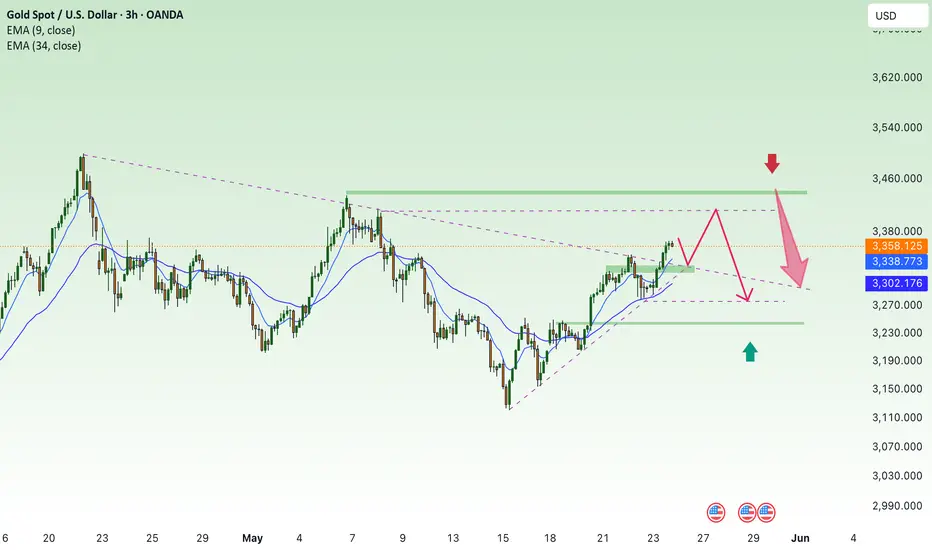
Tariffs heat up again, gold recovers✍️ NOVA hello everyone, Let's comment on gold price next week from 05/26/2025 - 05/30/2025
🔥 World situation:
Gold resumed its upward momentum on Friday, surging nearly 2% on the day and over 5% for the week, as the US Dollar weakened amid renewed trade tensions. The yellow metal climbed to $3,359, rebounding from an intraday low of $3,287, as escalating rhetoric from Washington fueled investor demand for safe-haven assets.
US President Donald Trump intensified the trade standoff with the European Union, declaring that talks were “going nowhere” and threatening to impose 50% tariffs on EU imports starting June 1. Adding to the pressure, US Treasury Secretary Scott Bessent remarked that the EU’s trade proposals have fallen short compared to offers from other key partners. Mounting concerns over US fiscal policy and an increasingly strained global trade environment continue to bolster gold’s appeal.
🔥 Identify:
Tariff news is starting to heat up again, the US and other countries around the world have not reached a consensus on negotiations, gold prices benefit from the increase. The large time frame shows that prices are breaking out and continuing the upward trend.
🔥 Technically:
Based on the resistance and support areas of the gold price according to the H4 frame, NOVA identifies the important key areas as follows:
Resistance: $3412, $3436
Support: $3315, $3280, $3245
🔥 NOTE:
Note: Nova wishes traders to manage their capital well
- take the number of lots that match your capital
- Takeprofit equal to 4-6% of capital account
- Stoplose equal to 2-3% of capital account
- The winner is the one who sticks with the market the longest
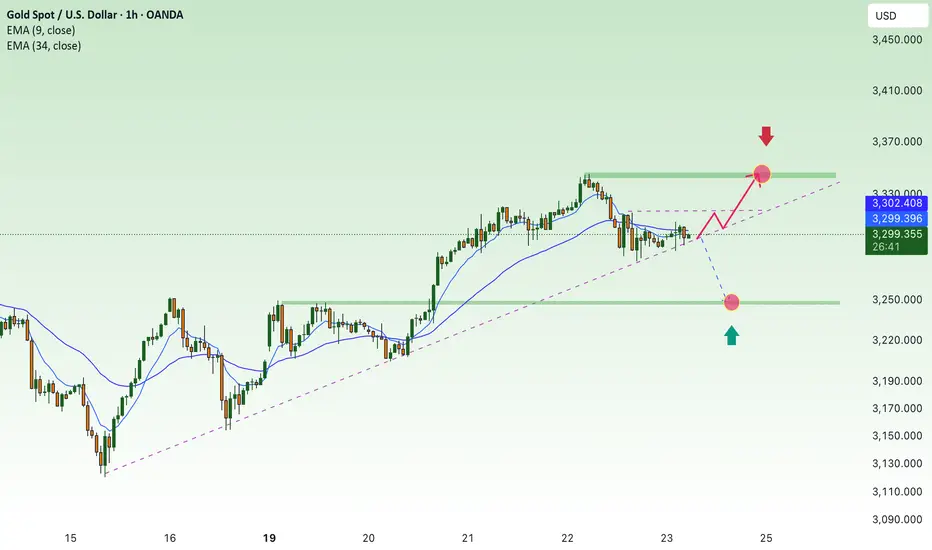
Moving in the uptrend, bulls dominate⭐️GOLDEN INFORMATION:
Gold prices slipped by approximately 0.48% on Thursday, retreating from a two-week peak of $3,345 and falling below the key $3,300 level. The decline was driven by renewed strength in the US Dollar, even as Treasury yields pulled back from their intraday highs. The pressure on the yellow metal intensified after the US House of Representatives passed President Trump’s budget proposal, which now heads to the Senate for final approval. At the time of writing, XAU/USD is trading at $3,289, marking a 0.83% daily loss.
While sentiment in the broader market has seen a modest rebound, it remains fragile following Moody’s recent downgrade of US sovereign debt. The fiscal package approved by the House is expected to raise the national debt ceiling by a staggering $4 trillion, amplifying concerns over long-term fiscal sustainability.
⭐️Personal comments NOVA:
Gold price is still moving in the H1 uptrend line, buying power is still quite strong.
⭐️SET UP GOLD PRICE:
🔥SELL GOLD zone : 3344- 3346 SL 3351
TP1: $3335
TP2: $3322
TP3: $3307
🔥BUY GOLD zone: $3248- $3246 SL $3241
TP1: $3258
TP2: $3270
TP3: $3280
⭐️Technical analysis:
Based on technical indicators EMA 34, EMA89 and support resistance areas to set up a reasonable BUY order.
⭐️NOTE:
Note: Nova wishes traders to manage their capital well
- take the number of lots that match your capital
- Takeprofit equal to 4-6% of capital account
- Stoplose equal to 2-3% of capital account
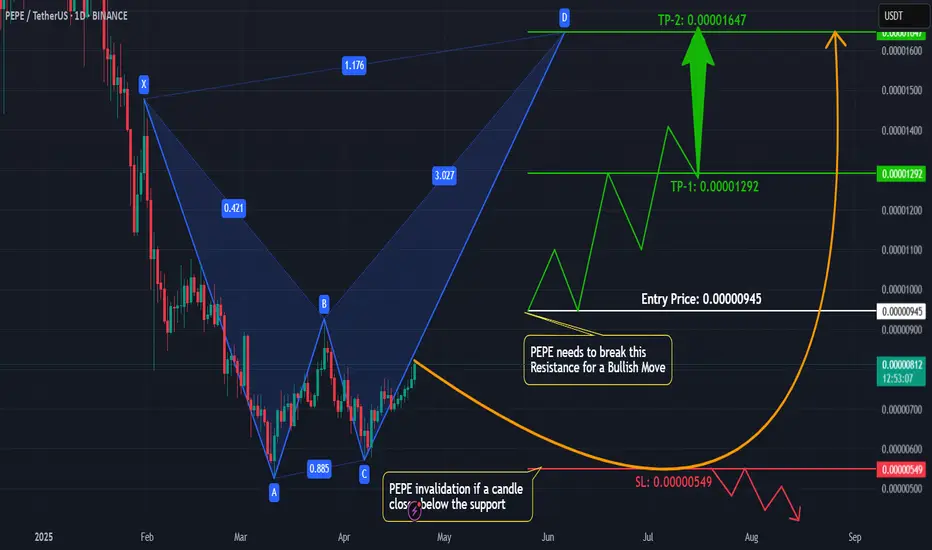
PEPE 1D Harmonic Pattern Setting Up for a Bullish Breakout!Hey traders!
I'm spotting a potential bullish setup on #PEPEUSDT — and it’s one worth watching closely.
🔍 Technical Overview:
On the 1D time frame, #PEPE is forming a textbook harmonic pattern — still confirming.
No bearish divergence or reversal signs spotted so far — momentum remains intact.
Key level to watch: B point of the harmonic pattern, acting as strong horizontal resistance.
🎯 Trade Idea:
Plan: Wait for a clean breakout above the B-level, followed by a successful retest.
If the retest holds as support, I’ll be entering a long position with tight risk management.
TP-1: 0.00001292
TP-2: 0.00001647
SL: 0.00000549
⚠️ Why patience matters: Jumping in too early can expose you to fakeouts. Confirmation = confidence!
💬 What do YOU think? Is #PEPE about to explode or will the resistance hold? Drop your thoughts below! 👇
📈 If you find this helpful, don’t forget to: 👍 Like
💬 Comment
🔁 Share
📌 Follow me for more high-probability setups!
Let’s trade smart, not emotional. 💡
#PEPE #CryptoTrading #HarmonicPattern #BreakoutSetup #TechnicalAnalysis #TradingView #CryptoCommunity #Altcoins
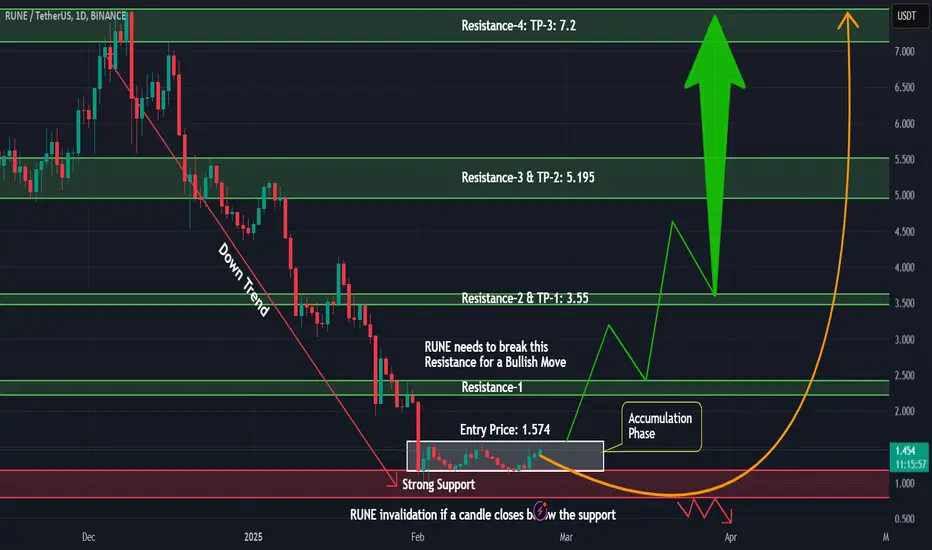
RUNE Ready for a Big Move? Accumulation Breakout Incoming!Current Market Structure:
#RUNE has been in an accumulation phase after a prolonged bearish trend. The price is consolidating, forming a potential Wyckoff Accumulation pattern. No further bearish signs are present except for the previous break of a strong support level.
Key Levels to Watch:
🔹 Support: $0.788 (previous level)
🔹 Resistance: $2.5 (breakout zone)
🔹 Accumulation Range: $1.13 – $1.6
Trading Plan:
🔹 A confirmed breakout above the resistance level will signal the start of a bullish trend.
🔹 Ideal long entry on breakout with a retest confirmation.
🔹 Stop-loss below accumulation range to minimize risk.
🔹 Targeting $7 as the next resistance level.
What do you think?
Will #RUNE break out soon, or are we in for more sideways movement? Share your thoughts in the comments!
Like & Follow for more trade setups and insights!
BNB Ready for a Major Breakout? Head & Shoulders Pattern in PlayMarket Insight:
#BNB is currently trading in a prime buying zone for spot traders, showing strong price action on the 4-hour timeframe. A Head and Shoulders (H&S) pattern is forming, and we are closely monitoring its breakout for a potential bullish move.
🔹 Bearish Signs? None so far! The market structure remains intact, and buyers seem to be in control.
Trade Plan for Bulls:
🔹 Breakout Confirmation: A clean break above the neckline of the H&S pattern will confirm bullish momentum.
🔹 Entry Zone: After confirmation, a long position can be initiated with proper risk management.
🔹 Stop Loss & Risk Management: Place a stop-loss below the right shoulder to manage risk effectively.
🔹 Potential Target: If the breakout holds, we could see a strong upward move toward key resistance levels.
🔹 Chart Analysis: (Attach a well-annotated chart with clear trendlines, breakout zones, and risk-reward levels)
🔹 What’s Your Take?
Do you think #BNB will break out or face rejection? Drop your thoughts in the comments!
Like & Follow for more real-time trade setups!
