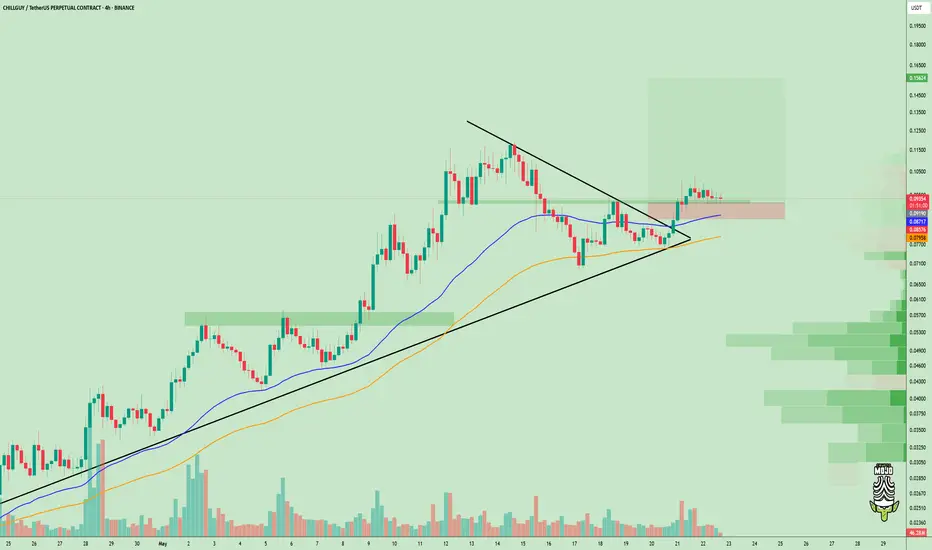
#ChillGuy Breakout Confirmed – Long Setup Active!#ChillGuy has broken out of a symmetrical triangle and is currently holding above horizontal support in the short term, which looks strong !
We can consider a long position at the current market price (CMP) with a stop-loss at $0.0857.
If the market plays out as expected, we could see a solid move from here.
DYOR, NFA
Buysellsignal
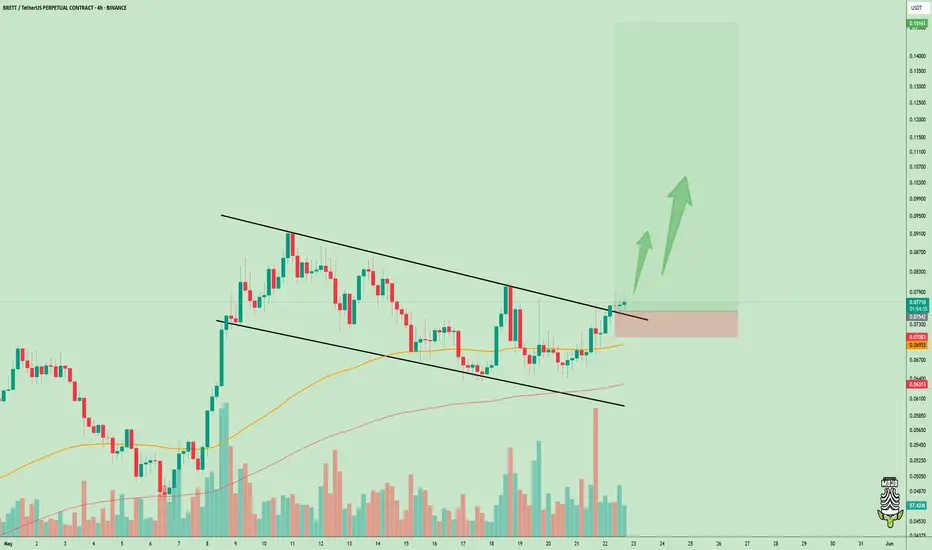
$BRETT Bull Flag breakout Done!!$BRETT Bull Flag breakout Done ✅
Looks ready to take off anytime.
I bought it at CMP with SL $0.07083
DYOR, NFA
BYBIT:BRETTUSDT PYTH:BRETTUSD
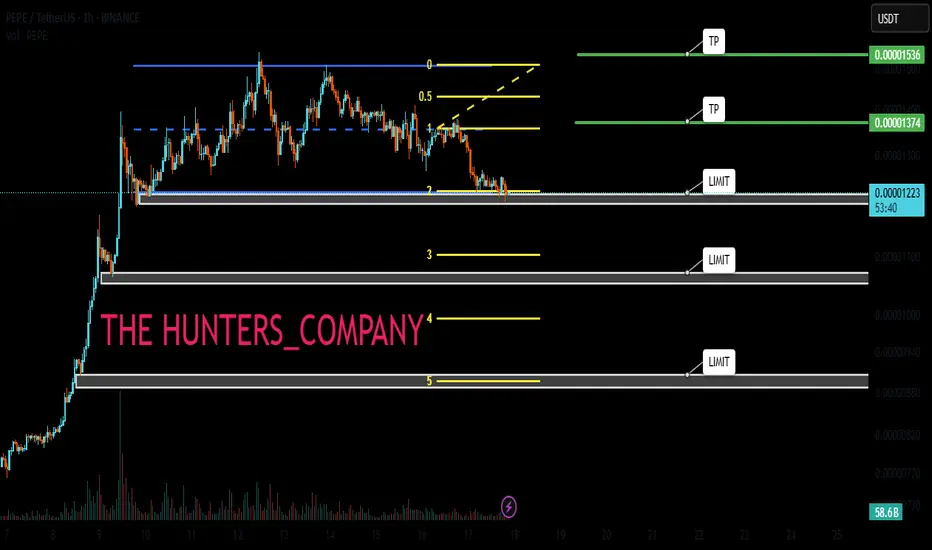
PEPE AGAIN!!!Hello friends
Considering the good growth we had, you can see that the price has made a correction and entered a range after reaching its ceiling.
Now, with the price correction, there is a good opportunity to buy in a pipeline and with capital management and move with it to the specified goals.
*Trade safely with us*
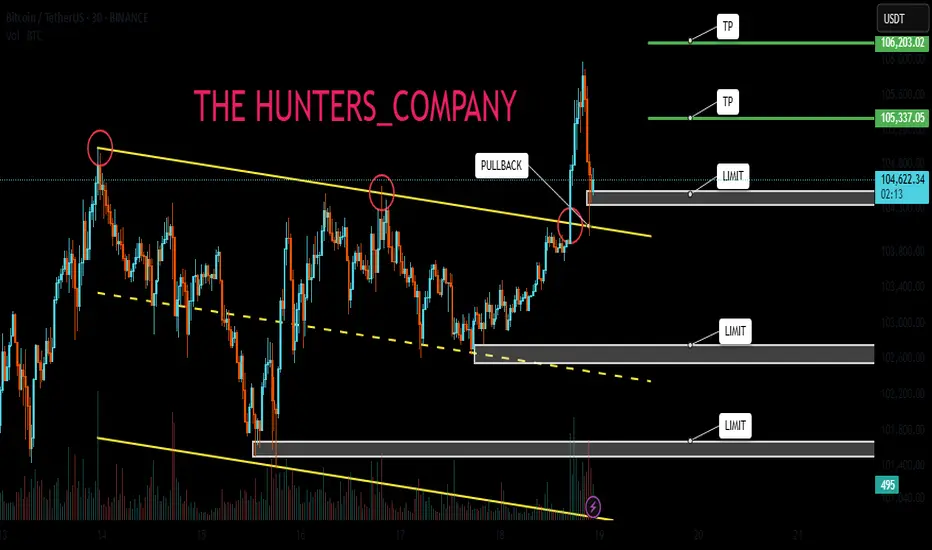
BITCOIN : FREE SIGNAL (DON'T MISS)Hello friends
According to the upward trend we had, you can see that the price is stuck in a channel and after the third collision with the channel ceiling, it has managed to break the channel, which indicates the power of buyers and you can buy within the specified support ranges with capital and risk management and move with it to the upcoming goals.
*Trade safely with us*
Buy in fear, sell in greed.Hello dears
Due to the price growth, now in the pullback you can buy in support areas in steps and move with it to the specified targets, of course with capital management.
*Trade safely with us*
BEST XAUUSD M30 BUY AND SELL S FOR TODAYETUP Gold (XAU/USD) is currently trading in a tight **rising wedge pattern** 📈 on the 30-minute chart, just below a key **resistance level at 3,325** 🔼. The price action shows signs of consolidation, indicating that a breakout could be imminent. If the bulls manage to push the price above this resistance 🚀, we may see a strong upward continuation toward higher targets. However, if the wedge fails and price breaks downward 📉, there is potential for a retracement toward the **support levels at 3,304** and further down to **3,274** 🛑. This is a crucial decision point — traders should watch for a confirmed breakout or breakdown before taking positions ⚠️.


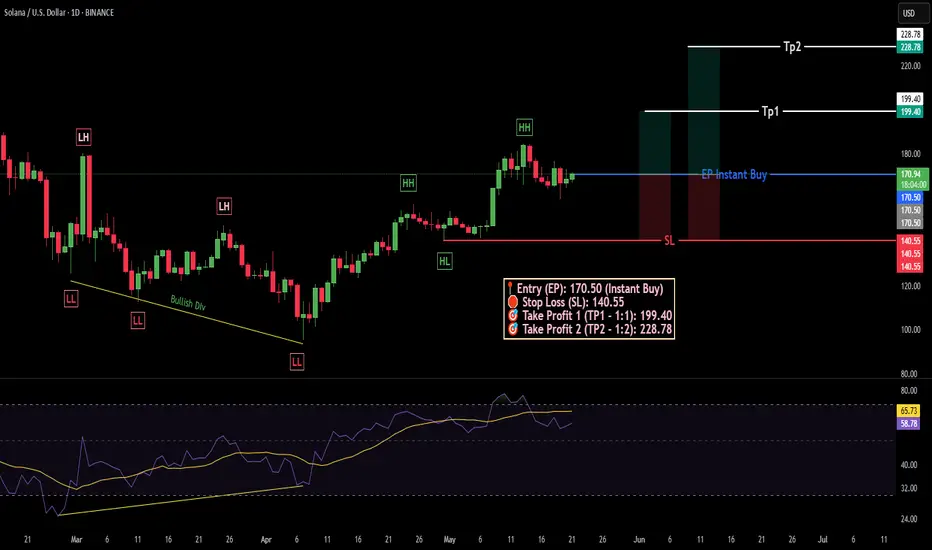
SOLUSD Long1D Analysis:
SOLUSD is in a strong uptrend with a second Higher High (HH) in place. A bullish divergence is visible, and price has retraced into the golden zone (0.5–0.618 Fib) — signaling a high-probability long setup. Instant buy is Suggested.
Bull Score: 2 vs 0 (Uptrend (Dow Theory, Bullish Divergence vs 0)
🛡 Risk Management
📍 Entry (EP): 170.50 (Instant Buy)
🛑 Stop Loss (SL): 140.55
🎯 Take Profit 1 (TP1 - 1:1): 199.40
🎯 Take Profit 2 (TP2 - 1:2): 228.78
💰💸 Trade smart, manage risk, and let the trend print
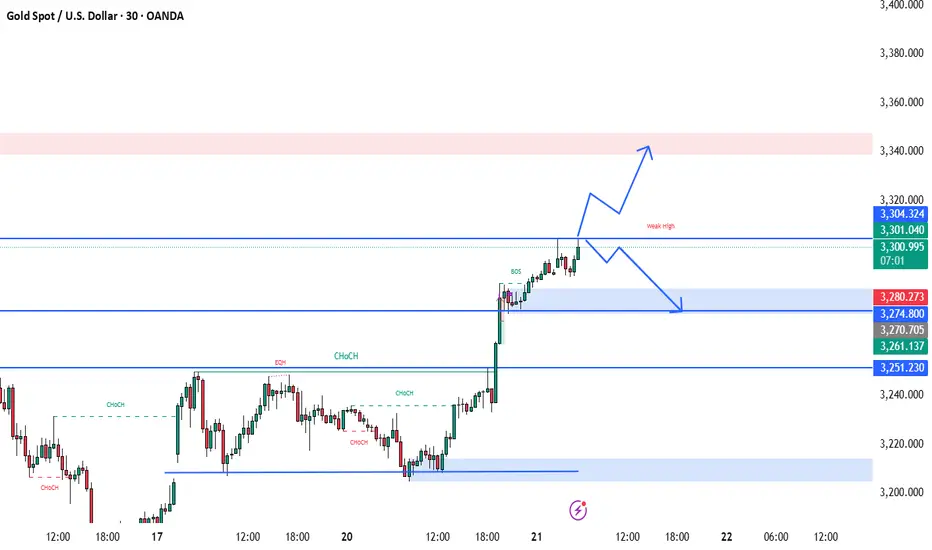
BEST XAUUSD M30 BUY SETUP FOR TODAYThis 30-minute chart of Gold Spot (XAU/USD) reflects a strong bullish momentum 📈, marked by a clear Break of Structure (BOS) and Change of Character (ChoCH) signaling a market shift to the upside. Price recently broke above an equal high (EQH) and is now testing a resistance zone labeled as a “weak high”, suggesting potential for further upside toward the next key supply zone 🔴. The projection highlights two possible scenarios: either a continued bullish rally into the supply area around 3,340 🏹, or a pullback to the demand zone near 3,280 🟦 before resuming upward movement. Traders should monitor for price reaction at current levels and be prepared for either a breakout or a healthy retracement for optimal entry opportunities 🎯.
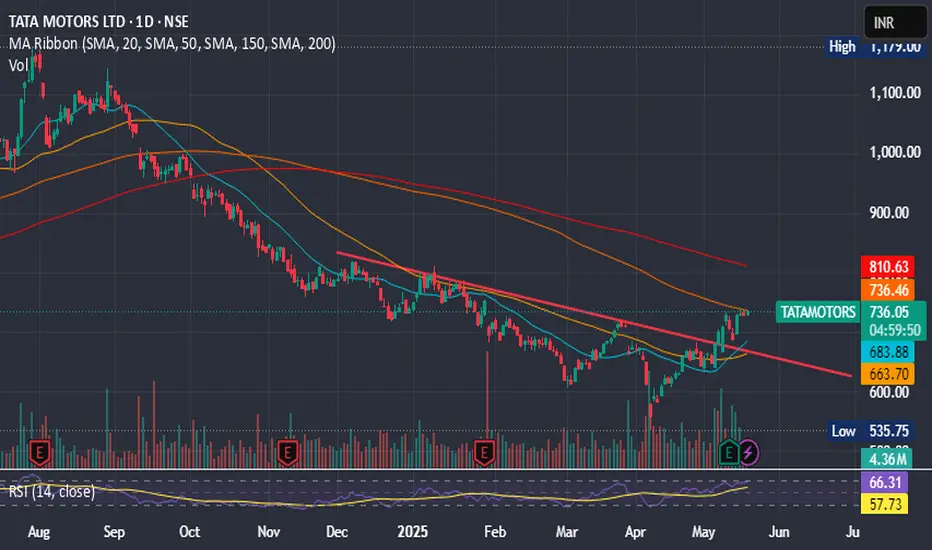
TATA MOTORS IGNITING MOMENTUM - Pivot Points: The classic pivot point is 731.45, with resistance levels at 733.4, 736.3, and 738.25, and support levels at 728.55, 726.6, and 723.7
Tata Motors' short-term trend appears bullish, with analysts predicting an upside target of ₹770–780 in the coming weeks. The stock has shown strong resilience near its support level of ₹715 and is trading above key short-term moving averages, signaling strength.
Key Levels:
- Support: 715–720
- Resistance: 735–740
- Target: 770–780 OR MORE TOWARDS 823
XAUUSD M30 BEST BUY AND SELL SETUP FOR TODAYThis 30-minute chart of Gold Spot (XAU/USD) reveals a critical decision zone ahead 📊. Price is currently reacting to a support area around 3210, marked by the purple zone. A Change of Character (ChoCH) has just occurred, suggesting a potential bullish reversal if price holds above this support 📈. There are two likely scenarios:
1️⃣ A bullish continuation where price forms higher lows and targets the supply zone near 3230 and potentially the strong high at 3252, or
2️⃣ A bearish break below support, triggering a drop towards the demand zone at 3170 and possibly further into the order block (OB) near 3160 📉.
Traders should watch for confirmations like strong bullish candles or rejections at key levels before committing to a direction ✅. This is a high-probability setup with defined risk and reward zones! 💰📉📈

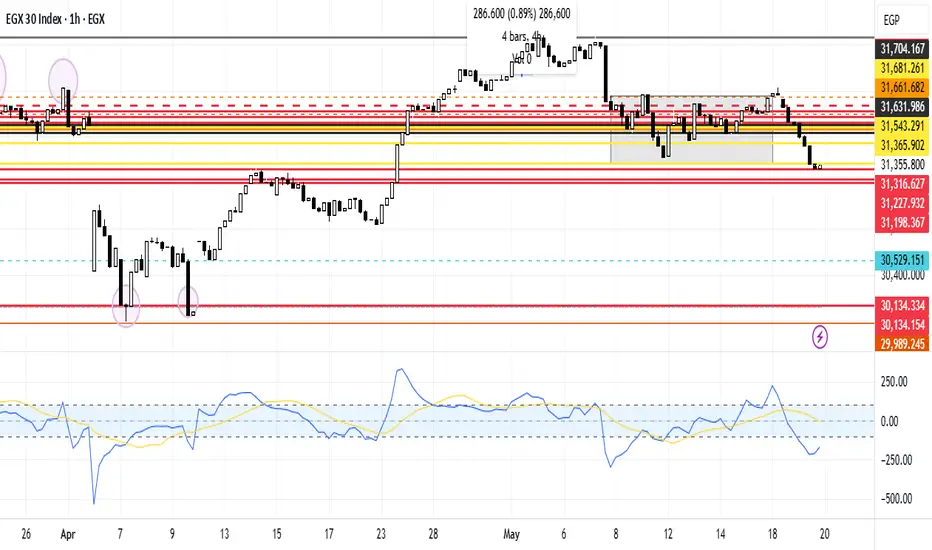
EGX30 Trend Line AnalysisEGX30 stock is currently falling but rebounded at the support line 31,365.902. In case of taking an upward trend it is expected to breach the resistance line at 31,543.291, then reach the resistance line at 31,681.261. In case of falling it's expected to break the 1st support line 31,316.627 then the 2nd support line 31,227.932, then the 3rd support line 31,198.367
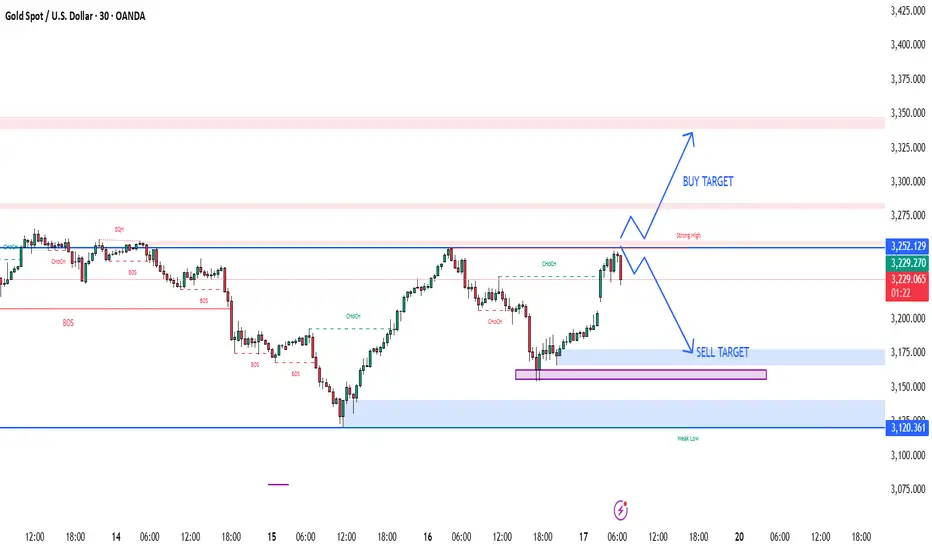
XAUUSD M30 BEST BUY AND SELL SETUP FOR TODAYGold (XAUUSD) is trading near a 🔴 strong resistance zone (3,239–3,252). If price shows a bearish rejection from this area, it could be a sign of a 🧨 liquidity grab or fake breakout. This sets up a potential 📉 sell opportunity, targeting the support zones at 3,175 and possibly down to 3,120 where the 🧊 weak low and demand lie. A safe 🛑 stop-loss can be placed above 3,260 to manage risk. However, if the price gives a strong breakout and 📈 retest above 3,252, then a bullish continuation toward 3,325–3,350 is likely 🎯. Patience is key—wait for clear confirmation before entering the trade ⚖️📊.
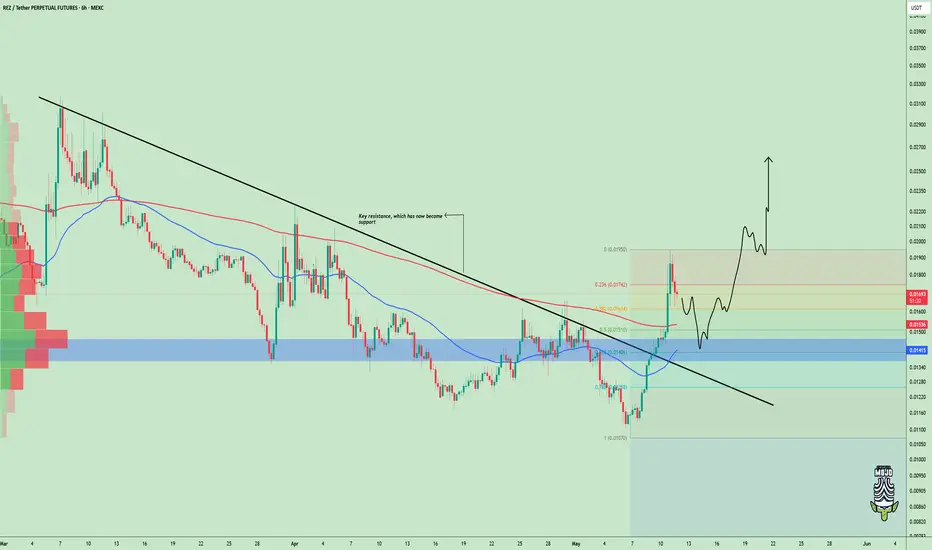
$REZ Reversal in Motion – Eyes on the Next Wave UpAMEX:REZ reversed major resistance into support upon coming out of a downtrend.
We are currently looking for a pullback towards the 0.618 Fib level at 0.015 before the next wave up.
The market structure is still bullish, and the chart is priming for an explosive breakout into $0.023+.
Keep alert and observe that level.👀
DYOR, NFA
$TIA pullback looks healthy for next leg up !!LSE:TIA is retesting the breakout zone perfectly
After a clean breakout from the falling wedge structure, the price is now pulling back into the key demand area.
I expect this zone to hold and if it does, we could see a strong move toward $5+ in the coming days.
Keep a close eye on this level, the next move could be explosive! 🚀
Like & Retweet if you're bullish!
#TIA #CRYPTOMOJO_TA

$CHILLGUY Cooling Off – Accumulation Zone Ahead?$CHILLGUY is pulling back after a strong run-up.
Price is currently sitting around the $0.0757 area, but in my opinion, there could be a drop towards the lower zone around $0.052–$0.060.
That area could be a solid spot for accumulation.
Keep an eye on this zone. 👀
Stay tuned I’ll keep you updated if anything changes.
#chillguy #Altseason2025

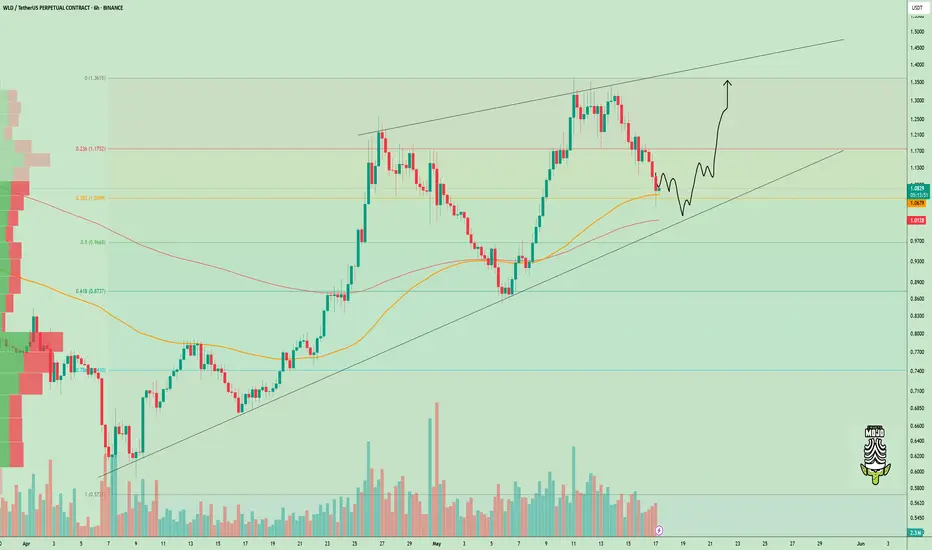
$WLD Dips Into Key Support – Next Move Loading!MIL:WLD is currently pulling back into a strong confluence support zone aligning with the 100EMA, 200EMA, and ascending trendline on the 6H chart.
Price is hovering just above the 0.382 Fib level (~$1.06), which previously acted as a pivot. Holding this level could spark the next bullish leg toward $1.30+.
But if this zone cracks, we might revisit the trendline near $1.02 before any meaningful bounce.
📌 Eyes on price action, this structure still favours higher highs unless invalidated.
#WLD #cryptocurrency
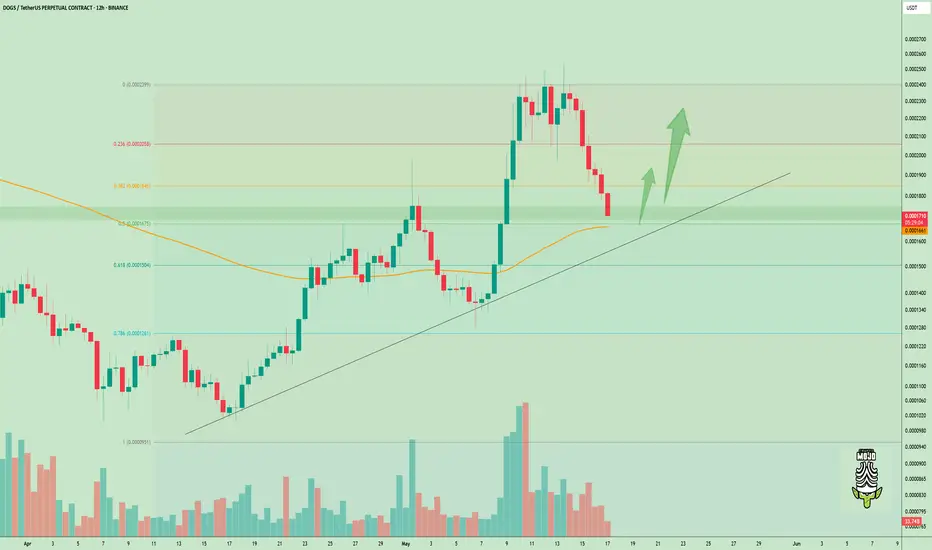
Critical Test for $DOGS – Launchpad or Breakdown?SEED_ALEXDRAYM_SHORTINTEREST1:DOGS Update
SEED_ALEXDRAYM_SHORTINTEREST1:DOGS is heading towards an important confluence support area resting precisely at the 0.382 Fib (~0.0000184), the rising trendline, and the 50EMA on the 12H chart.
This area has maintained support in the last rally and may again serve as the launchpad for another bullish run towards 0.000022–0.0000239.
A dip below this level, though, could change short-term bias.
Be on the watch for the reaction. 👀
#DOGS #cryptocurrency
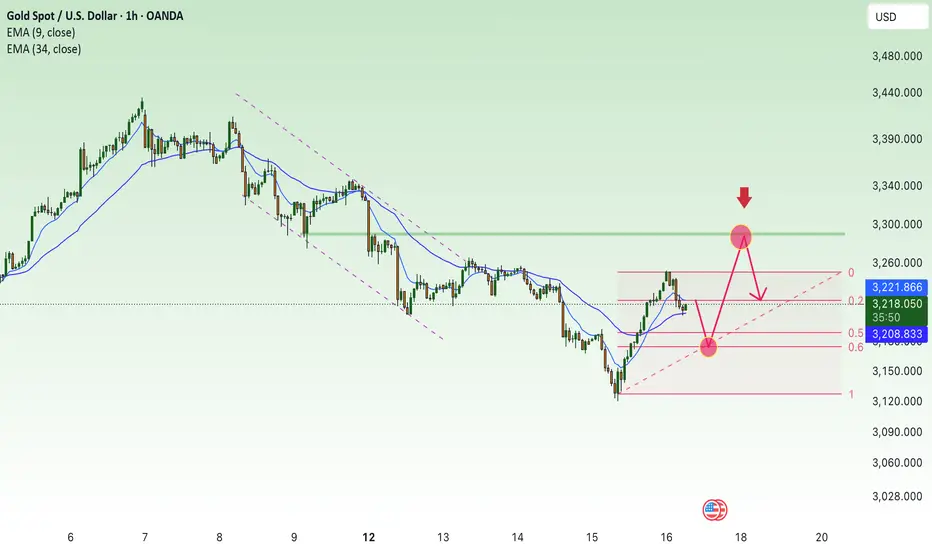
Cumulative recovery above 3190, maintain⭐️GOLDEN INFORMATION:
Gold price (XAU/USD) fails to build on Thursday’s sharp rebound from the $3,120 area — its lowest level since April 10 — and comes under renewed selling pressure during Friday’s Asian session. The 90-day trade truce between the US and China has alleviated some of the strain on global financial markets, weighing on demand for the safe-haven metal.
Nevertheless, lingering geopolitical tensions and a weaker US Dollar continue to offer underlying support, limiting the downside. Additionally, growing market expectations for further interest rate cuts by the Federal Reserve may deter traders from adopting strong bearish positions on gold in the near term.
⭐️Personal comments NOVA:
Gold prices recover, buyers are determined to keep prices stable around the 3200 mark in May. Waiting for new bullish momentum after tariff negotiations end
⭐️SET UP GOLD PRICE:
🔥SELL GOLD zone : 3287- 3290 SL 3294
TP1: $3270
TP2: $3260
TP3: $3250
🔥BUY GOLD zone: $3173 - $3175 SL $3168
TP1: $3188
TP2: $3200
TP3: $3218
⭐️Technical analysis:
Based on technical indicators EMA 34, EMA89 and support resistance areas to set up a reasonable BUY order.
⭐️NOTE:
Note: Nova wishes traders to manage their capital well
- take the number of lots that match your capital
- Takeprofit equal to 4-6% of capital account
- Stoplose equal to 2-3% of capital account
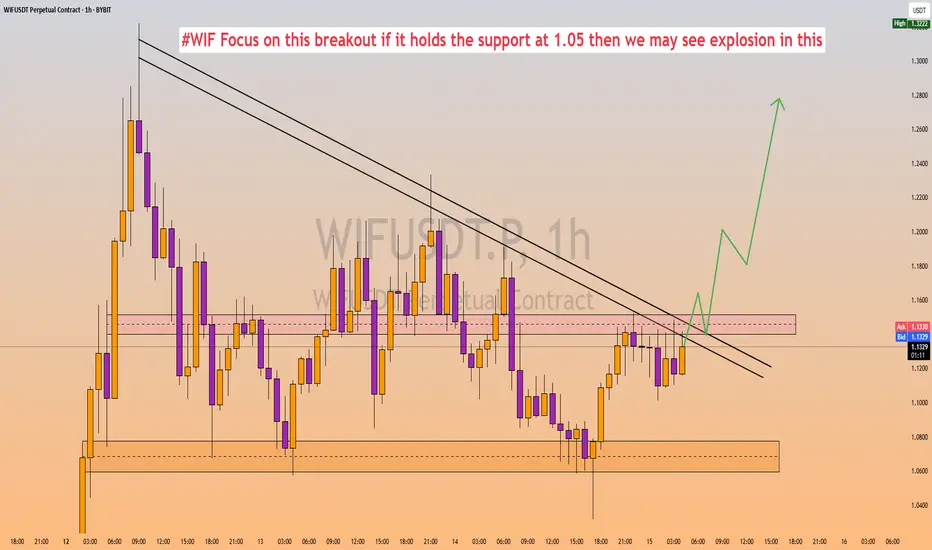
$WIF Breakout Alert – Massive Move Incoming?#WIF is approaching a key breakout zone. If the price holds the $1.05 support, we could see a strong bullish explosion. The breakout of the descending trendline and reclaim of the resistance zone (~$1.15) may push the price toward $1.27+ targets. Keep this on your radar! 📈
🔹 Resistance to watch: $1.15
🔹 Support: $1.05
🔹 Breakout Target: $1.27
📊 Timeframe: 1H (Bybit)
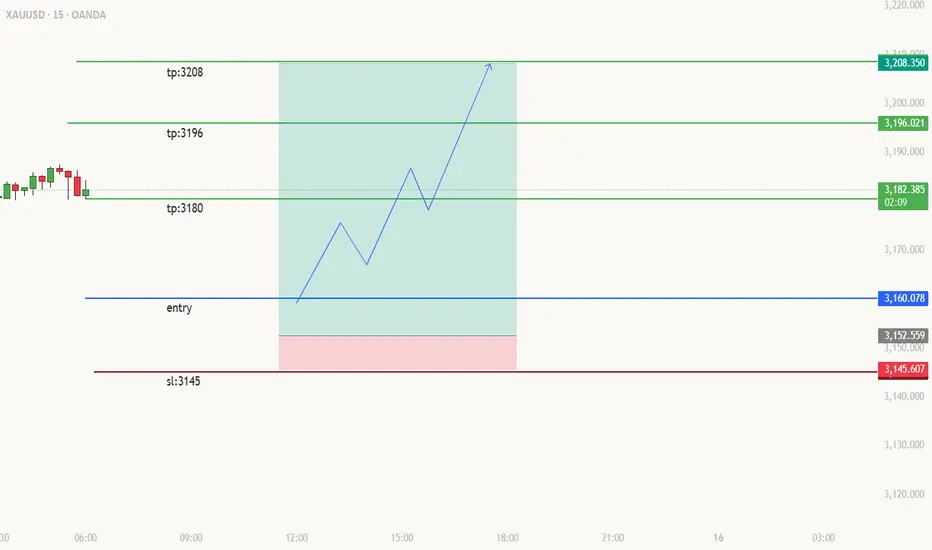
High R Risk Long Strategy 3160 Old Bulls Awaiting AttackNew version:
After a significant drop in gold prices, we're starting to notice some encouraging signs of a bullish trend taking shape. The price has bounced off the 3145–3160 demand zone several times, hinting at possible accumulation. The recent candle patterns are showing higher lows, and it looks like buyers are stepping in to protect the liquidity just below 3160.
This setup is all about price action, liquidity sweeps, and structural changes. The 3160 zone is a crucial decision point where we expect buyers to take charge. It also coincides with a previous imbalance fill and a short-term order block.
Right now, this phase presents a great risk-to-reward opportunity for bulls, as long as the stop loss at 3145 holds firm.
Entry: 3160
Stop Loss: 3145 (just below the liquidity sweep and order block)
Targets:
TP1: 3180 (a minor resistance / reaction zone)
TP2: 3196 (liquidity above the last high)
TP3: 3208 (a key breakout target zone)
GOOD POINT Hello friends
As you can see, the price has fallen to the bottom of the next channel with the channel break and now the important point is to see if the price is supported considering reaching the bottom of the channel and the important Fibonacci support?
To solve this issue, we suggest you buy stepwise, of course with capital and risk management...
*Trade safely with us*
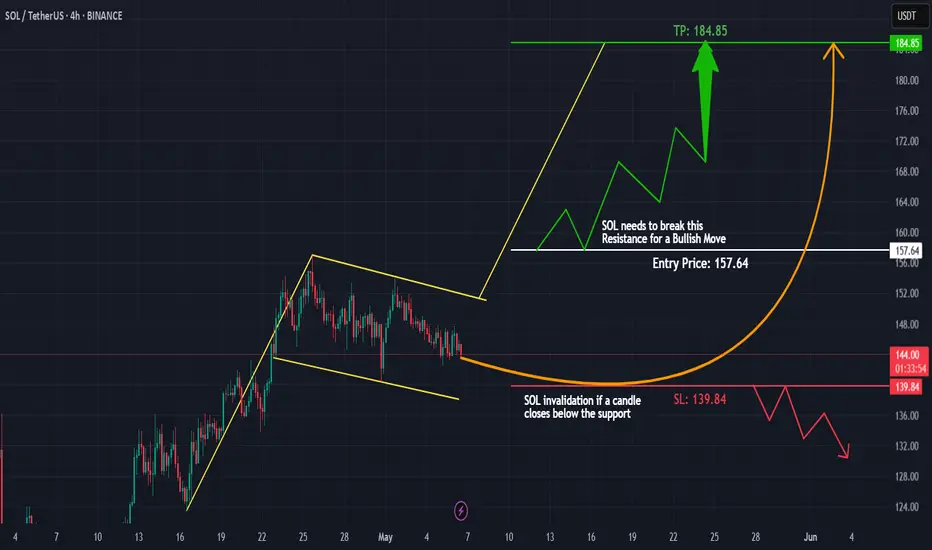
SOLANA (SOL/USDT) – Bullish Flag Forming on 4H!Hey traders!
#SOLANA is currently consolidating sideways and printing a bullish flag pattern on the 4-hour timeframe – a classic continuation signal after a strong upward move! 🚀
Here's the plan:
Wait for a clean breakout above the flag's resistance
Enter on the retest of the breakout level to confirm support
Apply strict risk management and target the next major resistance zone
Watch for increasing volume to validate the move
Why this matters?
The bullish flag often leads to explosive moves when confirmed properly. Don’t chase the breakout — let price come to you. Patience = profits. 🧘♂️
Key Levels & Entry Plan marked on chart
Drop your thoughts below – do you agree with this setup or see it differently?
Like & Follow for more clean, no-hype trade ideas!
#Solana #SOL #CryptoTrading #BullishFlag #TradingView #TechnicalAnalysis #Altcoins #CryptoSetup #BreakoutTrade