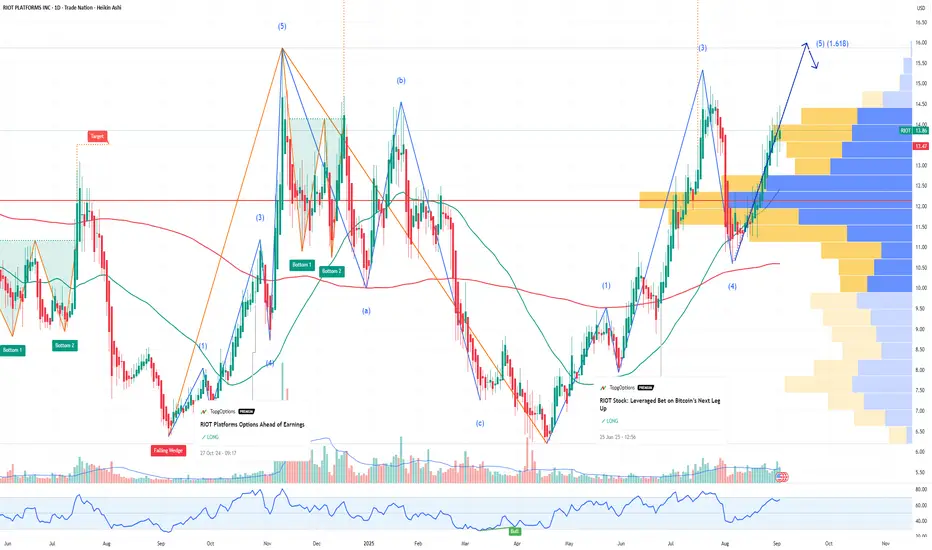
RIOT: Lagging Behind Peers, Ready to Catch Up?RIOT Platforms is showing an interesting setup right now. While the broader crypto mining sector has already seen strong moves higher, RIOT is still trading at a relative discount compared to peers like Iris Energy (IREN).
Key Points:
Relative Valuation Gap: IREN and other Bitcoin miners have rallied strongly in recent weeks, yet RIOT has lagged behind. Historically, these names tend to move in cycles together, and RIOT often plays catch-up when the spread gets too wide.
Strong Fundamentals: RIOT continues to expand its hash rate and energy efficiency, positioning itself as one of the top U.S.-based miners. With Bitcoin consolidating above key levels, miners with scale like RIOT stand to benefit disproportionately.
Technical Setup: On the chart, RIOT is building a base with higher lows, showing accumulation. A breakout above recent resistance could trigger momentum buyers and fuel a sharp move higher.
Bullish Outlook:
If Bitcoin maintains its strength and the miner sector rotation continues, RIOT has plenty of room to the upside just to close the gap with peers. Traders looking for lagging plays in the sector may see RIOT as the next mover.
Buysellsignals
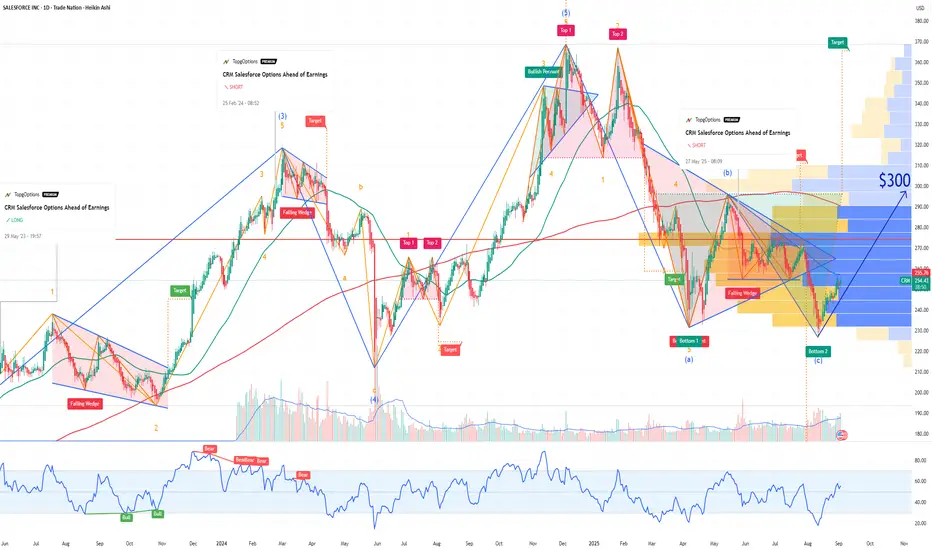
CRM Salesforce Options Ahead of EarningsIf you ahven`t bought CRM before the rally:
Now analyzing the options chain and the chart patterns of CRM Salesforce prior to the earnings report this week,
I would consider purchasing the 300usd strike price Calls with
an expiration date of 2025-12-19,
for a premium of approximately $7.52.
If these options prove to be profitable prior to the earnings release, I would sell at least half of them.
Disclosure: I am part of Trade Nation's Influencer program and receive a monthly fee for using their TradingView charts in my analysis.
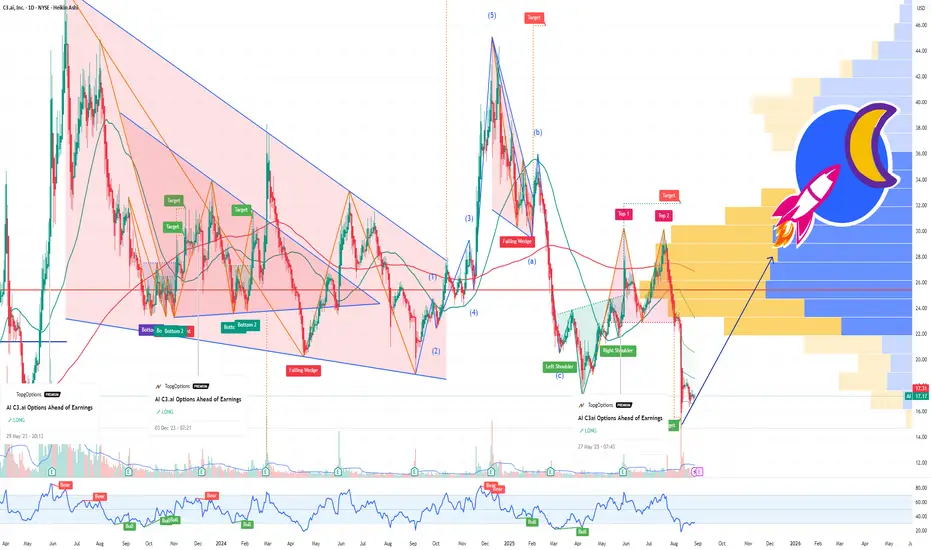
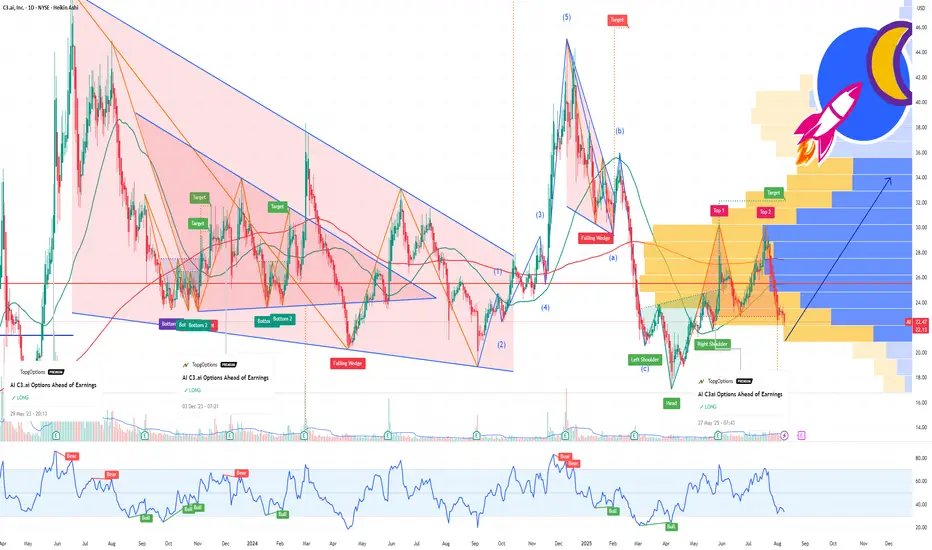
AI c3ai Bullish Reversal Ahead of EarningsAI C3.ai has been in the spotlight recently, following a series of notable developments that set the stage for a potential bullish reversal. The company recently announced that founder and CEO Thomas Siebel is stepping down due to health reasons. While this initially caused some market jitters, it coincides with a broader operational transformation that could act as a catalyst for a turnaround.
Earlier this month, C3ai reported preliminary fiscal first-quarter revenues below expectations, raising short-term concerns. However, the company continues to invest in AI-driven solutions and expand strategic partnerships, including a notable collaboration with Eletrobras in Brazil. These moves demonstrate that the firm is actively diversifying its offerings and positioning itself as a leading player in enterprise AI.
From an options market perspective, there is evidence of bullish sentiment building ahead of earnings. The $25 strike price out-of-the-money calls expiring on September 19 suggest that traders are betting on a near-term upside, signaling expectations of a possible recovery or positive surprise in the upcoming earnings report.
Leadership changes, while initially unsettling, often create opportunities for strategic shifts. A new CEO could accelerate operational efficiency, focus on high-growth initiatives, and highlight C3ai’s AI innovation, which has been a core strength of the company. Combined with ongoing product launches and partnership expansions, these factors could serve as a catalyst for a technical and fundamental reversal in the stock.
Traders may want to watch key support levels and the $25 strike options activity closely, as these indicators suggest that a bullish reversal could be on the horizon. With a renewed leadership team and continued AI innovation, C3.ai has the potential to regain momentum in the weeks leading up to earnings.
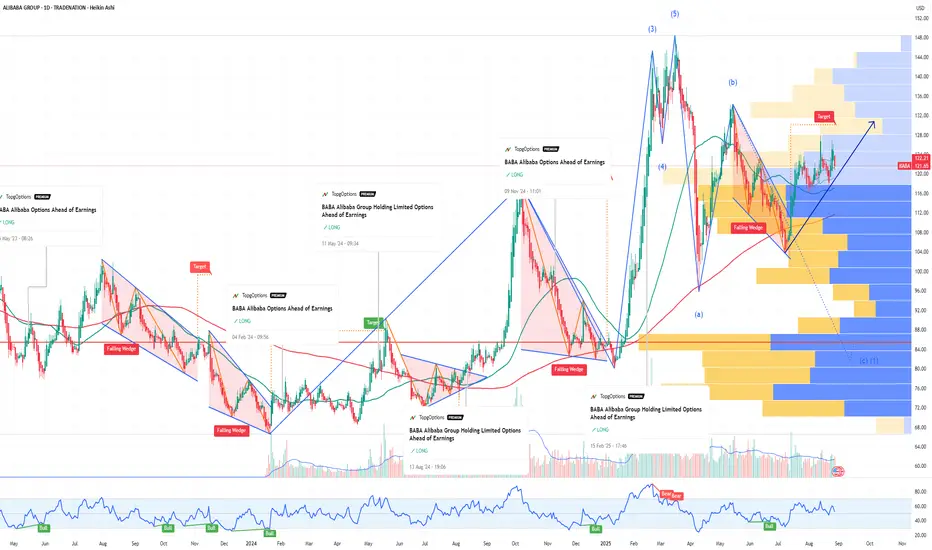
BABA Alibaba Options Ahead of EarningsIf you haven`t bought BABA before the rally:
Now analyzing the options chain and the chart patterns of BABA Alibaba Group Holding Limited prior to the earnings report this week,
I would consider purchasing the 135usd strike price Calls with
an expiration date of 2026-3-20,
for a premium of approximately $10.50.
If these options prove to be profitable prior to the earnings release, I would sell at least half of them.
Disclosure: I am part of Trade Nation's Influencer program and receive a monthly fee for using their TradingView charts in my analysis.
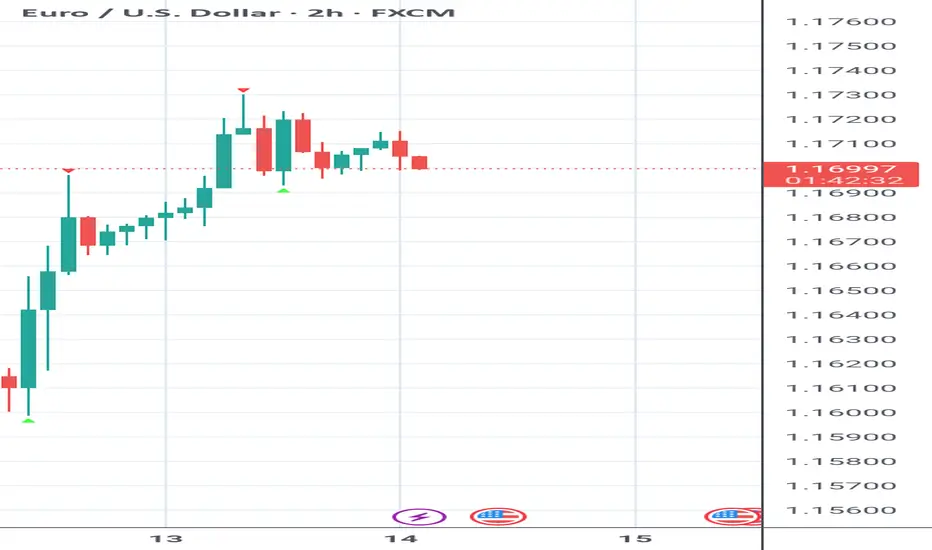
It bstargey that's use fractals and rsiI want to use fractal that give me signal alwys whre is apreart of 15 minutes pluse rsi period 1 with 90 sell 50 take profit 10 buy plus moving average 5 inside rsi
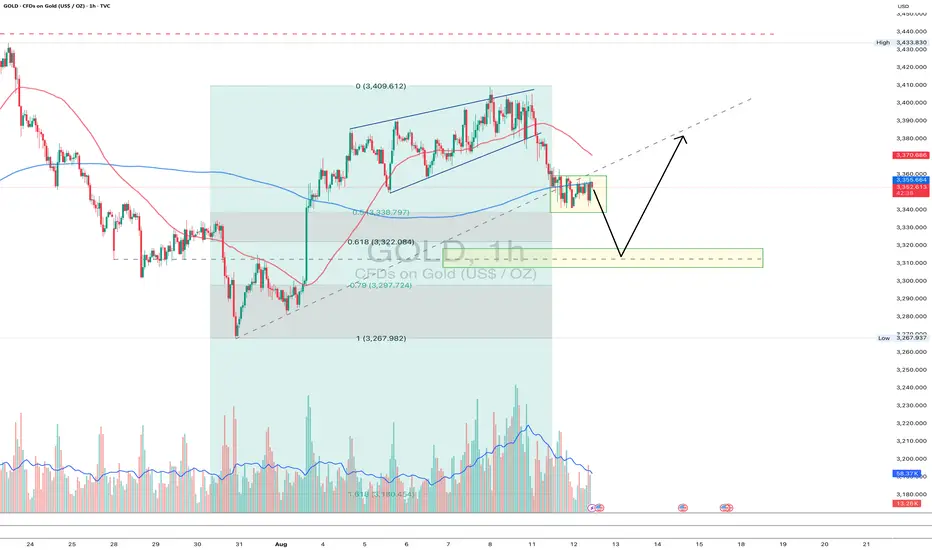
Gold 1H - test of 0.618 and possible reversalOn the hourly gold chart, price continues to correct after breaking out of the broadening channel. Current consolidation is forming below the 0.5 Fibo (3338), and the structure suggests a high probability of a drop toward the key 0.618 Fibo support zone at 3322–3310. This level also aligns with a previous major reversal point, adding to its significance. If the market reaches this zone and prints a reversal pattern, technical conditions will be set for a potential bullish move back toward 3370 and higher.
From a fundamental standpoint, gold trades in an environment of uncertainty, with the market assessing the Fed’s monetary policy outlook and reacting to shifts in inflation expectations. The absence of strong USD pressure leaves room for a recovery if large-scale buying appears near 3322.
Tactical plan: watch for price action in the 3322–3310 zone - a confirmed bullish signal could trigger longs targeting 3370 and 3400. A break below 3310 invalidates the bullish setup. As often happens with gold, the most interesting moves start right where most traders run out of patience.
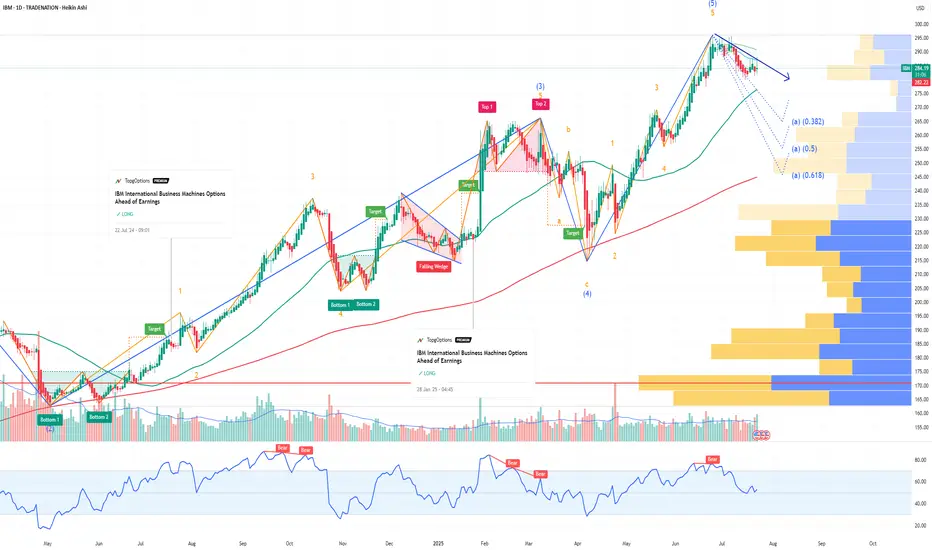
IBM International Business Machines Options Ahead of EarningsIf you haven`t bought IBM before the rally:
Now analyzing the options chain and the chart patterns of IBM International Business Machines prior to the earnings report this week,
I would consider purchasing the 290usd strike price Puts with
an expiration date of 2025-9-19,
for a premium of approximately $17.30.
If these options prove to be profitable prior to the earnings release, I would sell at least half of them.
Disclosure: I am part of Trade Nation's Influencer program and receive a monthly fee for using their TradingView charts in my analysis.
AI Insider Trading Before the Buyout? $5.8Million block of callsOn Friday, after the close, C3. ai announced CEO Thomas Siebel is stepping down, with a new leadership team taking over. The stock dropped almost 14% on the news, slashing its market cap and potentially making it irresistible for a takeover bid. They are looking for a new CEO!
Why this matters:
1. Perfect M&A Timing: C3. ai has proven AI tech, including contracts with the U.S. Department of Defense. The right acquirer could turn this into the next Palantir-style success story. Leadership changes often make buyouts easier.
2. Valuation Reset: The 14% drop gives strategic buyers a cheaper entry point, exactly when they might be circling.
3. Massive Call Buying Before News: Just last week, someone dropped $5.8M on Sept 19 $25 strike calls. That’s a high-conviction, short-dated bet. Nobody throws around that kind of money without expecting a big move, possibly insider knowledge of a deal or major contract.
4. Strategic Fit: Defense contractors or big tech companies could instantly expand their AI footprint by acquiring C3.ai.
Palantir built its empire by combining cutting-edge data analytics with deep government and defense relationships. C3. ai is following a similar blueprint and may be earlier in the curve:
1. Strong Defense Footprint: C3. ai already holds contracts with the U.S. Department of Defense and other government agencies, positioning it in the same secure, high-margin niche that powered Palantir’s growth.
2. Mission-Critical AI Solutions: Just like Palantir’s Gotham and Foundry platforms became embedded in government workflows, C3. ai’s AI suite is designed for enterprise and defense applications that are hard to replace once integrated.
3. Massive TAM (Total Addressable Market): The AI defense and enterprise analytics market is projected to grow exponentially over the next decade, mirroring the macro tailwinds Palantir rode after 2020.
4. Sticky Contracts: Government and defense clients tend to lock in long-term, high-value contracts once a system is deployed, creating predictable recurring revenue streams.
5. Potential for Commercial Expansion: Palantir went from mostly government to a healthy commercial mix. C3. ai could follow the same path, leveraging its defense credibility to win private-sector deals.
6. Strategic Acquisition Target: Big tech and defense primes would love to own a proven AI platform with federal clearance — just as Palantir’s unique positioning has made it a darling of Wall Street and a fortress against competition.
In short: C3. ai today could be where Palantir was a few years ago!
If acquired or scaled correctly, the upside could be just as explosive!
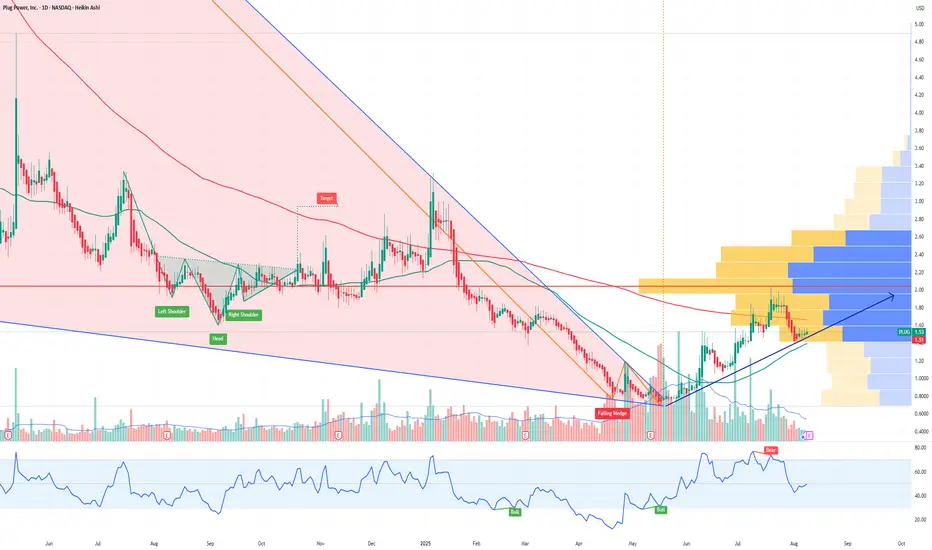
PLUG Plug Power Options Ahead of EarningsAnalyzing the options chain and the chart patterns of PLUG Plug Power prior to the earnings report this week,
I would consider purchasing the 6usd strike price in the money Calls with
an expiration date of 2027-1-15,
for a premium of approximately $0.0.49.
If these options prove to be profitable prior to the earnings release, I would sell at least half of them.
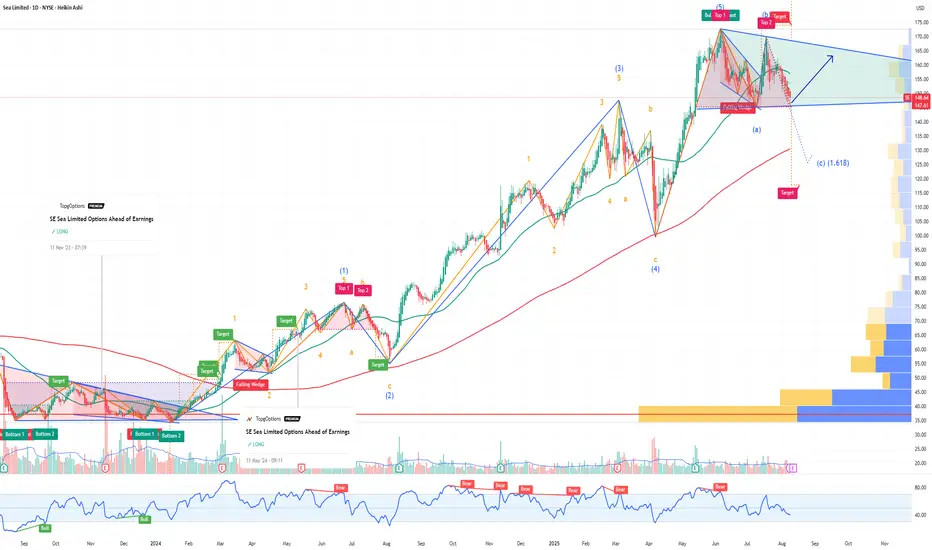
SE Sea Limited Options Ahead of EarningsIf you haven`t bought SE before the rally:
Now analyzing the options chain and the chart patterns of SE Sea Limited prior to the earnings report this week,
I would consider purchasing the 150usd strike price at the money Calls with
an expiration date of 2025-9-12,
for a premium of approximately $9.00.
If these options prove to be profitable prior to the earnings release, I would sell at least half of them.
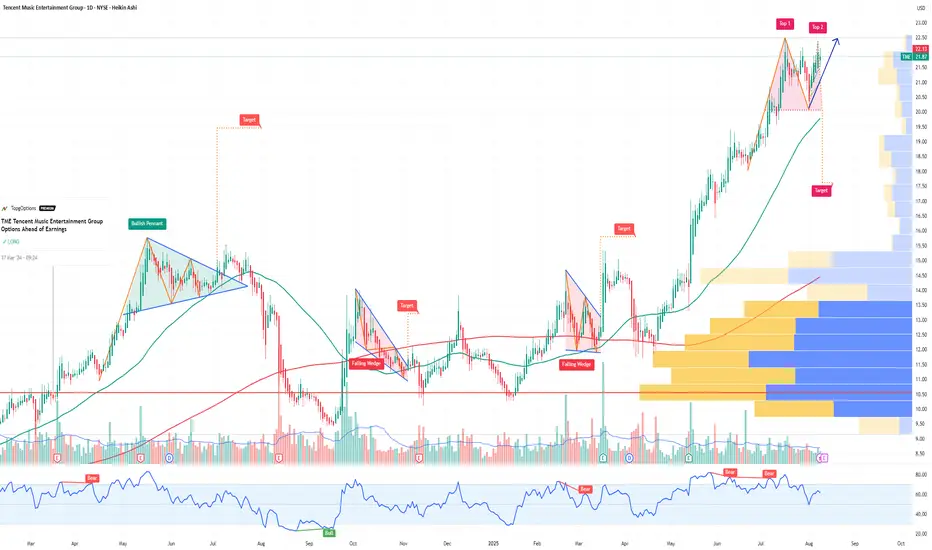
TME Tencent Music Entertainment Group Options Ahead of EarningsIf you haven`t bought TME before the rally:
Now analyzing the options chain and the chart patterns of TME Tencent Music Entertainment Group prior to the earnings report this week,
I would consider purchasing the 23usd strike price Calls with
an expiration date of 2025-9-19,
for a premium of approximately $1.00.
If these options prove to be profitable prior to the earnings release, I would sell at least half of them.
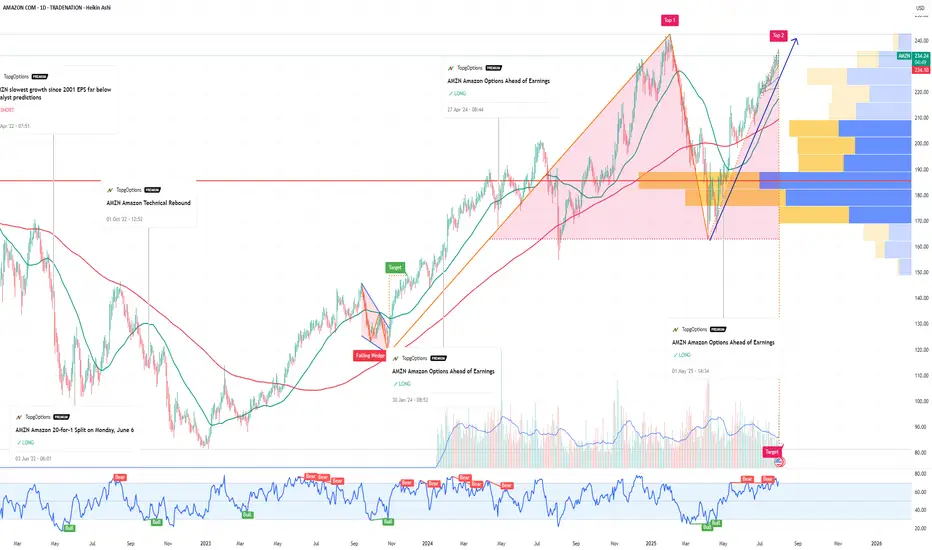
AMZN Amazon Options Ahead of EarningsIf you ahven`t bought the recent dip on AMZN:
Now analyzing the options chain and the chart patterns of AMZN Amazon prior to the earnings report this week,
I would consider purchasing the 245usd strike price Calls with
an expiration date of 2025-9-19,
for a premium of approximately $7.02.
If these options prove to be profitable prior to the earnings release, I would sell at least half of them.
Disclosure: I am part of Trade Nation's Influencer program and receive a monthly fee for using their TradingView charts in my analysis.
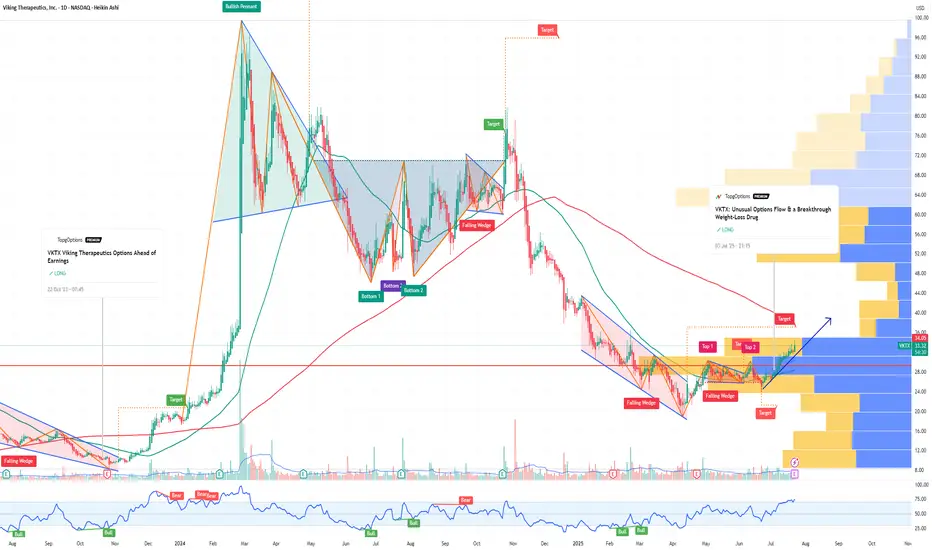
VKTX Viking Therapeutics Options Ahead of EarningsIf you haven`t bought VKTX before the breakout:
Now analyzing the options chain and the chart patterns of VKTX Viking Therapeutics prior to the earnings report this week,
I would consider purchasing the 40usd strike price Calls with
an expiration date of 2026-1-16,
for a premium of approximately $7.65.
If these options prove to be profitable prior to the earnings release, I would sell at least half of them.
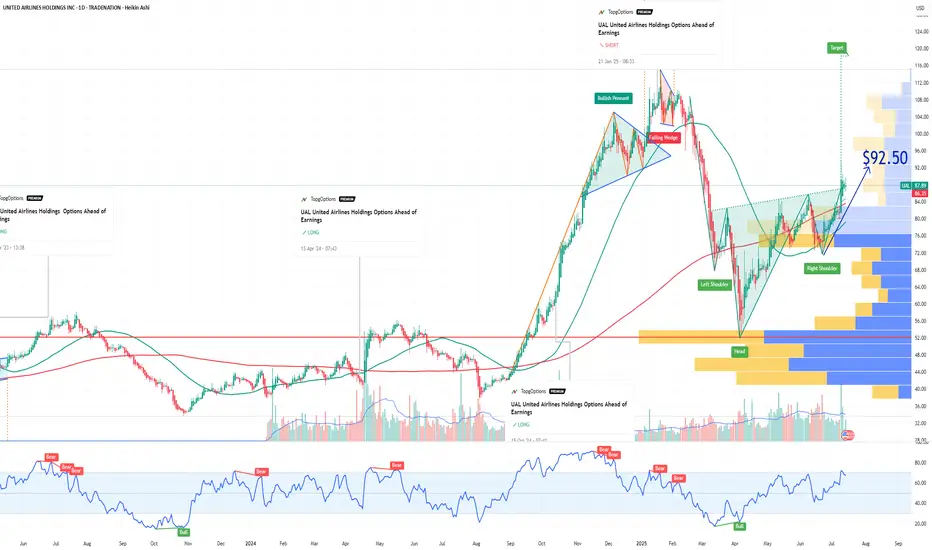
UAL United Airlines Holdings Options Ahead of EarningsIf you haven`t exited UAL before the recent selloff:
Now analyzing the options chain and the chart patterns of UAL United Airlines Holdings prior to the earnings report this week,
I would consider purchasing the 92.5usd strike price Calls with
an expiration date of 2025-9-19,
for a premium of approximately $5.12.
If these options prove to be profitable prior to the earnings release, I would sell at least half of them.
Bitcoin Breaks All-Time High: What’s Next?Bitcoin (BTC) has once again captured the world’s attention by smashing through its previous all-time high (ATH). This milestone has sparked excitement and speculation across the crypto community and beyond. But the key question remains: Will BTC continue its upward trajectory, or is a correction on the horizon?
Long-Term Outlook: The Bullish Case
In the long run, the fundamentals for Bitcoin remain strong. Several factors support a positive outlook:
Institutional Adoption: More institutional investors are entering the market, providing greater liquidity and legitimacy.
Scarcity and Halving Cycles: Bitcoin’s fixed supply and periodic halving events historically drive long-term price appreciation.
Macro Trends: Ongoing concerns about inflation and fiat currency devaluation continue to make BTC an attractive hedge.
Given these dynamics, we believe Bitcoin’s long-term trajectory remains upward.
Short-Term Caution: A Correction May Be Coming
While the long-term view is optimistic, the short-term picture may be less rosy:
Overheated Market Indicators: Rapid price surges often lead to overbought conditions, increasing the likelihood of a pullback.
Profit-Taking: After breaking ATH, some investors may lock in gains, adding selling pressure.
Technical Resistance: Historical patterns suggest that corrections often follow major breakouts.
We anticipate a potential correction, possibly pulling BTC back to the $90,000 range. This adjustment could unfold in the coming week or weeks as the market digests recent gains.
What Should Investors Do?
Stay Calm: Volatility is part of the crypto landscape. Corrections are healthy for sustainable growth.
Focus on Fundamentals: Remember why you invested in BTC in the first place.
Consider Dollar-Cost Averaging: Spreading out purchases can help mitigate the impact of short-term swings.
Conclusion
Bitcoin’s break above its all-time high is a testament to its enduring appeal and the growing confidence of investors. While a short-term correction may be likely, the long-term case for BTC remains compelling. As always, prudent risk management and a focus on fundamentals are key to navigating the exciting—and sometimes turbulent—world of crypto.
Do not consider it as investment advice.
#crypto #bitcoin #analysis
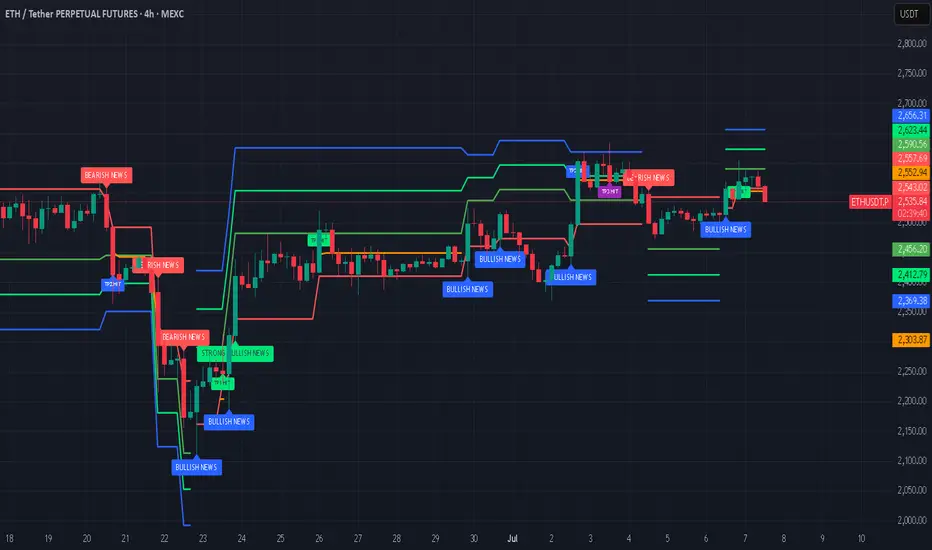
ETH - Should I go long?Ethereum (ETH) is currently positioned at a critical juncture, with multiple technical and fundamental indicators suggesting the potential for a significant move ahead.
Current Price and Momentum: As of the latest real-time data, ETH is trading at $2,549.97, having recently started a fresh increase above the $2,520 zone. The price is above both the $2,550 level and the 100-hourly Simple Moving Average, indicating short-term bullish momentum.
Key Resistance Levels: The immediate resistance is near $2,600, followed by $2,620 and a major barrier at $2,650. A decisive break above $2,650 could open the path toward $2,720 and potentially $2,800 in the near term.
Support Levels: On the downside, $2,520 is a key support zone. A sustained drop below this could trigger declines toward $2,500 or even $2,420, but as long as ETH holds above $2,520, the bullish structure remains intact.
On-Chain and Institutional Signals: Long-term holders have been accumulating ETH, and institutional inflows have surged, with over $750 million invested recently. This accumulation, alongside strong ETF inflows and rising staking activity, points to growing confidence and could act as a catalyst for a major price move.
Technical Patterns: ETH is consolidating above critical moving averages and within bullish chart formations (such as ascending triangles and coiling structures). These patterns often precede significant breakouts, especially when accompanied by increasing trading volumes and improving momentum indicators.
Market Sentiment: While short-term indicators show some cooling, the broader trend remains bullish. Analysts note that if ETH can break above the current resistance cluster, it could ignite a new wave of bullish momentum and set the stage for a broader breakout.
In summary: Ethereum is at a pivotal resistance zone. If it can break and hold above $2,600–$2,650, analysts expect a strong move higher, with targets at $2,800. Institutional inflows, strong on-chain accumulation, and bullish technical setups all support the case for a significant upside move in the coming weeks or months, provided key support levels are maintained.
Note that a possible correction of Bitcoin (which essentially will result in a drop of the entire crypto market) is possible in the next weeks.
#crypto #eth #btc #bitcoin #ethereum #analysis #trading #portfolio #long #algorithm #buysellsignals #tradingsignals #bullrun
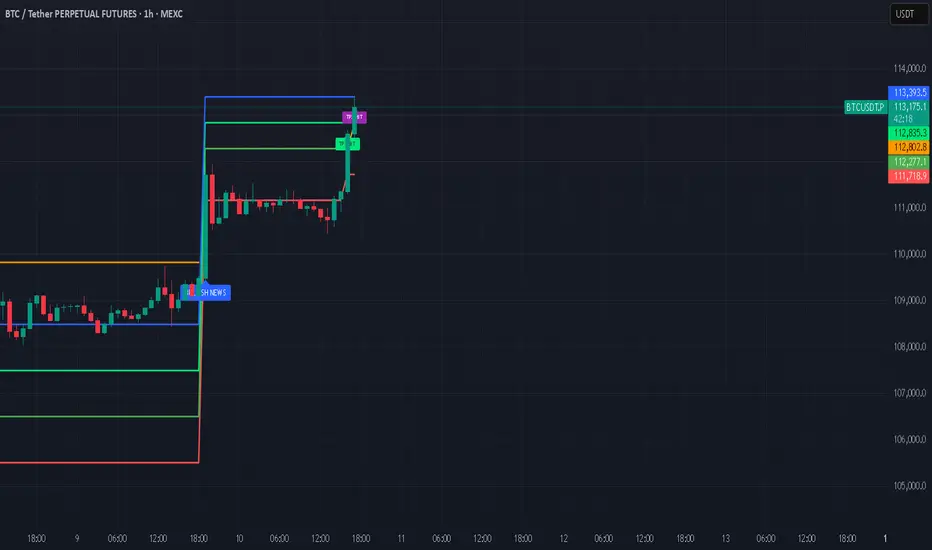
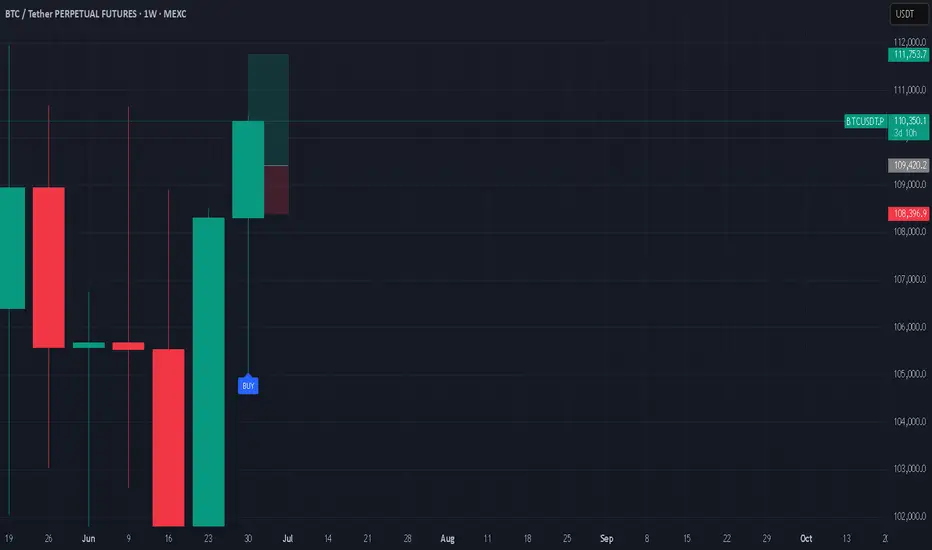
BTC: Long Position1W buy signal at $109K. Entered Long Position & currently 10 per cent in profit. BTC is going for a new ATH in the next days.
#crypto #bitcoin #trading #buysellsignals #algorithm #bot
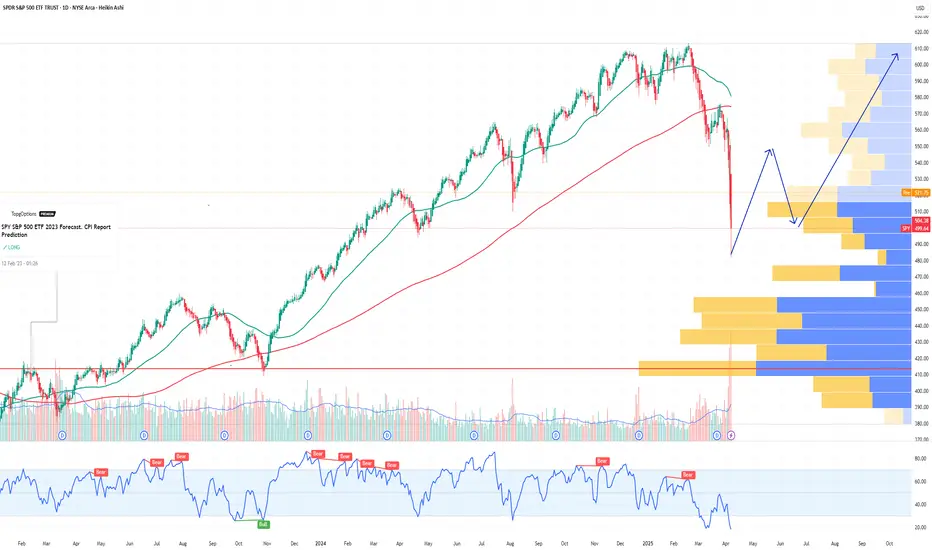
SPY S&P 500 ETF Potential W-Shaped Recovery Forming We may be witnessing the formation of a W-shaped recovery on the SPY (S&P 500 ETF) – a classic double-bottom structure that often signals a strong reversal after a period of correction or volatility. Let’s dive into the technicals and what this could mean in the sessions ahead.
🔍 The Technical Setup:
SPY recently tested key support around the $485-$500 zone, bouncing off that area twice in the past few weeks. This gives us the left leg of the W and the first bottom. After a modest relief rally to ~$520, we saw another pullback – but this second dip failed to break below the first bottom, a hallmark of the W-pattern.
As of today, SPY is starting to reclaim ground toward the $517-$520 resistance zone. If bulls can push through this neckline area, especially with volume confirmation, we could see a breakout that targets the $530-$535 area in the short term.
🔑 Key Levels to Watch:
Support: $490-$500 (double-bottom support zone)
Neckline/Resistance: $530
Breakout Target: $550 (previous highs)
Invalidation: A break below $490 with volume could invalidate the W-recovery idea and shift bias bearish.
📊 Momentum & Volume:
RSI is climbing back above the 50 level – bullish momentum building.
MACD shows a potential crossover forming, hinting at a shift in trend.
Watch for increasing buy volume as SPY approaches the neckline – that’s where the bulls will need to step up.
🧠 Macro & Earnings Angle:
Don’t forget – we’re entering a heavy earnings season and rate cut expectations are still a wildcard. A dovish tone from the Fed and strong corporate results could be the fuel that sends SPY higher to complete this W-shaped recovery.
🧭 Final Thoughts:
This is a high-probability setup if neckline resistance is broken cleanly. Wait for confirmation before going heavy – fakeouts are common in double-bottom scenarios. If we do get the breakout, we may be looking at a broader market rebound going into summer.
🔔 Set alerts near $525. A confirmed breakout could mean the bulls are back in charge.
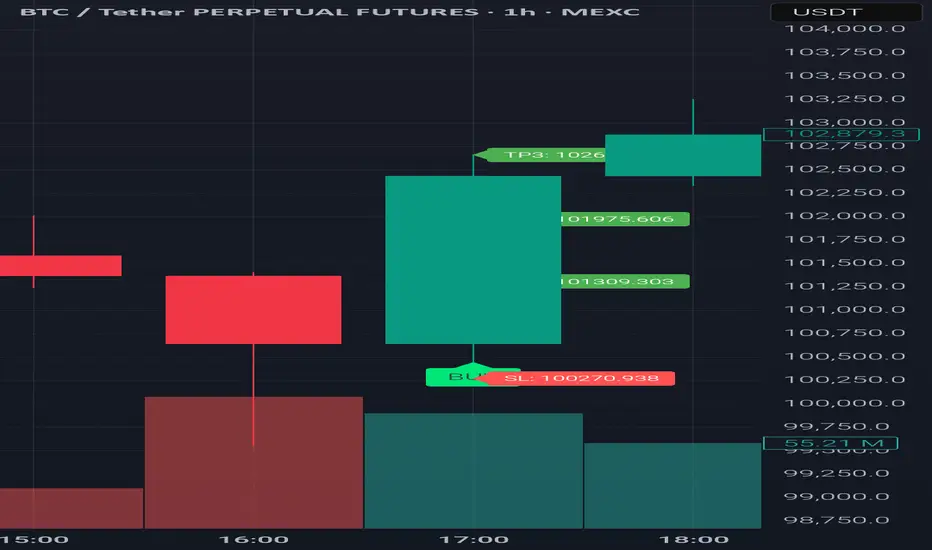
Instructions on how to potentially use the SIG[TP/SL (1H-4H-1D)]It's a HF algorithm for the 1H,4H,1D Time-Frames. Which means whenever the instrument reaches the open price, the algo might give a lot of signals and sometimes it might give plenty of reverse signals. In order to use the specific algo in the best possible way, here's a helpful guide on how to potentially use it:
1)Wait for the instrument to reach the open price.
2) ALWAYS, Follow the signals, e.g: We are at the open price. If it indicates buy signal, then open a long position. If for example 5 seconds later (again at the open price) it indicates a sell signal, then reverse the long position into a short position, and keep doing it until it gives a signal, that will be followed by a good sized candle.
3) The safest way is to close the trade when the price reaches the potential TP1.
4) Happy Trading!
*The text above is not an investment advice, and it does not guarantee any profit.
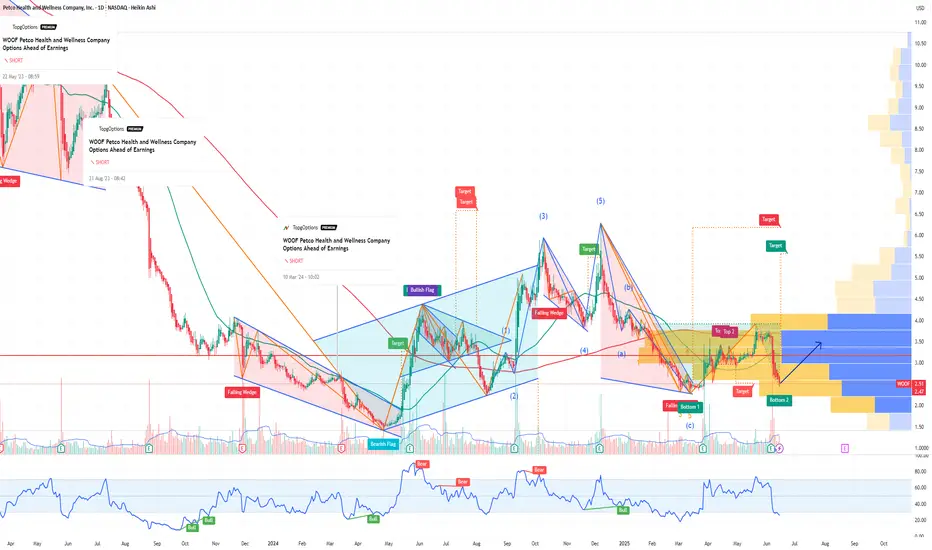
WOOF Petco Health & Wellness Company Potential Bullish ReversalIf you haven`t sold WOOF before this major retracement:
WOOF Petco Health and Wellness Company has experienced a notable selloff recently, with its stock price declining to around $2.47 as of mid-June 2025. However, several fundamental and technical factors suggest that WOOF could be poised for a meaningful reversal and upside recovery in the near to medium term.
1. Attractive Valuation and Upside Potential
Despite the recent pullback, Petco’s stock is trading at a compelling valuation relative to its long-term growth potential.
Price forecasts for 2025 indicate an average target of approximately $3.55, representing a 43.7% upside from current levels.
More optimistic scenarios project highs up to $7.05 within this year, suggesting significant room for a rebound if market sentiment improves.
Long-term forecasts are even more bullish, with price targets of $14 by 2030 and as high as $77 by 2040, reflecting confidence in Petco’s strong market position and growth prospects.
2. Resilient Business Model in a Growing Pet Care Market
Petco operates in the resilient pet care and wellness industry, which benefits from secular trends such as increased pet ownership, premiumization of pet products, and growing consumer spending on pet health.
The company’s omni-channel approach—combining e-commerce with physical stores and veterinary services—positions it well to capture multiple revenue streams.
Petco’s focus on health and wellness services, including veterinary care and pet insurance, provides higher-margin growth opportunities that can drive profitability improvements.
3. Technical Signs of Stabilization and Potential Reversal
After the recent selloff, WOOF’s stock price has found some support near the $2.40–$2.50 level, with increased trading volumes indicating growing investor interest.
The stock’s recent modest gains and stabilization suggest that selling pressure may be easing, setting the stage for a potential technical rebound.
Options market activity and analyst upgrades reflect improving sentiment.
4. Improving Operational Execution and Financial Health
Petco has been investing in expanding its veterinary services and digital capabilities, which are expected to contribute to revenue growth and margin expansion.
The company’s recent earnings calls and financial reports highlight progress in cost management and customer engagement initiatives.
Strong cash flow generation and manageable debt levels provide flexibility to invest in growth and weather macroeconomic uncertainties.
5. Market Sentiment and Analyst Support
While some analysts remain cautious, the overall sentiment is shifting toward a more constructive outlook, with several price target upgrades and “hold” to “buy” rating adjustments.
The combination of attractive valuation, improving fundamentals, and sector tailwinds is likely to attract renewed institutional interest.
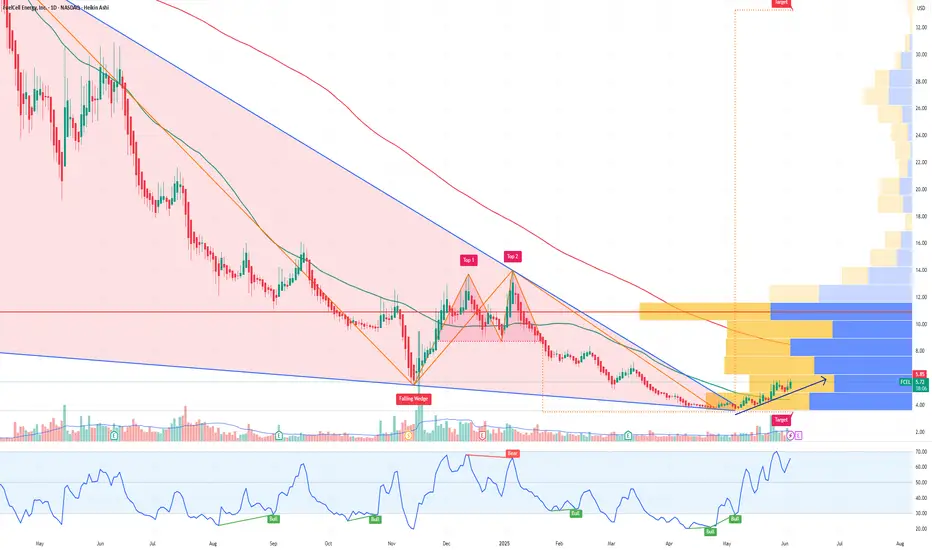
FCEL FuelCell Energy Options Ahead of EarningsAnalyzing the options chain and the chart patterns of FCEL FuelCell Energy prior to the earnings report this week,
I would consider purchasing the 5usd strike price Calls with
an expiration date of 2025-7-3,
for a premium of approximately $1.10.
If these options prove to be profitable prior to the earnings release, I would sell at least half of them.
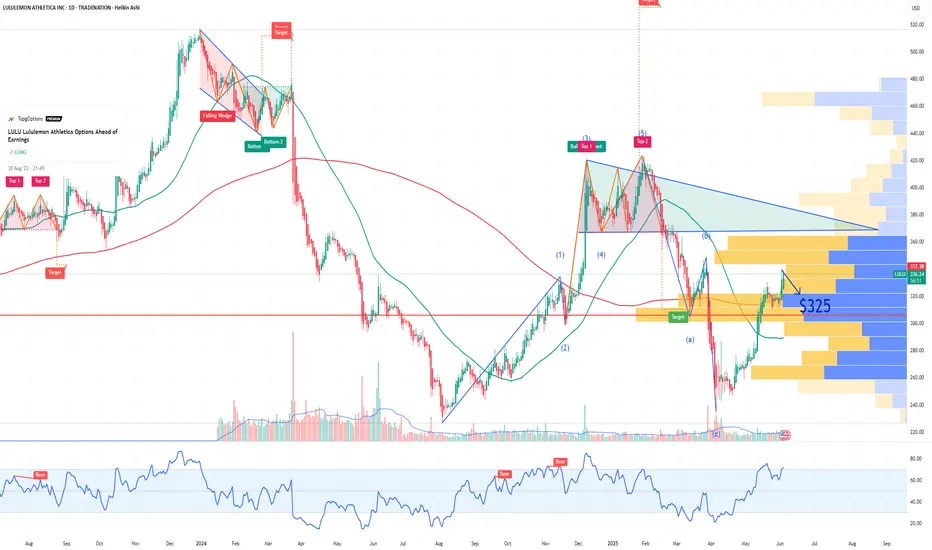
LULU Lululemon Athletica Options Ahead of EarningsIf you haven`t bought LULU before the previous earnings:
Now analyzing the options chain and the chart patterns of LULU Lululemon Athletica prior to the earnings report this week,
I would consider purchasing the 325usd strike price Puts with
an expiration date of 2025-6-6,
for a premium of approximately $10.05.
If these options prove to be profitable prior to the earnings release, I would sell at least half of them.
Disclosure: I am part of Trade Nation's Influencer program and receive a monthly fee for using their TradingView charts in my analysis.
S SentinelOne Options Ahead of EarningsIf you haven`t bought S before the recent rally:
Now analyzing the options chain and the chart patterns of S SentinelOne prior to the earnings report this week,
I would consider purchasing the 20usd strike price Calls with
an expiration date of 2025-9-19,
for a premium of approximately $2.50.
If these options prove to be profitable prior to the earnings release, I would sell at least half of them.
