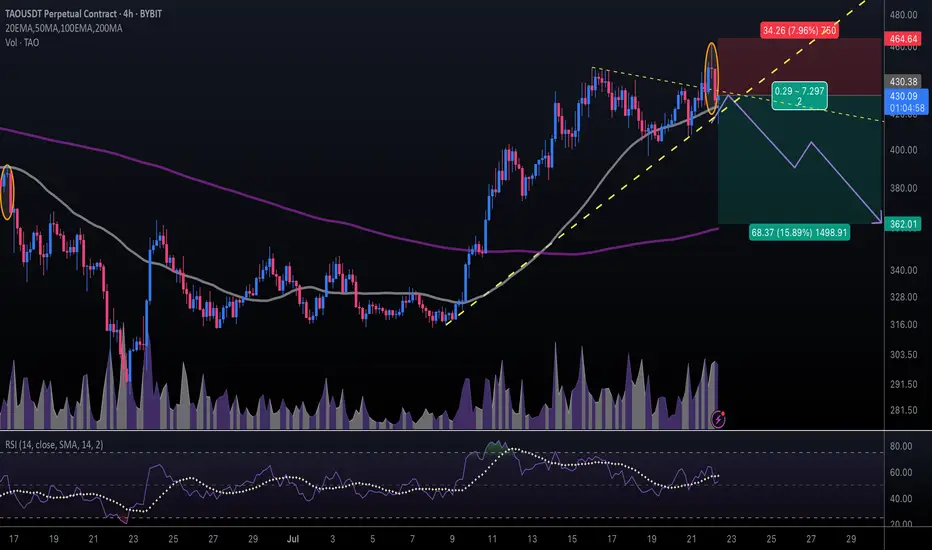
#TAOUSDT #4h (ByBit) Ascending trendline near breakdownBittensor printed an evening doji star deviation, a retracement down to 200 MA support seems next.
⚡️⚡️ #TAO/USDT ⚡️⚡️
Exchanges: ByBit USDT
Signal Type: Regular (Short)
Leverage: Isolated (5.0X)
Amount: 5.0%
Entry Targets:
1) 430.38
Take-Profit Targets:
1) 362.01
Stop Targets:
1) 464.64
Published By: @Zblaba
GETTEX:TAO BYBIT:TAOUSDT.P #4h #Bittensor #AI #DePIN bittensor.com
Risk/Reward= 1:2.0
Expected Profit= +79.4%
Possible Loss= -39.8%
Estimated Gaintime= 1 week
Bybit
July 22 Bitcoin Bybit chart analysisHello
It's a Bitcoin Guide.
If you "follow"
You can receive real-time movement paths and comment notifications on major sections.
If my analysis was helpful,
Please click the booster button at the bottom.
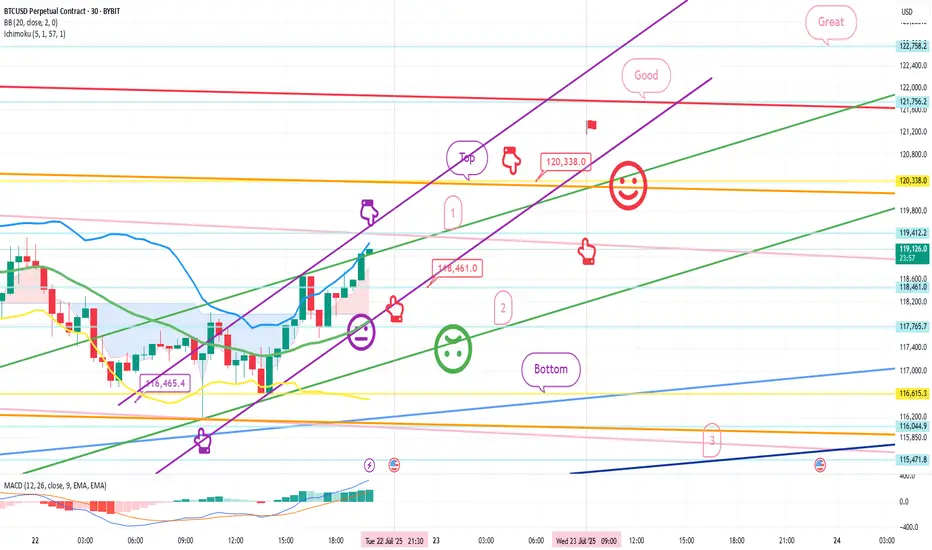
This is Bitcoin's 30-minute chart.
Nasdaq indicators will be released at 9:30 in a little while.
Although Bitcoin's mid-term pattern is broken,
it looks like a strong upward trend based on signals and candlestick positions.
In the case of Nasdaq, the 6-hour and 12-hour charts MACD dead cross is in progress,
and even if there is no plunge and only a sideways movement,
it seems likely that today's strategy will be successful.
In the bottom left, from the analysis article on the 18th,
the final long position entry point of $116,465.4 Bottom
is connected as is.
*Red finger movement path
One-way long position strategy
1. $118,461.9 long position entry section / green support line breakout, stop loss price
2. $120,338 long position 1st target -> Good, Great in order of target price
See the 1st section at the top as a touch section for an upward wave rather than a short position entry,
and if this section breaks through right away, an upward trend can be connected.
If the purple parallel line support line is maintained without breaking away,
there is a possibility of a vertical rise.
If the top section is touched,
after the first liquidation,
it would be good to use the 1st section to re-enter a long position.
The 2nd section at the bottom is important,
and if it is pushed to this section according to the movement of Nasdaq today,
it can fall strongly.
Please check the real-time support line shape.
From the breakout, Bottom -> 3 sections are open.
If you touch the 3rd section after tomorrow, the mid-term pattern will be restored.
This is the 12+ day section.
Up to this point, I ask that you simply use my analysis for reference and use only.
I hope that you will operate safely with the principle of trading and stop loss.
Thank you.
July 18 Bitcoin Bybit chart analysisHello
It's a Bitcoin Guide.
If you "follow"
You can receive real-time movement paths and comment notifications on major sections.
If my analysis was helpful,
Please click the booster button at the bottom.
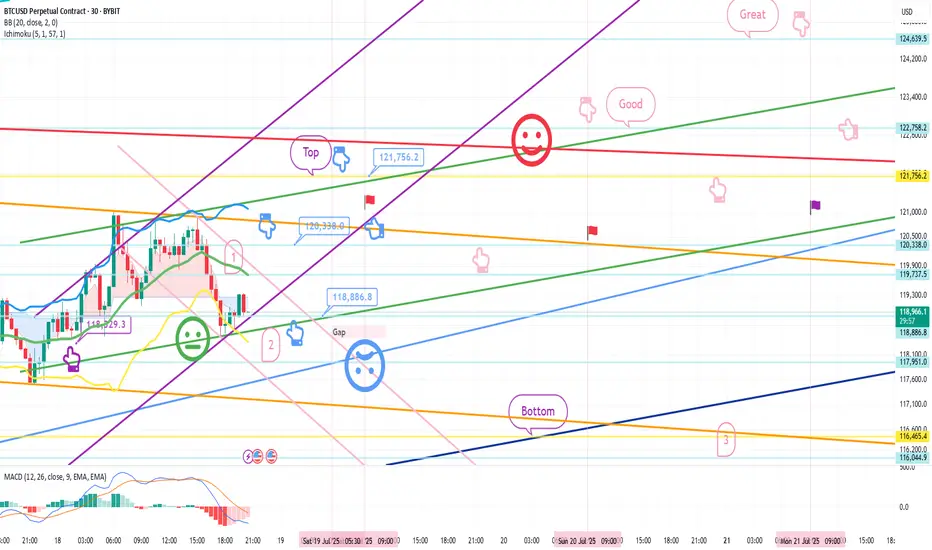
Bitcoin 30-minute chart.
There is no Nasdaq indicator announcement today.
The mid-term pattern was broken in the morning wave,
but I proceeded as safely as possible.
At the bottom left, I connected the final long position switching section in the analysis article on the 15th with a purple finger.
*When the blue finger moves,
Bidirectional neutral
Short->Long or long waiting strategy
1. Short position entry section of $120,338 / Stop loss price when orange resistance line is broken
2. Long position switching of $118,886.8 / Stop loss price when blue support line is broken
3. Long position 1st target of $121,756.2 -> Target price in the order of Good and Great
If it falls immediately from the current position or
touches the top once and falls, it is a vertical decline condition.
If it falls immediately, it is the final long waiting in section 2.
(When the sky blue support line breaks, the stop loss price is the same)
From the sky blue support line break, the 6+12 section is where the mid-term pattern is restored,
and it is roughly the bottom section.
If the strategy is successful, I have left a simulation with a pink finger on the right,
so please check the switching and profit-taking section,
and operate safely in each position, long, short, and no position, based on whether the purple support line breaks from the current position.
From the green support line break, the low point of today's daily candle is broken,
so it would not be good for a long position, right?
Up to this point, please use my analysis article only for reference and use,
and operate safely with principle trading and stop loss price.
Thank you.
July 14 Bitcoin Bybit chart analysisHello
It's a Bitcoin Guide.
If you "follow"
You can receive real-time movement paths and comment notifications on major sections.
If my analysis was helpful,
Please click the booster button at the bottom.
This is a Bitcoin 30-minute chart.
There is no separate Nasdaq indicator announcement.
Nasdaq upper gap reversal condition and
Bitcoin is moving sideways after a sharp rebound until the afternoon.
I created today's strategy based on the vertical decline condition based on the 5-minute trend reversal in Tether Dominance.
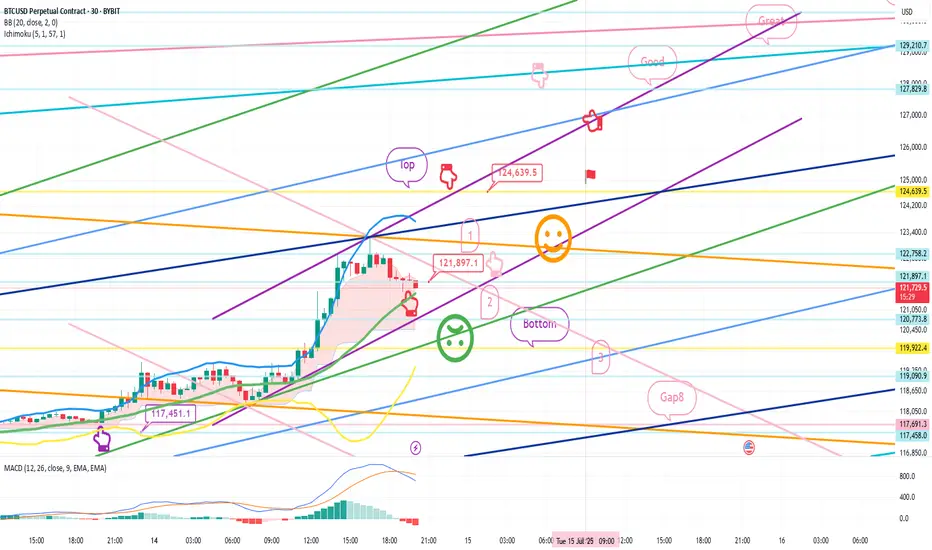
On the lower left, I connected the long position entry section of 117,451.1 dollars that I entered on the 11th.
* In the case of the red finger movement path,
This is a one-way long position
current position chase purchase strategy.
1. Chasing purchase at 121,897.1 dollars / Stop loss price when the green support line is broken
2. 124,639.5 dollars long position 1st target -> Good, Great in order of target price
Since I left a simulation in the middle,
I think it would be good to use it for re-entry after liquidating the long position.
The movement within the 1st section at the top and the 2nd section at the bottom
is an extreme sideways movement, and from a long position,
if it succeeds in rebounding within the 2nd section, it becomes a strong upward condition.
From the 3rd section breakout today,
the low point is broken in the newly created weekly and daily chart candles this week,
so please note that the upward trend may be delayed.
The next support line is the Gap8 section created last week.
Up to this point, I ask that you simply refer to and utilize my analysis
and I hope that you operate safely with principle trading and stop loss prices.
Thank you.
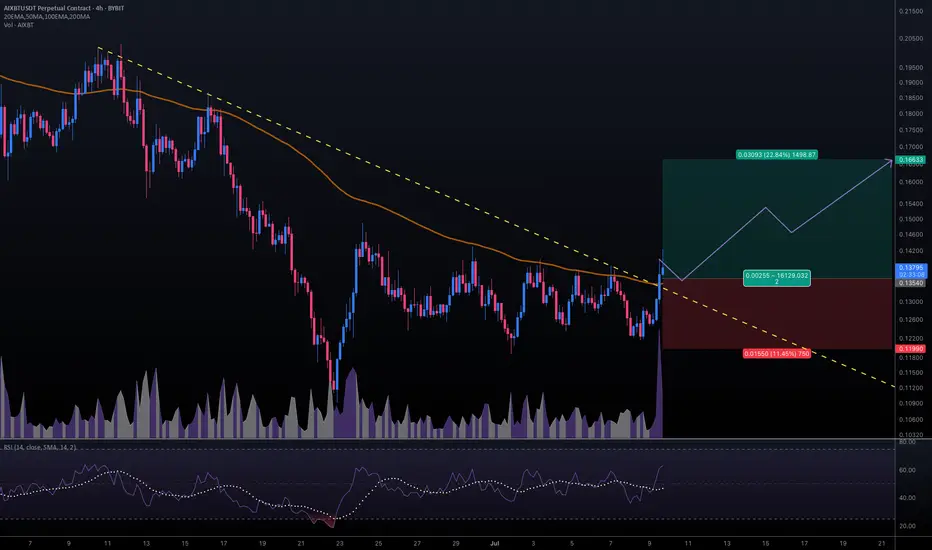
#AIXBTUSDT #4h (ByBit) Descending trendline breakout$AIXBT just regained 100EMA support and looks ready for short-term recovery.
BYBIT:AIXBTUSDT.P aixbt.tech
July 10 Bitcoin Bybit chart analysisHello
It's a Bitcoin Guide.
If you "follow"
You can receive real-time movement paths and comment notifications on major sections.
If my analysis was helpful,
Please click the booster button at the bottom.
Here is the Bitcoin 30-minute chart.
There will be a Nasdaq indicator announcement at 9:30 in a little while.
There is a high possibility that Nasdaq will shake up and down significantly,
but Bitcoin still looks safe in terms of signal and pattern.
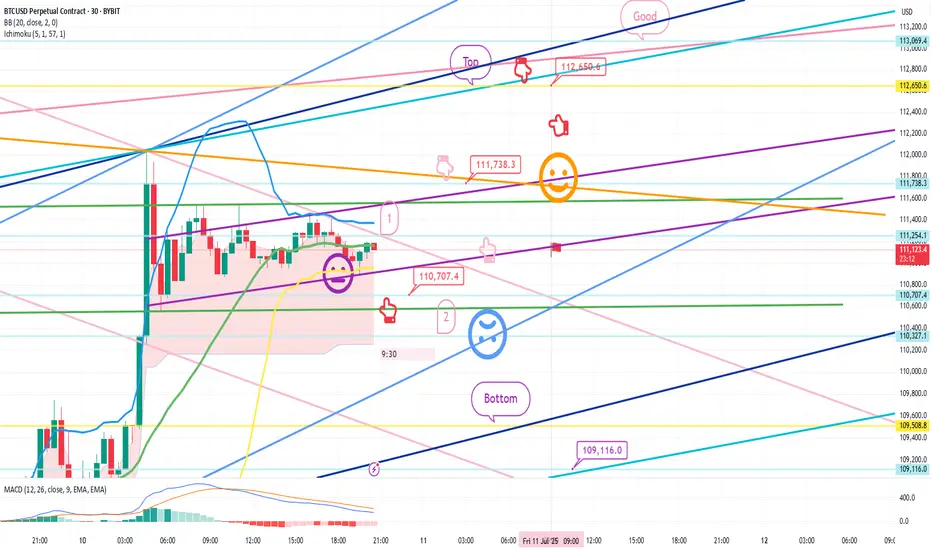
In the analysis article on July 7,
I connected the strategy as it was at the last long position entry point of 107,484 dollars.
*When the red finger moves,
it is a one-way long position strategy.
1. 110,707.4 dollars long position entry point / stop loss price when the sky blue support line breaks
2. 111,783.3 dollars long position 1st target -> Top 2nd -> Good 3rd target price
The 1st section at the top is today's best short position entry point,
and the 2nd section at the bottom is a sideways market.
In the middle, with a pink finger,
I left a re-entry position after liquidating a long position, so
I think it would be good to use it.
From the breakout of the sky blue support line, it can be pushed to Bottom -> 109,116 dollars.
The report is not yet renewed,
but from now on, it will be very important, right?
This week, it seems like it will continue to shake up and down,
so I hope you operate safely with principle trading and stop loss prices.
Thank you.
July 7 Bitcoin Bybit chart analysisHello
This is Bitcoin Guide.
If you "follow"
You can receive real-time movement paths and comment notifications on major sections.
If my analysis was helpful,
Please click the booster button at the bottom.
Here is the Bitcoin 30-minute chart.
There is no separate Nasdaq indicator announcement today.
I think the Nasdaq lower gap section retracement will be the focus.
Recently, sideways movement or adjustments have been coming out before the trend,
So I proceeded safely in preparation for variables.
*When the blue finger moves
Bidirectional neutral
Short->long switching or 2nd section long waiting strategy
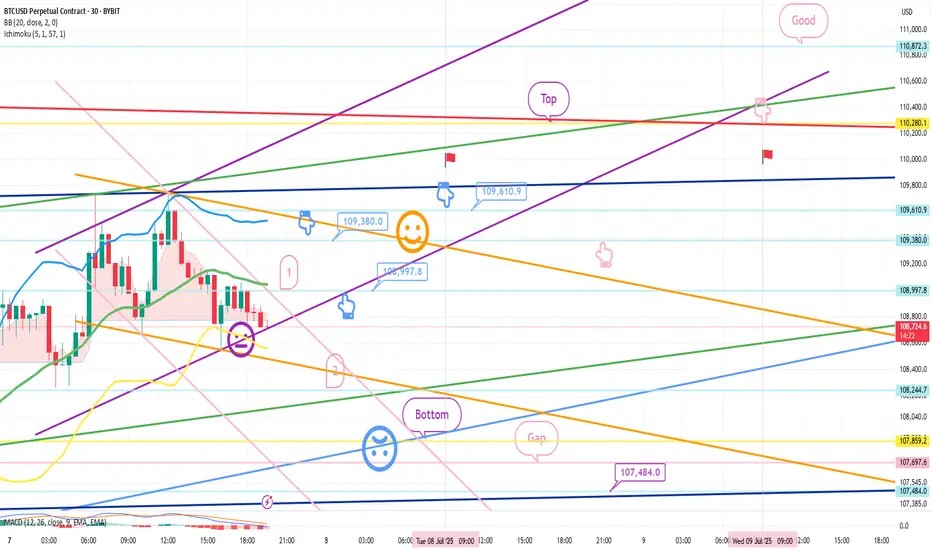
1. $109,380 short position entry section / cut-off price when orange resistance line is broken
2. $108,997.8 long position switching / cut-off price when purple support line is broken
3. $109,610.9 long position 1st target -> Top 2nd target -> Good 3rd target
It seems important whether the purple support line is broken from the current position. If the first section at the top touches 108,997.8 dollars and comes down,
it may become a vertical decline section.
If it comes down right away, it is a long-waiting strategy in the final second section,
and if it deviates from the bottom section today
(6+12 pattern)
because it is a full candle when the gap section is touched,
it may fall to 107,484 dollars indicated at the very bottom.
I have important work to do tomorrow,
so I will take a day off and come back on Wednesday.
Please use my analysis so far for reference and
I hope you operate safely with principle trading and stop loss prices.
Thank you.
July 4 Bitcoin Bybit chart analysisHello
This is Bitcoin Guide.
If you "follow"
You can receive real-time movement paths and comment notifications on major sections.
If my analysis was helpful,
Please click the booster button at the bottom.
Here is the Bitcoin 30-minute chart.
There is no Nasdaq index announcement today.
There is a possibility that Nasdaq will fall sharply,
but even if it moves sideways, the probability of the strategy succeeding increases.
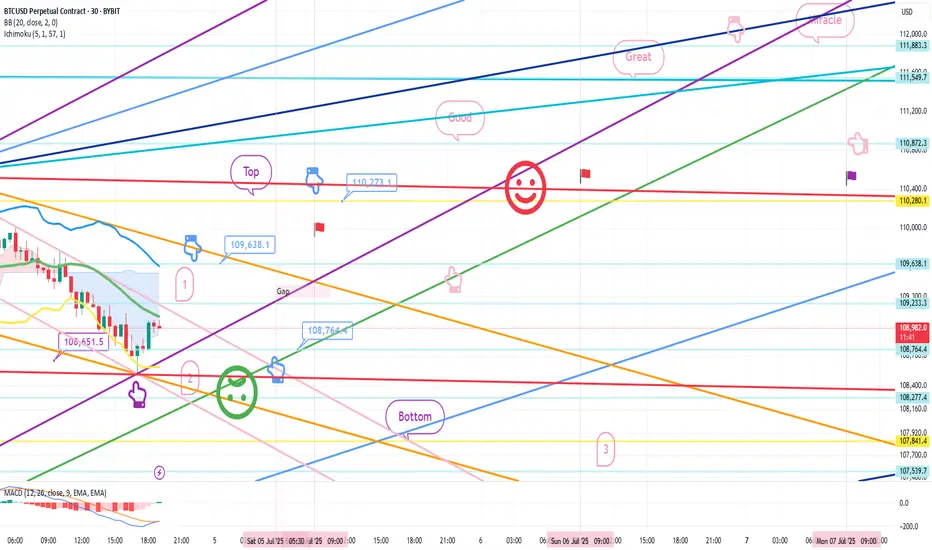
On the left, with the purple finger,
I connected the 2nd section of the long position that I entered yesterday.
*When the blue finger moves,
Bidirectional neutral
Short->Long or long waiting strategy
1. 109,638.1 dollars short position entry section / cut-off price when orange resistance line is broken
2. 108,764.4 dollars long position switching / cut-off price when green support line is broken
3. 110,273.1 dollars long position 1st target -> target price in order from Miracle
If the strategy is successful, I left a simulation with the pink finger,
so please refer to it.
Those who held long positions yesterday, please check if the purple support line is broken,
If it falls immediately from the current position or
If the pink resistance line is not broken when the 1st section at the top is touched,
It is a vertical decline section,
And if the 109,638.1 dollar short position entry section at the top is not touched,
It is a long waiting strategy at the 2nd section at the bottom.
I think it would be good to think of it as a game in the 1+4 section.
From the 2nd section breakout, I have marked the Bottom -> 3rd section at the bottom.
Up to this point, please just refer to and use my analysis,
I hope you operate safely with principle trading and stop loss prices.
Thank you for your hard work this week.
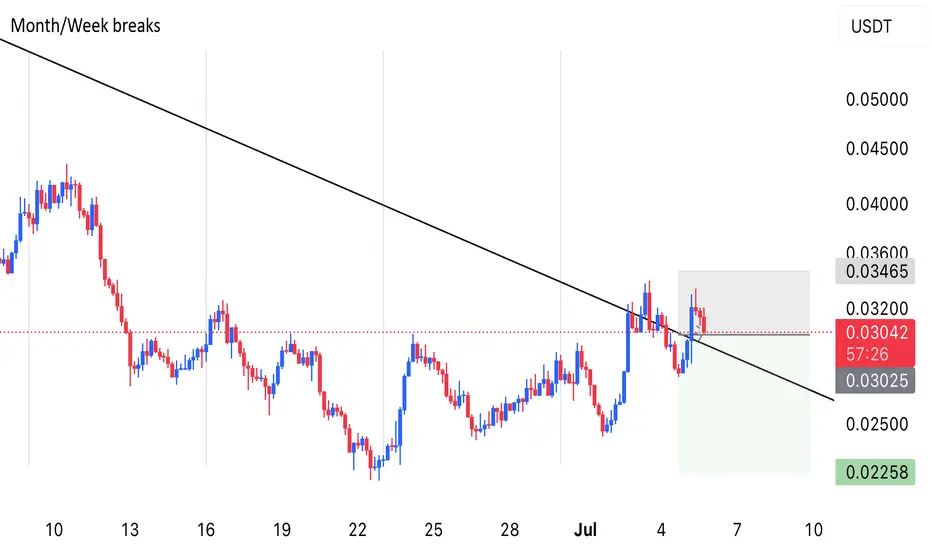
AVAAIUSDT.P 4H SHORTPrice did a bearish trendline third touch and printed a strong bearish engulfing signal. Short position and at 0.03050 with stops at 0.03450. I expect a sell off to 0.02250.
What are your thoughts on this ?
July 3 Bitcoin Bybit chart analysis
Hello
This is Bitcoin Guide.
If you "follow"
You can receive real-time movement paths and comment notifications on major sections.
If my analysis was helpful,
Please click the booster button at the bottom.
Here is the Bitcoin 30-minute chart.
There will be a Nasdaq index announcement at 9:30 and 11:00 in a little while.
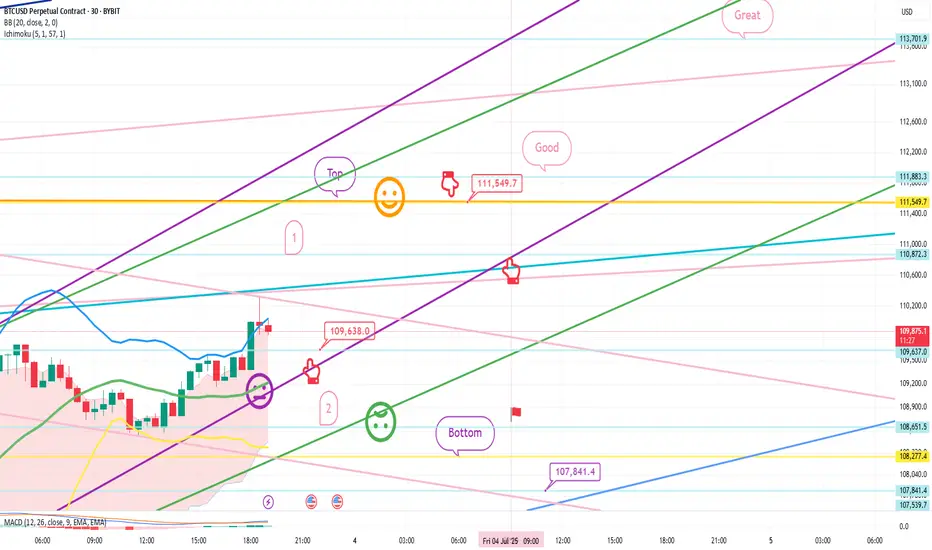
I created today's strategy based on the Nasdaq pattern and Tether dominance vertical decline conditions.
*One-way long position strategy when the red finger moves
1. $109,838 long position entry point / stop loss price when the purple support line is broken
2. $111,549.7 long position 1st target -> Great 2nd target
The 1st section at the top and the 2nd section at the bottom are sideways sections.
Even if the strategy fails, if the green support line is not broken,
it is good for a long position.
Below that
Bottom -> Please note that it is open up to 107,841.4 dollars
Up to this point, I ask that you simply use my analysis for reference and use only
I hope that you operate safely with principle trading and stop loss prices.
Thank you.
July 1 Bitcoin Bybit chart analysis
Hello
This is Bitcoin Guide.
If you "follow"
You can receive real-time movement paths and comment notifications on major sections.
If my analysis was helpful,
Please click the booster button at the bottom.
Here is the Bitcoin 30-minute chart.
Shortly later at 10:30 PM and 11:00 PM, there will be a NASDAQ index announcement.
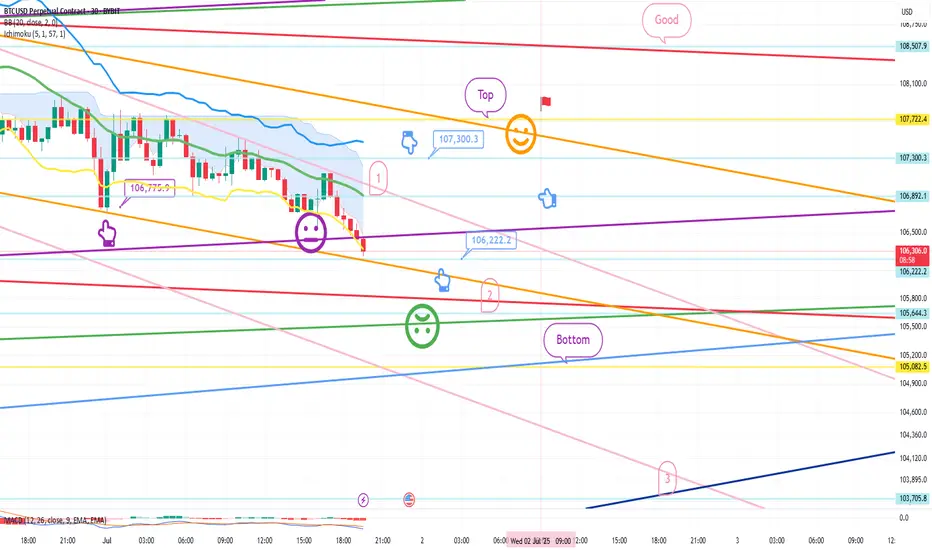
On the left, with a purple finger,
I connected the long position entry point of $106,775.9, which I entered yesterday, to today's strategy.
Since the rebound was not strong yesterday,
the 12-hour chart -> daily chart MACD dead cross is currently under pressure.
Depending on the situation, it can drop strongly to the 3rd section at the bottom,
and since there may be some people who are maintaining long positions yesterday,
I will explain in detail the operating method such as the loss cut price,
so please check it carefully.
*When the blue finger moves,
Bidirectional neutral
Short->Long switching strategy
1. 107,300.3 dollars short position entry section / stop loss price when orange resistance line is broken
2. 106,222.2 dollars long position switching / stop loss price when section 2 is touched
3. Top section long position 1st target -> Good 2nd target
It is important until 9 o'clock when the 12-hour candle is created.
After 9 o'clock, the blue finger 106,222.2 dollars at the bottom
Becomes the main support line
If it comes down from the current position, section 2
The main support line is divided.
In terms of the pattern, it is section 6+12.
If section 2 is touched right away,
There is a high possibility of a strong drop today,
So you should be careful.
- Those who are maintaining a long position
If you touch the 2nd section before 9 PM without touching the short position entry point at the top
You should operate at a loss cut price.
I think it would be good to adjust it according to leverage.
If it falls after touching the 1st section at the top
It becomes a vertical decline condition.
From the bottom, from the 3rd
Maximum Bollinger Band daily chart support line section
Please note that it can be pushed up to 100,685.5 dollars.
I have never changed my perspective suddenly or irresponsibly after leaving an analysis article.
I did my best until the end today.
Please use my analysis article so far only for reference and use
I hope you operate safely with principle trading and loss cut prices.
Thank you.
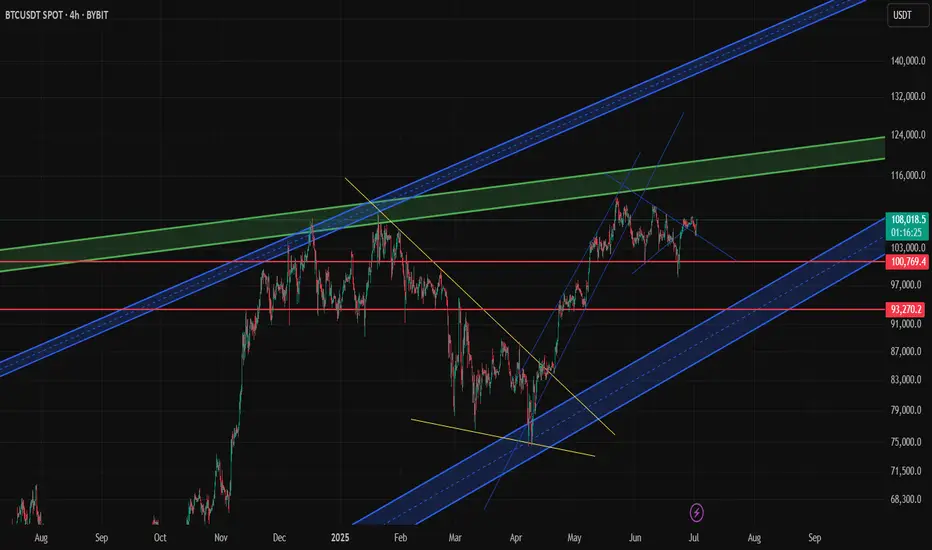
How I Use Bybit Referral Code BY500 for BTC Scalping –Live TradeBTC/USDT – 4H Scalping Setup with Real Price Action Zones & Channel Analysis (Bybit Referral code BY500 Chart) Over the past few weeks, Bitcoin has been moving within a clear ascending channel with multiple pullbacks creating scalp-worthy entries on the 4H timeframe. In this analysis, I’m sharing my current BTC/USDT scalping strategy built around support/resistance, channel breakouts, and confluence zones—all visualized on the chart above.
Current BTC Setup:
BTC is currently trading near $107,800, having bounced from the $100,769 red support line
A potential retest of the descending wedge is underway
The price remains above a critical long-term support zone marked in blue channels, suggesting a bullish mid-term outlook
Why I Use This Strategy
My scalping technique is based on identifying high-probability zones within channel ranges, especially in confluence with long-term trendlines. This strategy is particularly effective when using exchanges with low fees and fast execution.
I personally trade this setup using a platform that offers deep liquidity and competitive trading fees (hint: chart is from that platform). Lower fees = better ROI per scalp, especially in volatile conditions.
Scalping Tools Used:
Channels: To identify swing zones and trend continuation
Volume zones: (Not shown here, but used on execution layer)
Multi-timeframe confluence
Support/Resistance flips
Pro Tip:
If you're an active scalper, always watch for:
Wick rejections at trendlines
Volume surge near breakout
Failing rallies as signs of retracement
usE bYBIT referral Code - BY500
These are all visible in this BTC structure.
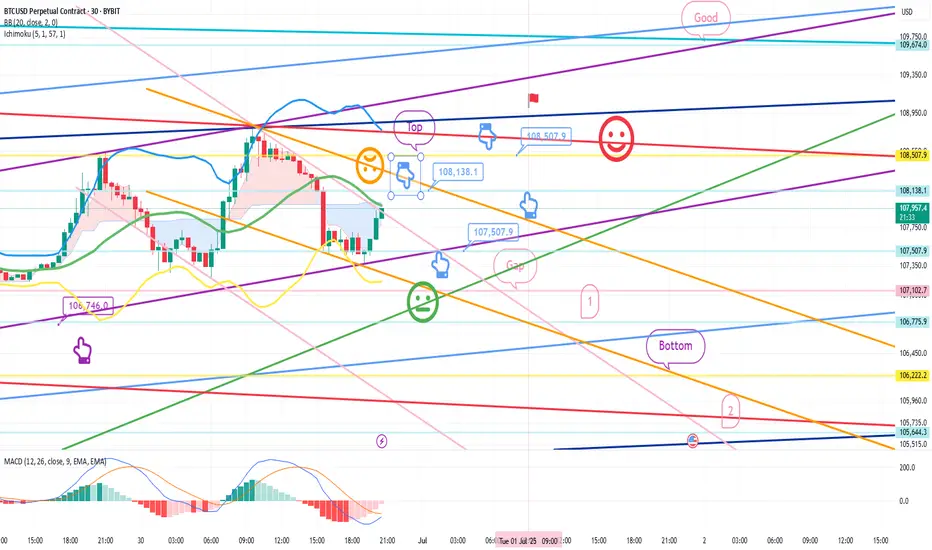
June 30 Bitcoin Bybit chart analysisHello
This is Bitcoin Guide.
If you "follow"
You can receive real-time movement paths and comment notifications on major sections.
If my analysis was helpful,
Please click the booster button at the bottom.
This is the Bitcoin 30-minute chart.
There is no separate indicator announcement today.
The weekly and daily charts are being adjusted at the same time as they are created.
The strategy was carried out based on the Nasdaq pattern and the Tether dominance pattern.
The long position entry section on the 25th, $106,746, was connected as is.
*When the blue finger moves,
It is a two-way neutral
short->long switching or long waiting strategy.
1. $108,138.1 short position entry section / stop loss price when orange resistance line is broken
2. $107,507.9 long position switching / stop loss price when green support line is broken
3. $108,507.9 long position 1st target -> Good 2nd target price
You can also use the long position re-entry indicated in the middle.
If it comes down right away without touching the short entry section at the top,
it is a long waiting strategy at the gap section of 107,102.7 dollars,
and the stop loss price is the same.
And, if it succeeds in rebounding within the purple support line today,
the reason it is safe from a long position is
because the low point of the weekly and daily candles created this week is maintained without additional deviation.
Please note that the 1st section at the bottom is a sideways market / the 2nd section is open up to the bottom.
Please use my analysis article so far only for reference and use,
and I hope you operate safely with the principle trading and stop loss price.
Thank you.
June 25 Bitcoin Bybit chart analysisHello
This is Bitcoin Guide.
If you "follow"
You can receive real-time movement paths and comment notifications on major sections.
If my analysis was helpful,
Please click the booster button at the bottom.
This is the Bitcoin 30-minute chart.
Nasdaq indicators will be announced at 11 o'clock shortly.
Nasdaq is rising vertically + renewing its all-time high.
Accordingly, I ignored the weekly MACD dead cross and
proposed the strategy for the pattern by substituting Tether dominance.
Although it is not visible on the screen,
I created today's strategy with the condition of maintaining the long position of $100,587.9 that was confirmed on the 23rd.
* One-way long position strategy when the red finger moves
1. $106,746 long position entry section / When the purple support line is broken
or when section 2 is touched, stop loss price
2. $108,66 long position 1st target -> Good 2nd -> Great 3rd target price
When section 1 at the top touches, it can be connected to an upward trend,
and section 2 is a sideways market.
At the very bottom and the very top,
I have indicated the maximum possible trend until tomorrow afternoon.
Up to this point, I ask that you simply use my analysis for reference and use only
I hope that you will operate safely with the principle of trading and stop loss.
Thank you.

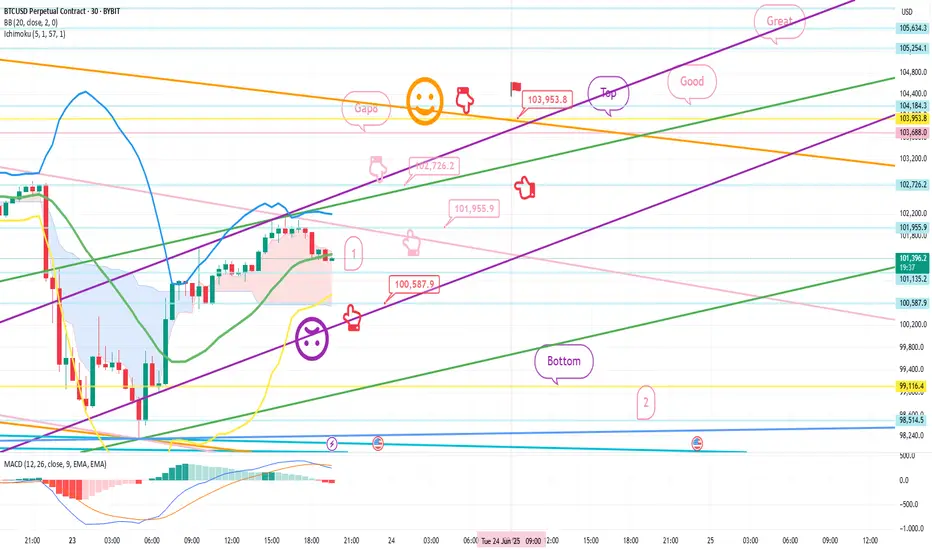
June 23 Bitcoin Bybit chart analysisHello
This is Bitcoin Guide.
If you "follow"
You can receive real-time movement paths and comment notifications on major sections.
If my analysis was helpful,
Please click the booster button at the bottom.
This is the Bitcoin 30-minute chart.
The Nasdaq seems to be rising without any problems,
but Bitcoin is under pressure from the MACD dead cross on the weekly chart as it has been adjusted strongly over the weekend.
Depending on the real-time situation, it seems advantageous to operate safely
short-term trading or both-way trading this week.
I created today's strategy based on the Nasdaq movement and the Tether dominance pattern.
*One-way long position strategy when the red finger moves
1. $100,587.9 long position entry section / hand drop when the purple support line is broken
2. $103,953.8 long position target price / Good 2nd target price thereafter
From the purple support line breakout, the weekly chart
candle low point created this week is broken, so it is better to maintain it without breaking out from the long position position.
If it breaks out, it can be pushed to the bottom -> 2nd section.
The 1st section marked in the middle
If it doesn't come down to the long entry point today
It is a vertical rise section
And the pink finger in the middle indicates the short-term target price -> additional long entry section
And the Gap8 section was created at the top due to last week's movement
I think it would be good to refer to it while trading.
Up to this point, I ask that you simply use my analysis for reference and use
I hope that you operate safely with principle trading and stop loss prices.
Thank you.
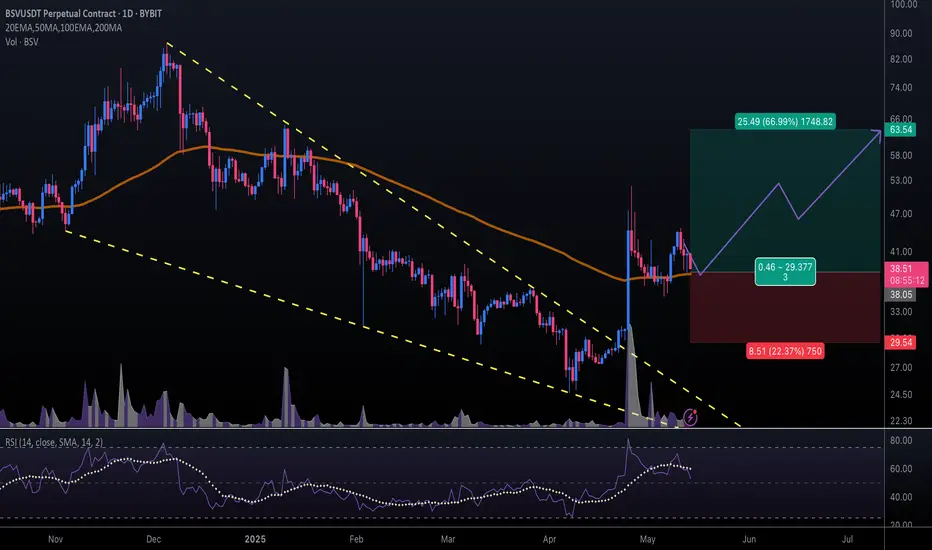
#BSVUSDT #1D (ByBit) Falling wedge breakoutBitcoin Satoshi Vision is pulling back to 100EMA daily support where it seems likely to bounce and resume bullish, mid-term.
⚡️⚡️ #BSV/USDT ⚡️⚡️
Exchanges: ByBit USDT
Signal Type: Regular (Long)
Leverage: Isolated (2.0X)
Amount: 4.5%
Entry Targets:
1) 38.05
Take-Profit Targets:
1) 63.54
Stop Targets:
1) 29.54
Published By: @Zblaba
AMEX:BSV BYBIT:BSVUSDT.P #BitcoinSatoshiVision #PoW
Risk/Reward= 1:3.0
Expected Profit= +134.0%
Possible Loss= -44.7%
Estimated Gain-time= 2 months
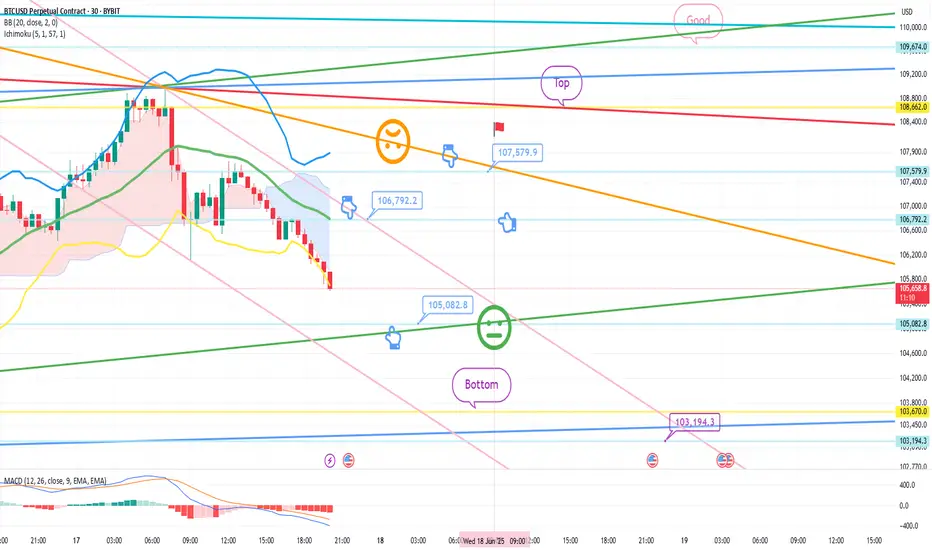
June 17 Bitcoin Bybit chart analysisHello
This is Bitcoin Guide.
It's been a while.
I took a break recently because the participation rate was not good.
Since it's been a while since I did an analysis, I did it in a short form,
I hope you enjoy it.
If you "follow"
You can receive real-time movement paths and comment notifications on major sections.
If my analysis was helpful,
Please click the booster button at the bottom.
Here is the Bitcoin 30-minute chart.
I created a strategy based on the possibility of sideways movement in Nasdaq and the rebound of Tether Dominance.
* When the blue finger moves,
It is a two-way neutral short->long switching strategy.
1. $106,792.2 short position entry point / stop loss price when orange resistance line is broken
2. $105,082.8 long position switching / stop loss price when green support line is broken
3. $107,579.9 long position 1st target -> Top 2nd target price
If it goes down from the current position,
Check the bottom section -> up to $103,194.3.
Please use my analysis as a reference only
I hope you operate safely with principle trading and stop loss price.
Thank you.
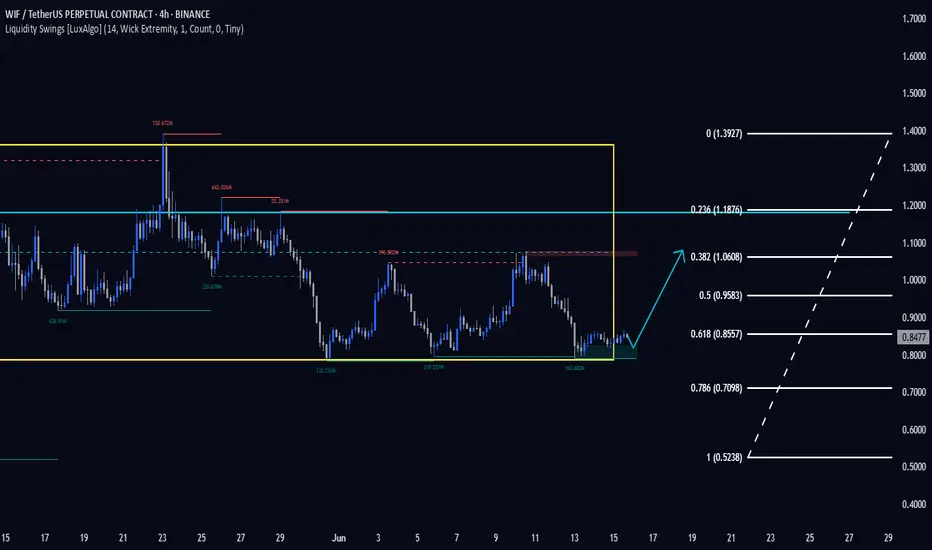
WIF 4H. Make or Break ZoneBINANCE:WIFUSDT The asset is still moving within a defined range and is now brushing against the lower boundary of its structure. This area has historically triggered buyer interest — and if that repeats, we could be looking at a recovery toward $0.97+ in the short term.
However, failure to defend this support could send price cascading down to the $0.58–$0.60 zone.
Given the ongoing uncertainty in global markets, especially due to rising geopolitical tension, any long positions should be executed with tight risk management and a hard stop-loss.
Entry range (EP):
• Market
• $0.8120
• $0.7790
Take-Profit targets (TP):
• $0.8880
• $0.9425
• $0.9765
I’m managing risk carefully and limiting exposure per trade to no more than 2% of my portfolio. This is my personal trading log and not financial advice — always DYOR and trade responsibly.
Let the market decide — I'm prepared either way.
Stay sharp. Stay safe. 🧠📊
AR 1H. $5.90 Is the Last Line of Defense. 06/15/25BINANCE:ARUSDT If we fail to hold the $5.90 level, this asset could crash hard — potentially entering a deeper downtrend.
DYOR.

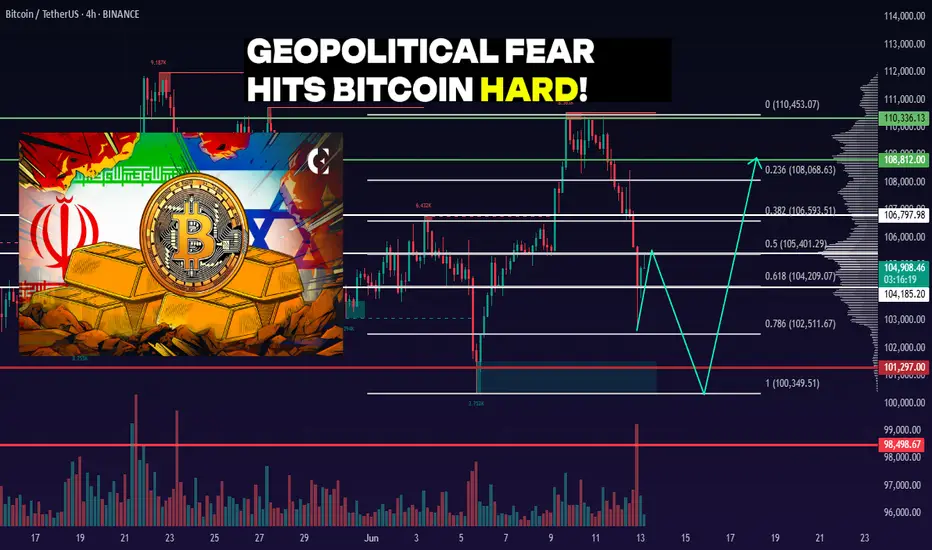
BTC 4H. $104K or Bust — Critical BTC Moment! 06/13/25BINANCE:BTCUSDT remains in a sideways range between $110,336 – $101,297. The main trading volume is concentrated around $103,907.
Recently, the price reached the upper boundary of the range at $110,336 and sharply declined from there — confirming the strength of resistance. The drop was intensified by negative geopolitical news (Israel–Iran tensions).
As a result, BTC retraced into the $104,185 – $101,297 demand zone — a potential area where buyers might step in again.
Personally, I expect one more dip into the $104,185 – $101,297 range to test the strength of buyers.
⚠️ If negative news continues, a breakdown below $100,349 and a new local low is possible.
DYOR.
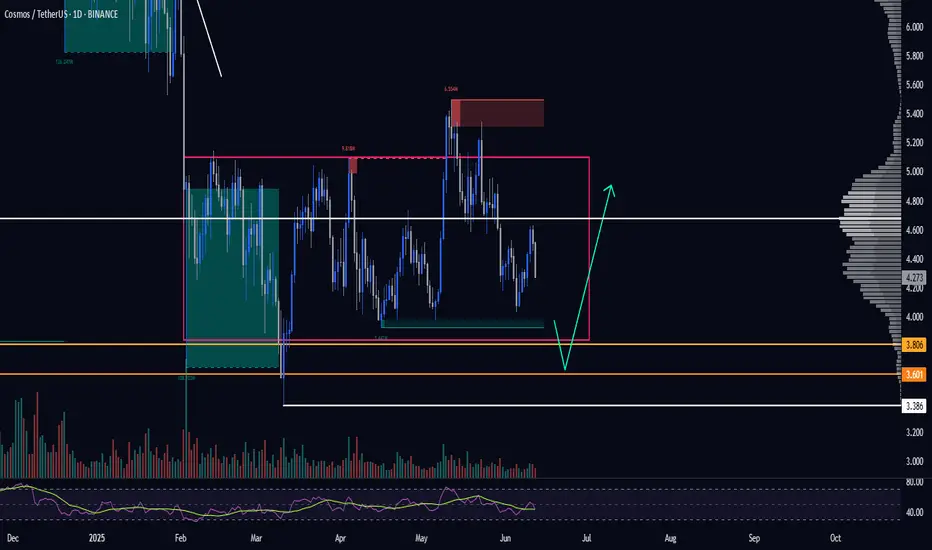
ATOM. Massive Liquidity Grab Incoming. 06/12/25BINANCE:ATOMUSDT At the moment, the price is in an accumulation phase.
The buyer interest zone lies between $3.806 – $3.601, which also serves as a strong support area. We may see solid spot/futures entries here and the potential start of a new upward move.
What we’re really waiting for is liquidity to be swept in this zone — where tons of stop-losses have clustered. Such a shakeout would be a perfect setup for a bullish impulse.
Spot/futures accumulation is valid within this zone.
DYOR.
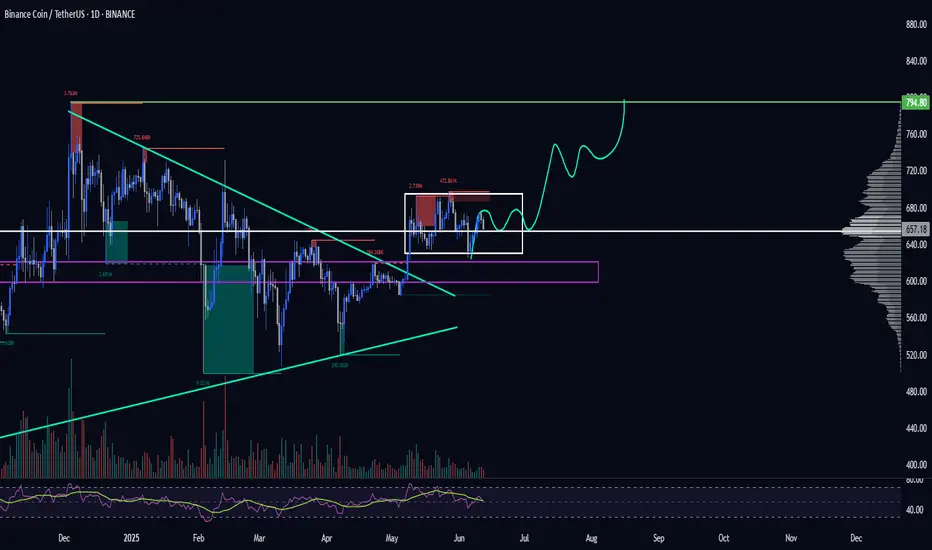
BNB 1D Ready to Explode? This Chart Says YES. 06/12/25BINANCE:BNBUSDT is forming a tight consolidation right below key resistance at $710, inside a triangle structure. Every dip into the $655–$625 support zone gets quickly bought up — showing strong buyer interest and accumulation.
Price is compressing inside the triangle with higher lows, indicating bullish pressure. A breakout above $710 would likely trigger a strong move toward $770–$780, and potentially a new ATH > $800.
As long as $625 holds — I'm bullish. I expect one more sweep of support before an explosive breakout.
Spot/futures entries: $655–$625
Targets: $710 → $780 → $820+
Invalidation: Daily close below $625.
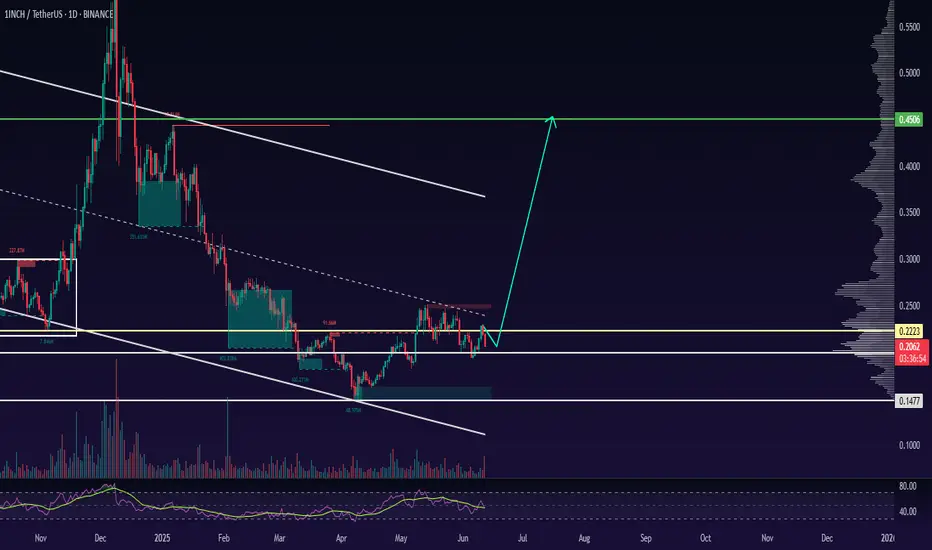
1INCH 1D. Showing Signs of Accumulation. 06/12/25BINANCE:1INCHUSDT There's growing media and social media attention around the 1INCH project, which could be a bullish sentiment trigger.
Currently, the price is trading within a descending channel and has recently bounced from the lower boundary, signaling a potential long entry or spot accumulation opportunity.
From current levels, I expect a clean 2x upside on spot. Personally, I think it's worth starting to scale in carefully on spot or futures.
However, keep in mind — even after a bounce, price could still dip slightly lower before any meaningful move up. A deeper correction remains a possibility, so always factor in risk.
📌 Key Takeaways:
• Long bias from current levels
• Potential 2x on spot
• Further dip possible — manage risk accordingly
DYOR. Stay sharp.