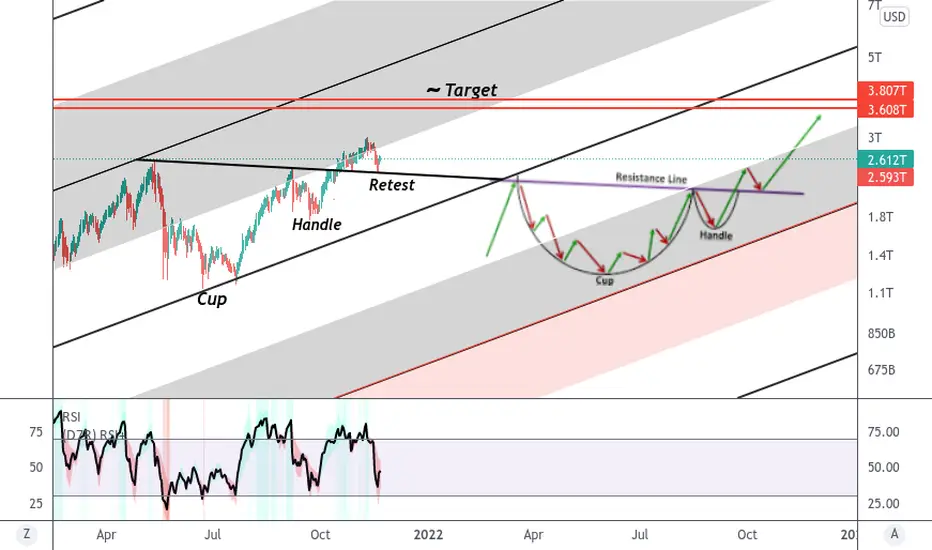
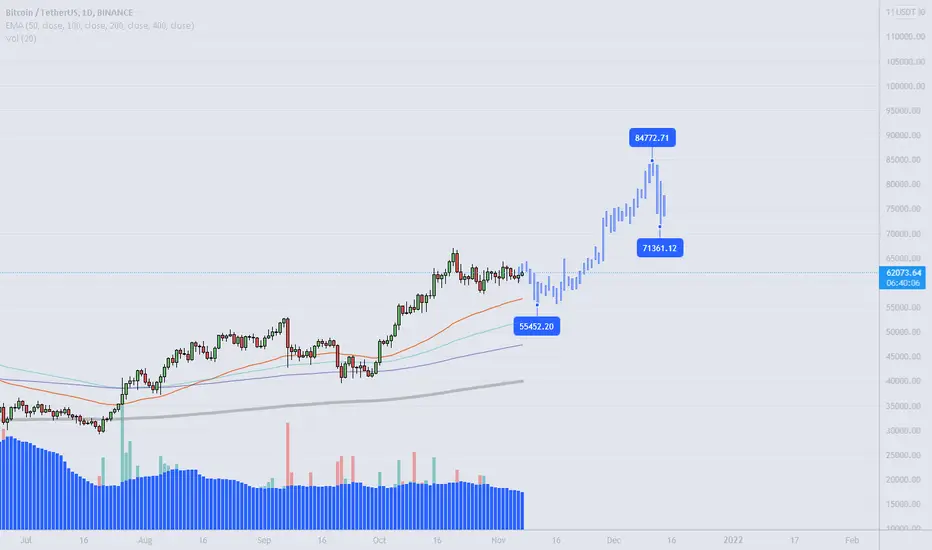
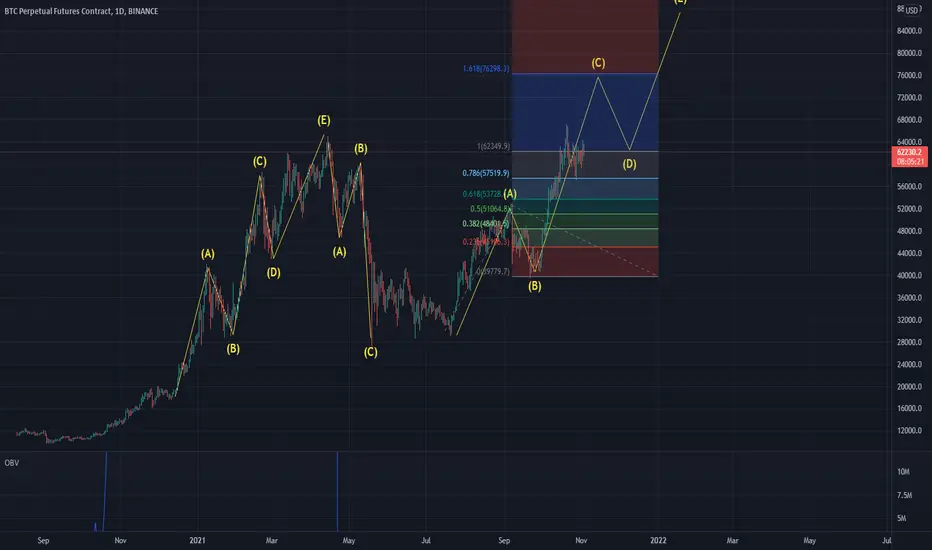
Picture Perfect Cup And Handle?Given that the market structure has been pretty weak lately, if we print another rounded top on our way up to hit the cup and handle targets, ill probably scale almost 100% out of the markets.
We've been banging against overhead resistance in the middle of this channel for some time now and i would expect a pretty substantial drop after this next leg up.
Obviously nobody knows where the next top will be but i'm aiming at 80-90K, it may break up it may break down, keep your eyes on the charts and trade accordingly.
Its good to note that as we near, what i am looking at as getting close to, the end of the cycle remember to pull profits frens.
You haven't made any money until your profits are actualized.
And as always,
Good Luck And Safe Trading.
C-WAVE
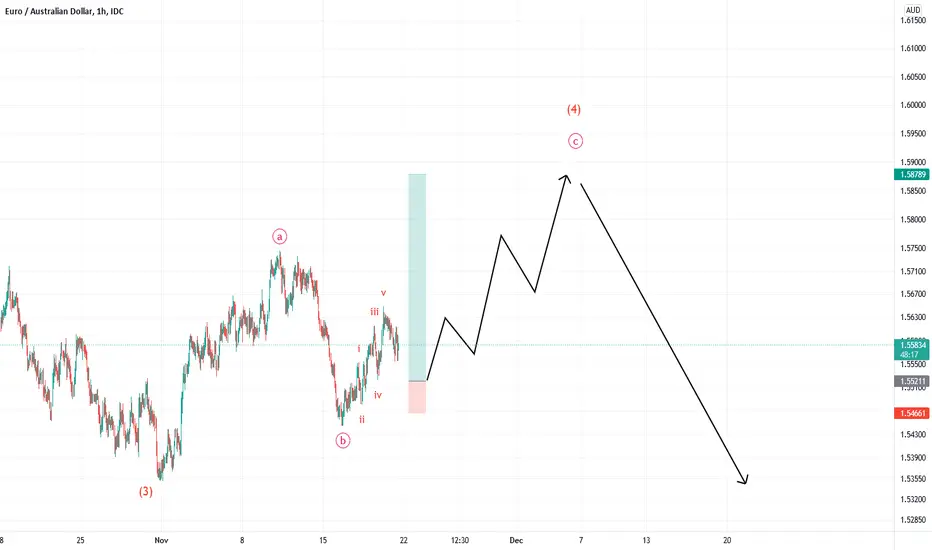
EURAUDIs in wave c. It corrects slightly downwards to complete wave 2 of wave c, and in total it will grow upwards in a wave of five waves in the form of wave c. Wave 4 will be completed in the higher time frame and then Wave 5 will start moving downwards as you can see in the figure.
In the coming weeks, I will update the Wave 4 price target in another post.
The entry range is specified on the chart.
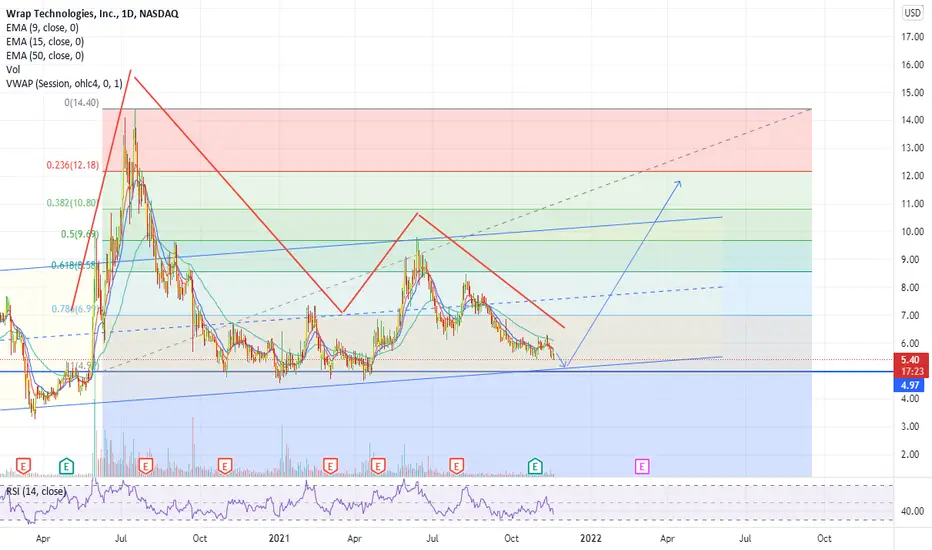
Elliot Wave on WRAPLooks like a perfect Elliot wave forming on WRAP. Going long using the bottom line as a stop loss. Expecting a solid bounce back off the bottom and then finding new all time highs.
1/22 $5c
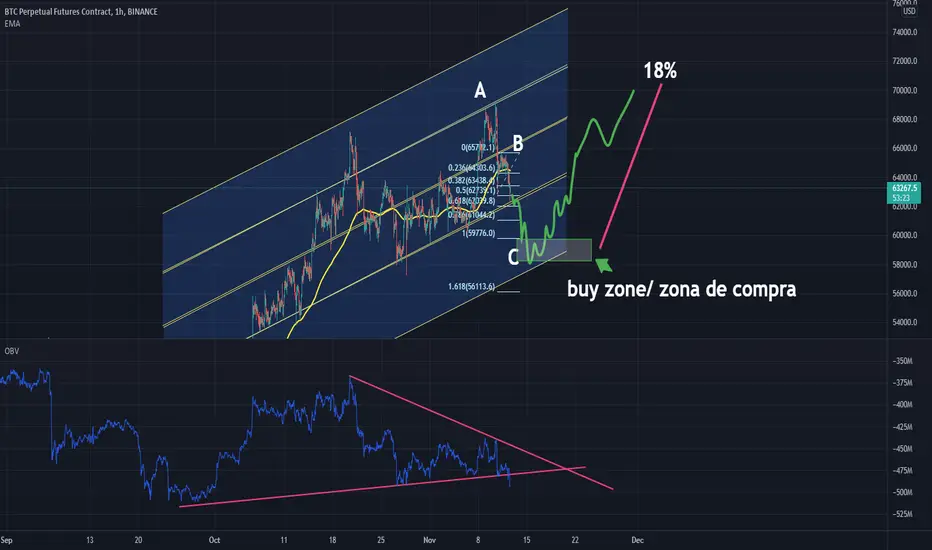
a little drop for btc is comingthe volume is in a downtrend which is starting
according to past channels and fibonacci that may be the support and buy zone
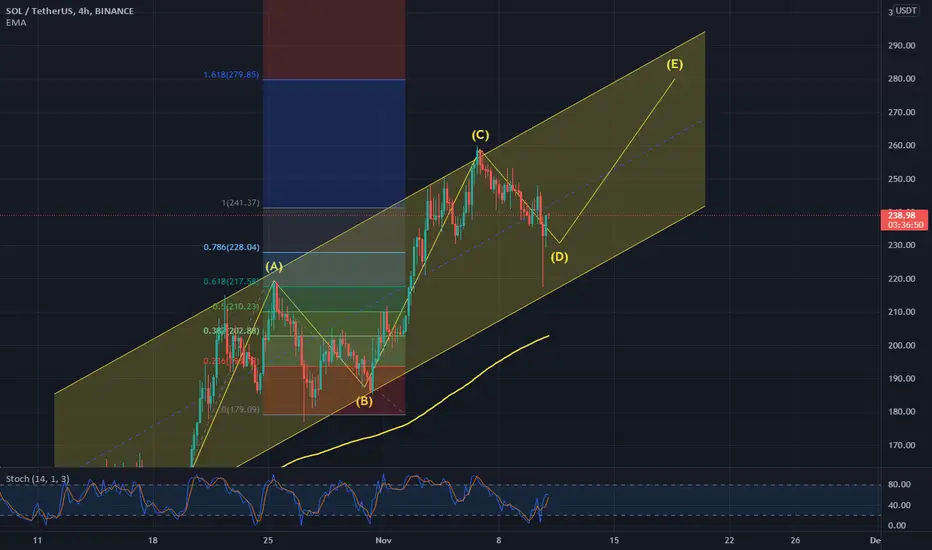
idea for sol with elliot wavesim bbuying here because its a retracement from the c wave
277 is my target before a big correction
21/11/10 - GBPUSD is about to finish its correctional wave C Hi Trader,
see my current Idea on GBPUSD. For further informations about me and my services look below.
RL from RT_Trading

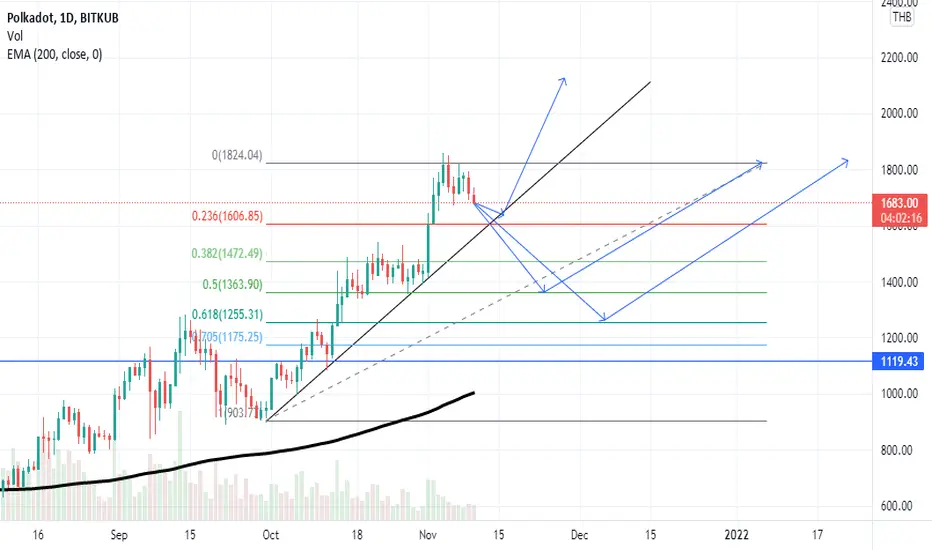
The most possible trends for polkadotThe basic trend is uptrend but in 2 ways it will be firstly downward then upward and in 1 way shows reaction to the oriented trendline then goesup.the level lines are spotted at the chart.
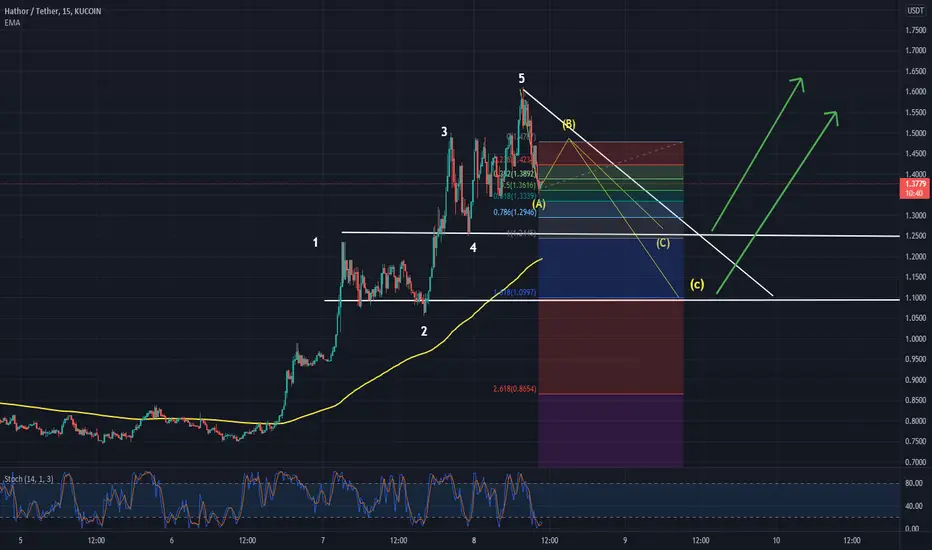
idea for a gem on kucoin htr/usdthis is a gem on kucoin which is like sol but better and made a 168% these weeks now it seems like completed the cycle so im waiting a correction so we can go more up
Bitcoin Price Prediction Wave AnalasysBitcoin Price Prediction Wave Analasys - Very nice prediction very good like obama barack the third
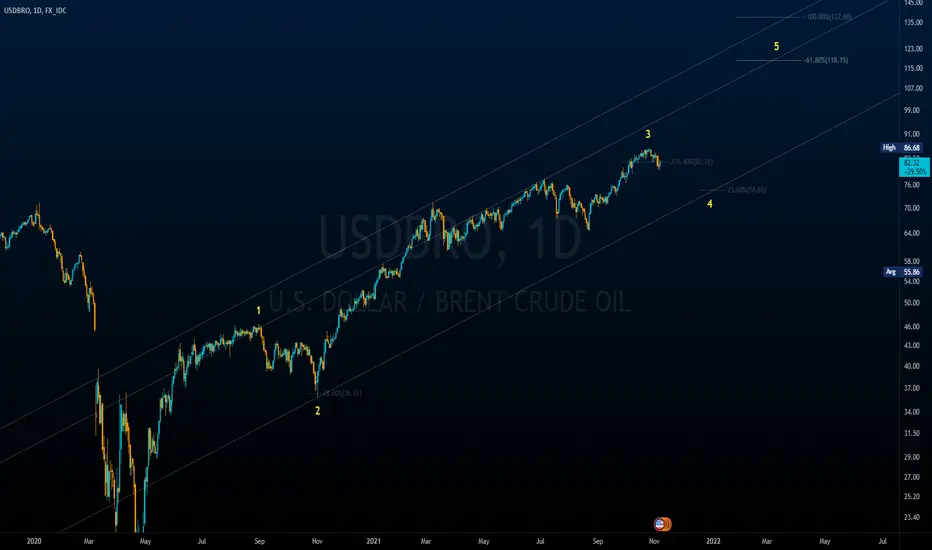
BRENT: Daily View As 4th and 5th Still in ProgressThis is the Daily TF overview of pricing structure and projection.
(You can find my previous analysis for H1 TF in Related Ideas)
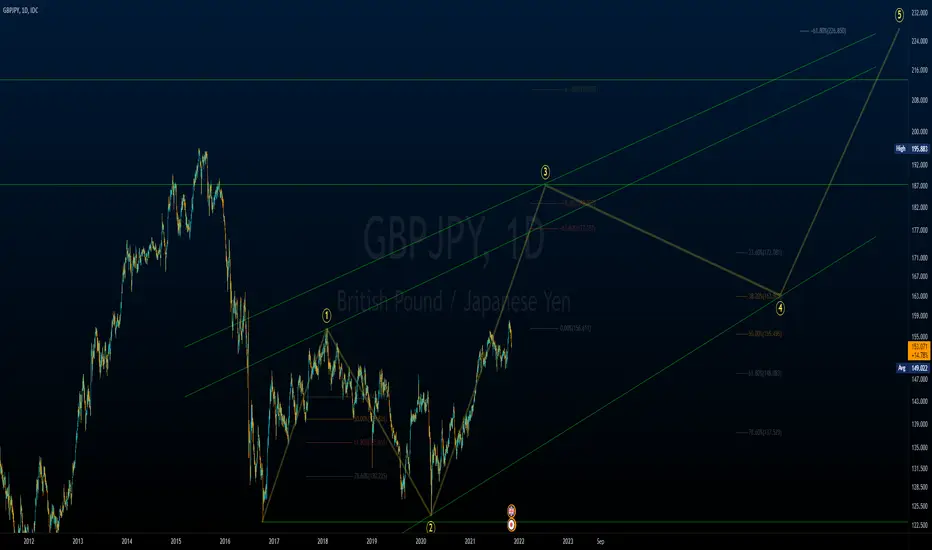
GBPJPY: Long Term Rally Seems Started?Long time after its' inception, GBPJPY seems like finally trying to stand up. It won't be easy to break decades long Bearish Bias. But we will start to see stong bulls gathering in the upcoming weeks, months...
And considering JPY is a safe-haven, think about the inflation awaiting us :)

SPX: Long Term OutlookMeasuring the rally to see how next episodes could unfold. Currently 3rd wave's ending extension is happening. It will end up with double-top h&s formation, then we'll look for #4.
if #3's extension will complete at 61.8% or lower, then #5 strongly possible can suggest 10K for the final range.

GBPJPY: Daily TF Elliottwave Projection MidtermMeasuring in daily TF, just ruler & guideline for swing-traders. Taking 0-1-2 as base for measuring 3-4-5.
(Sorry, removed the previous one as it said to be Daily TF but published mistakenly in Weekly)
BRENT: Overextended 3rd Wave & Pygmy 5th3rd Wave has extended 276.8% and this overextension did not leave room for 5th to reach its' own targets. Limited it with 100% of 1st Wave.
I don't expect HH despite nice bull attacks happening, it's sell until 78-79$.

SHIBAINU/USD shows reaction to Fibo-Predictionin a high possibility shibainu will fall to the specific area of fibo in the chart and then will rise to the previous historical high in the last week.

Wave next moveWave looks good and is it on its support you can long it with low leverage
trade at your own risk
sl=24.5
Tp=28$

bitcoin chart daily with elliot waves if you look at the daily chart of bitcoin it shows a clearly and simple wave structure which is bullish and can drive us into 80k in this bullrun
so there is only one thing to say: hold
Elliott Wave Zig Zag Proper Labeling Here is a visual representation of an Elliott Wave Zig Zag with some common labeling mistakes. Also has some idealized Zig Zag guidelines as well.

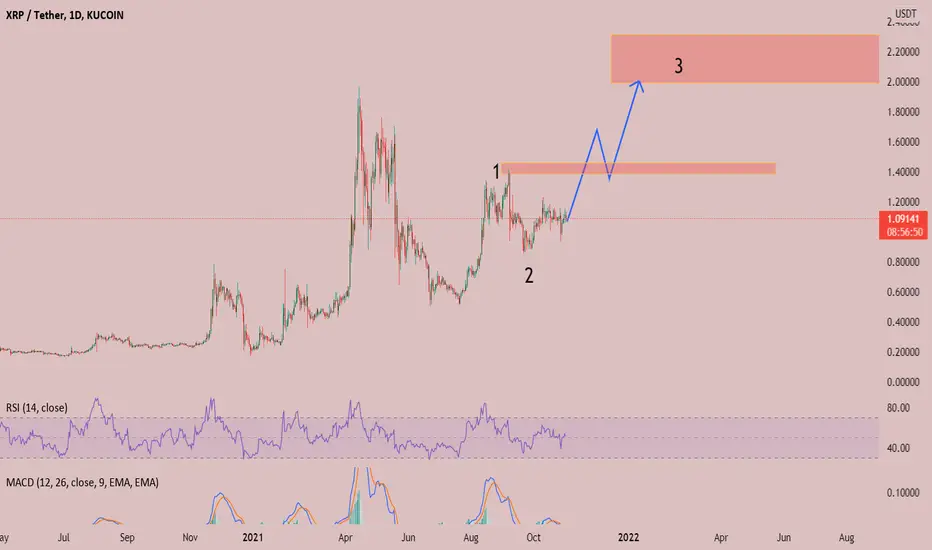
xrp have big bullish move i show a path that have a nice possibility of wave 3 and going too the moon for next 3 month(i think next 2 or 3 month) and wave 3 i a very big bullish wave
so buy it and hold that
VR1 head & shouldersThis head and shoulders pattern predicts a huge 30% drop.
Let us know your opinion In the comments!

In correctionIn a first part of correction.thats first target.the last wave is 3 part.then the new wave reminds ç wave.

3 Wave Flat Patterns to Know and Understand📕📗📘In Elliott wave theory, a flat is a figure consisting of three waves, the ends of which are called ABC . This is a corrective pattern going against the trend. This pattern may look like a simple range that spends more time on sideways movement than on a real price increase. The pattern, as a rule, is a shallow pullback of the previous trend and can sometimes be a "flag" of the general flag pattern .
❗️In fact, there are 3 types of flat correction: regular (1), elongated (2) and launched (3). The name of the template by which you identify the correction is not as important as what it implies. In each of the above-mentioned corrections, lateral consolidation is implied, which will eventually resolve as a complete recovery of the model and continuation of the trend until entering the flat model.
📊Trying to define a plane Elliott wave , we are looking for several characteristics.
1.ABC-plane subwaves (regardless of the 3 types above) are divided into 3-3-5.
2.In the flat, look for the second wave or the "B" wave, which rolls back by 78-138% from the "A" wave.
📈The three waves on the plane ( ABC ) are divided into 3-3-5, which means that there are 3 sub-waves in leg "A", 3 sub-waves in leg "B" and 5 in leg "C". underwater waves in it. Since both branches "A" and "B" contain three subwaves each, this illustrates the struggle of the instrument to create a new trend against the previous trend. Consequently, prices eventually fluctuate sideways, eating up more time than prices.
📉When defining corrective patterns, one thing should be kept in mind: there will always be five sub-waves in the "C" legs (the only exception is triangles, since they contain only three sub-waves). Therefore, if you see a 5-wave movement preceded by several 3-wave movements, count in reverse order and see if the flat pattern works.
🚀Flats appear where any three-wave corrective movement can manifest itself. For example, you will find flats in the position of the 2nd or 4th wave of the pulse, in the wave "B" of the zigzag , in the waves W, Y, Z or X of the complex correction, or in the waves "A" of the wave of another flat. However, one corrective structure in which you won't find a flute is triangles. Triangles are constructed from zigzags or other triangles.
🍁As a result, their identification in real time may be difficult. Go to the next higher trend level to see what the larger structure might be, and use wave measurements to anticipate the end point of the pattern. Since they essentially form a range, range trading methods and risk levels are recommended for trading on them.

Elliott wave for beginners📓Back in 1930, Ralph Nelson Elliott decided to figure out how the market works. After a long analysis of the charts, Elliott made a discovery that still does not lose its relevance. Elliott was able to identify the "breath" of the market. This new method of graph analysis is called Elliott Wave Analysis . As it turned out, the theory of wave analysis can be used on all timeframes and assets.
🚀The basis of the analysis is the idea that the market moves by impulses and corrections. As Elliott noted, the trend movement consists of 5 waves - 3 impulsive and 2 corrective, after which a correlation of three waves against the trend begins.
❗️There are a couple of rules worth remembering when determining waves:
1. Wave 2 never recovers more than 100% of wave 1. Usually the recovery is from 50% to 61.8% of wave 1.
2. Wave 4 never recovers more than 100% from wave 3. It usually declines between 38.2% and 50% of wave 3.
3. Wave 3 always extends beyond the end of wave 1 and is never the shortest; Wave 3 usually expands by 161.8 x wave 1.
It is important to remember these rules in order to correctly identify the waves.
In order not to make a mistake or go ahead of time, it is worth looking for the end of the second wave and go to the third, since it is the strongest and will bring the most profit. Indicators such as: MACD, RSI can be used to accurately determine the wave.
📌There are a couple more observations that will help your profitable trading:
-If wave 3 is the longest wave, then wave 5 will be approximately equal to wave 1.
-Wave 2 and Wave 4 will alternate. If wave 2 represents a sharp correction, wave 4 represents a flat correction and vice versa.
-After the sequence of five Elliott waves is completed, the ABC corrective waves usually end near the bottom point of wave 4.
🏆In order to learn how to correctly identify waves, enter a position in time and exit it in time, you need experience, so follow the charts, analyze and eventually the profit will come to you. Good luck!
