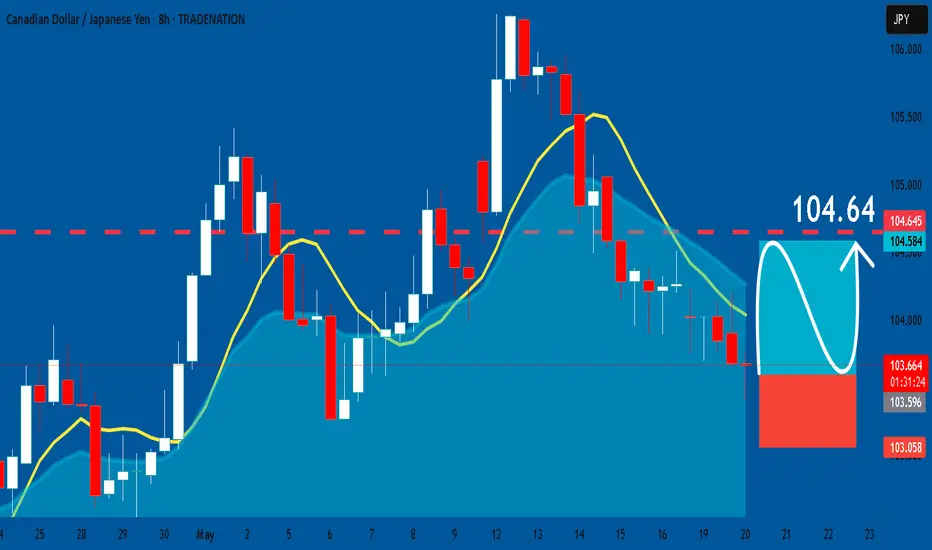
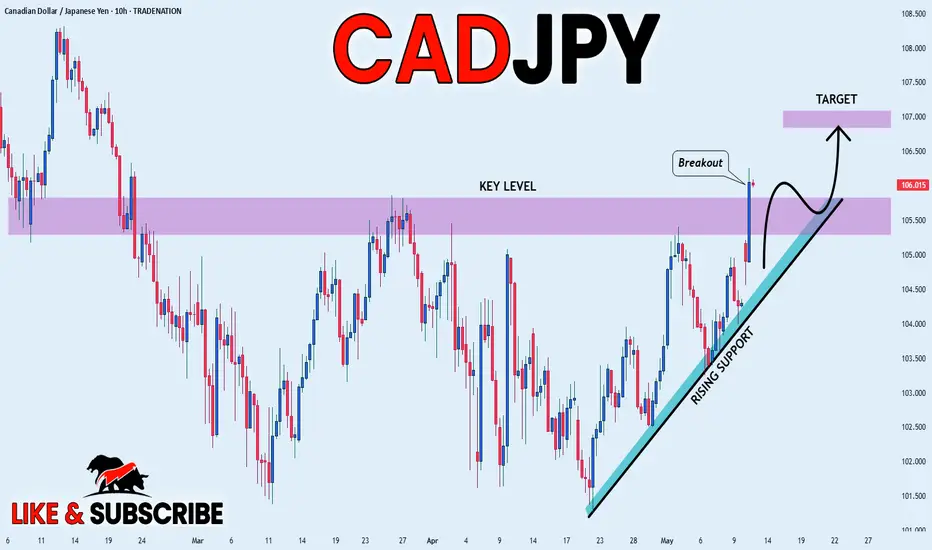
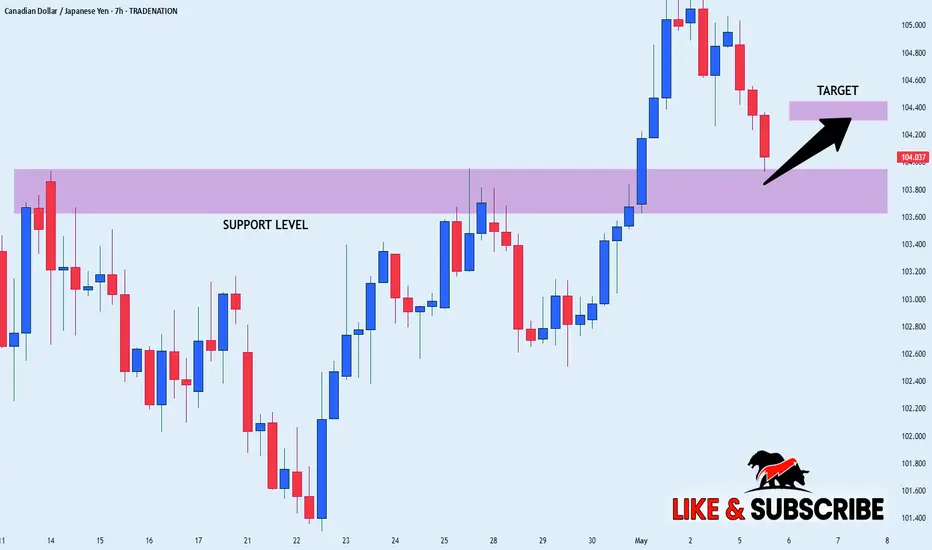
CADJPY: Long Trade with Entry/SL/TP
CADJPY
- Classic bullish formation
- Our team expects growth
SUGGESTED TRADE:
Swing Trade
Buy CADJPY
Entry Level - 103.60
Sl - 103.05
Tp - 104.64
Our Risk - 1%
Start protection of your profits from lower levels
Disclosure: I am part of Trade Nation's Influencer program and receive a monthly fee for using their TradingView charts in my analysis.
❤️ Please, support our work with like & comment! ❤️
CADJPY
CADJPY I Long Opportunity to Middle of the ChannelWelcome back! Let me know your thoughts in the comments!
** CADJPY Analysis - Listen to video!
We recommend that you keep this pair on your watchlist and enter when the entry criteria of your strategy is met.
Please support this idea with a LIKE and COMMENT if you find it useful and Click "Follow" on our profile if you'd like these trade ideas delivered straight to your email in the future.
Thanks for your continued support!Welcome back! Let me know your thoughts in the comments!

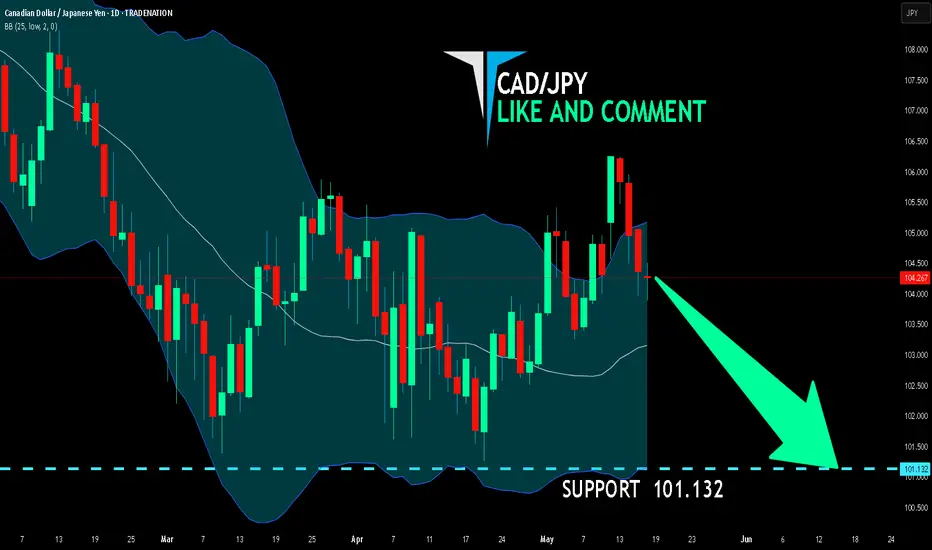
CAD/JPY BEARS ARE STRONG HERE|SHORT
Hello, Friends!
We are going short on the CAD/JPY with the target of 101.132 level, because the pair is overbought and will soon hit the resistance line above. We deduced the overbought condition from the price being near to the upper BB band. However, we should use low risk here because the 1W TF is green and gives us a counter-signal.
Disclosure: I am part of Trade Nation's Influencer program and receive a monthly fee for using their TradingView charts in my analysis.
✅LIKE AND COMMENT MY IDEAS✅
CADJPY: Expecting Bullish Continuation! Here is Why:
Balance of buyers and sellers on the CADJPY pair, that is best felt when all the timeframes are analyzed properly is shifting in favor of the buyers, therefore is it only natural that we go long on the pair.
Disclosure: I am part of Trade Nation's Influencer program and receive a monthly fee for using their TradingView charts in my analysis.
❤️ Please, support our work with like & comment! ❤️

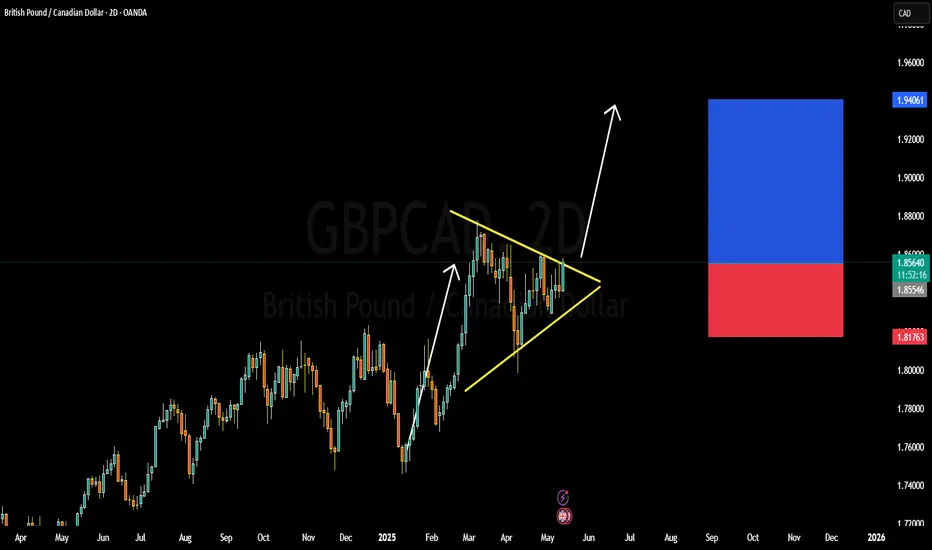
GBPCAD BULLISH OR BEARISH DETAILED ANALYSISGBPCAD is currently trading around the 1.85700 level, consolidating inside a well-defined bullish pennant on the 2-day chart. This pattern formation follows a strong impulsive rally from the 1.71000 region earlier this year, signaling that the pair is in a re-accumulation phase before its next leg higher. Price action is coiling tightly within converging trendlines, and recent volume spikes suggest increasing interest and momentum from the bulls, pointing toward a potential breakout to the upside.
On the fundamental front, the British pound is benefiting from rising wage inflation and a still-hawkish Bank of England tone, which keeps rate cut expectations muted compared to other G10 currencies. Meanwhile, the Canadian dollar remains under pressure due to softening oil prices and weaker-than-expected domestic data. The BoC has also signaled it may start easing in the coming months if inflation continues to slow, making CAD less attractive relative to GBP.
Technically, a breakout above the pennant resistance around 1.8600–1.8650 with strong bullish volume would confirm the continuation of the prior uptrend. The projected target from this pattern sits near the 1.95700 area, aligning with previous major resistance and psychological round numbers. Momentum indicators are building to the upside, and price remains above all key moving averages on the higher timeframes, reinforcing the bullish outlook.
With volume confirming accumulation, a breakout from this bullish pennant could accelerate quickly as trend-following strategies kick in. GBPCAD is well-positioned to capture the upside, and the current structure offers an excellent risk-to-reward opportunity in favor of bulls. In the context of macro divergence between GBP strength and CAD softness, the 1.95700 target looks highly achievable in the coming weeks.
CAD_JPY STRONG BULLISH BIAS|LONG|
✅CAD_JPY made a bullish
Rebound from the rising
Support and then broke the
Key horizontal level
Around 105.727 so we are
Bullish biased and after a
Local pullback we will be
Expecting a further
Bullish continuation
LONG🚀
✅Like and subscribe to never miss a new idea!✅
Disclosure: I am part of Trade Nation's Influencer program and receive a monthly fee for using their TradingView charts in my analysis.
CADJPY: Bullish Continuation is Expected! Here is Why:
Looking at the chart of CADJPY right now we are seeing some interesting price action on the lower timeframes. Thus a local move up seems to be quite likely.
Disclosure: I am part of Trade Nation's Influencer program and receive a monthly fee for using their TradingView charts in my analysis.
❤️ Please, support our work with like & comment! ❤️

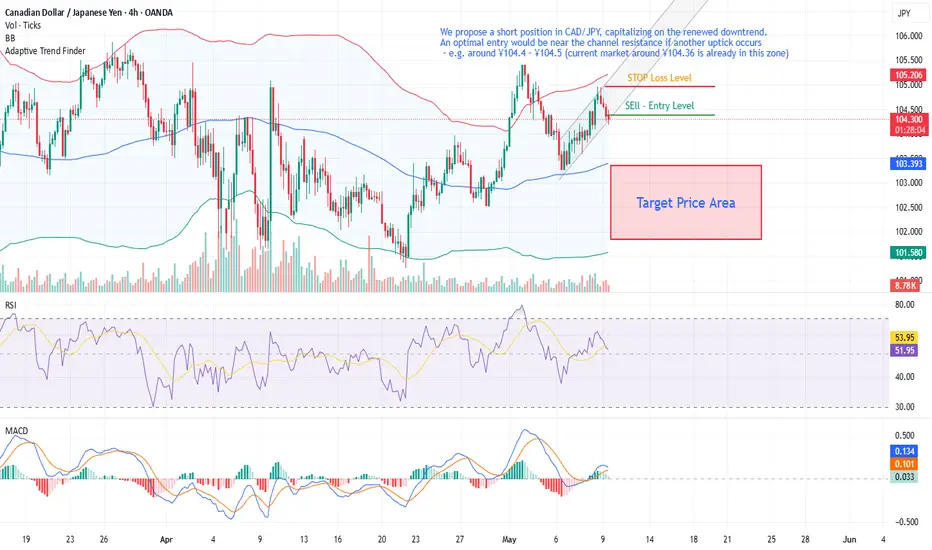
CAD/JPY Short – Commodity Currency Struggles vs. Safe HavenWe propose a short position in CAD/JPY, capitalizing on the renewed downtrend. An optimal entry would be near the channel resistance if another uptick occurs – e.g. around ¥104.4 – ¥104.5 (current market around ¥104.36 is already in this zone)
Technical Analysis: CAD/JPY’s technical picture has flipped bearish after a relief rally in April. Not long ago (earlier Q2), the pair formed a double bottom near a key support (around ¥101–102, likely the April low). That drove a rebound to a peak in late April, but the recovery stalled below ¥105. In fact, price failed at ¥104.90, which corresponds to the descending channel resistance on the daily chart.
We propose a short position in CAD/JPY, capitalizing on the renewed downtrend. An optimal entry would be near the channel resistance if another uptick occurs – e.g. around ¥104.4 – ¥104.5 (current market around ¥104.36 is already in this zone). A protective stop can be placed at ¥105.10, just above the recent swing high and the critical 105 handle. This stop is tight enough (about 70 pips risk) to invalidate the setup if hit (as it means a breakout of the bearish channel). The profit targets are ¥102.20 initially (just above the ¥102.9 support and ahead of the big 102 figure) and an extended ¥100.00 on a multi-week horizon if downside momentum persists.
CADJPY BUY/LONGBy utilizing Fibonacci retracement levels, historical patterns, , we can formulate a hypothesis that the market might follow a similar trajectory if bullish sentiment prevails.

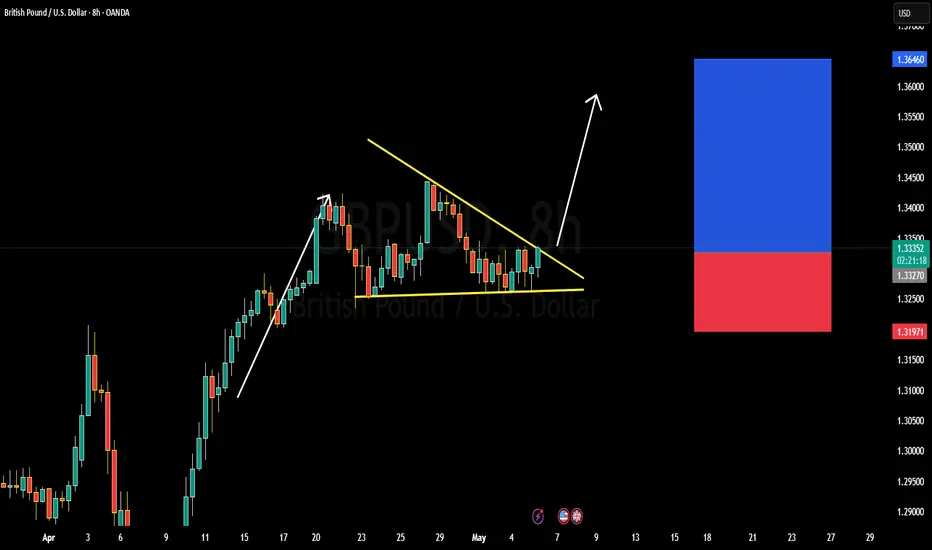
GBPUSD BULLISH OR BEARISH DETAILED ANALYSISGBPUSD is currently trading around 1.33400 and is displaying a promising bullish setup. The price action is coiling within a symmetrical triangle, which typically signals a potential breakout. A clear bullish structure has already formed following the recent impulse wave, and with the consolidation tightening, we are now closely watching for a breakout to the upside. The expected bullish breakout aligns with the projected target of 1.36000, offering a strong risk-reward opportunity for trend-following traders.
From a fundamental standpoint, the British pound is showing resilience despite broader dollar strength. Recent comments from the Bank of England have maintained a cautious yet firm tone regarding inflation control, hinting at the potential for rates to stay elevated longer than markets previously priced in. Meanwhile, the U.S. dollar index has seen some pressure amid mixed economic data and increasing speculation that the Federal Reserve may hold rates steady in the upcoming sessions.
Technically, GBPUSD remains well-supported above the 1.32500 level, with buyers defending key horizontal and trendline support areas. The recent compression in price suggests that volatility is about to expand, typically favoring the direction of the initial trend, which in this case remains bullish. Momentum indicators are beginning to curl higher, further supporting a breakout scenario.
In summary, GBPUSD is setting up for a high-probability bullish continuation. A confirmed breakout from the triangle could ignite a fresh rally toward 1.36000, especially if supported by dovish Fed rhetoric and firm UK economic sentiment. This setup is one to watch closely as it aligns both technically and fundamentally, positioning it as a favorable opportunity for medium-term swing trades.
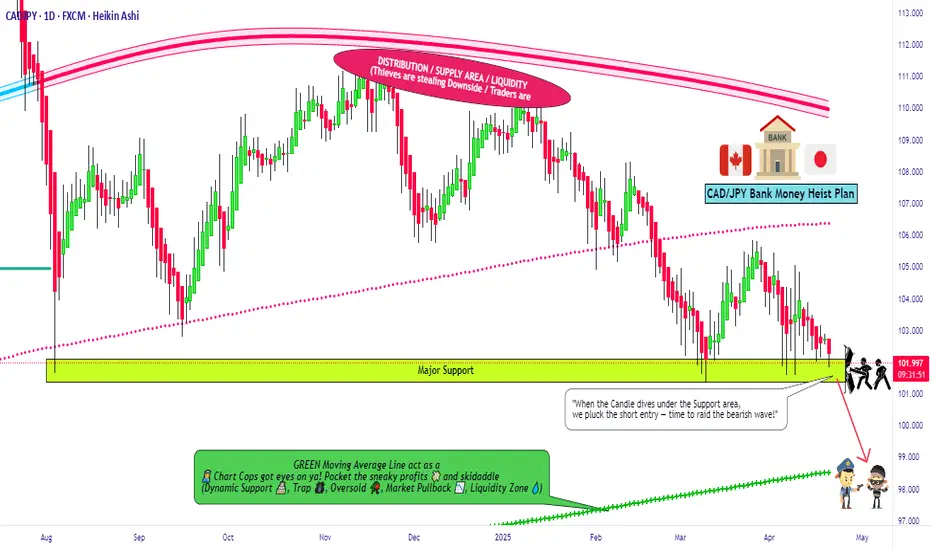
CAD/JPY "Loonie-Yen" Forex Bank Heist Plan (Scalping/Day)🌟Hi! Hola! Ola! Bonjour! Hallo! Marhaba!🌟
Dear Money Makers & Robbers, 🤑💰✈️
Based on 🔥Thief Trading style technical and fundamental analysis🔥, here is our master plan to heist the CAD/JPY "Loonie-Yen" Forex Market. Please adhere to the strategy I've outlined in the chart, which emphasizes short entry. Our aim is the high-risk Green MA Zone. Risky level, oversold market, consolidation, trend reversal, trap at the level where traders and bullish robbers are stronger. 🏆💸"Take profit and treat yourself, traders. You deserve it!💪🏆🎉
Entry 📈 : "The heist is on! Wait for the Major Support breakout then make your move at (101.000) - Bearish profits await!"
however I advise to Place sell stop orders above the Moving average (or) after the Support level Place sell limit orders within a 15 or 30 minute timeframe most NEAREST (or) SWING low or high level for Pullback entries.
📌I strongly advise you to set an "alert (Alarm)" on your chart so you can see when the breakout entry occurs.
Stop Loss 🛑: "🔊 Yo, listen up! 🗣️ If you're lookin' to get in on a sell stop order, don't even think about settin' that stop loss till after the breakout 🚀. You feel me? Now, if you're smart, you'll place that stop loss where I told you to 📍, but if you're a rebel, you can put it wherever you like 🤪 - just don't say I didn't warn you ⚠️. You're playin' with fire 🔥, and it's your risk, not mine 👊."
📌Thief SL placed at the nearest/swing High or Low level Using the 4H timeframe (104.000) Day/Scalping trade basis.
📌SL is based on your risk of the trade, lot size and how many multiple orders you have to take.
Target 🎯: 98.500 (or) Escape Before the Target
💰💵💸CAD/JPY "Loonie-Yen" Forex Market Heist Plan (Scalping/Day Trade) is currently experiencing a Bearish trend.., driven by several key factors.👇👇👇
📰🗞️Get & Read the Fundamental, Macro, COT Report, Quantitative Analysis, Sentimental Outlook, Intermarket Analysis, Future trend targets... go ahead to check 👉👉👉🔗🔗
⚠️Trading Alert : News Releases and Position Management 📰 🗞️ 🚫🚏
As a reminder, news releases can have a significant impact on market prices and volatility. To minimize potential losses and protect your running positions,
we recommend the following:
Avoid taking new trades during news releases
Use trailing stop-loss orders to protect your running positions and lock in profits
💖Supporting our robbery plan 💥Hit the Boost Button💥 will enable us to effortlessly make and steal money 💰💵. Boost the strength of our robbery team. Every day in this market make money with ease by using the Thief Trading Style.🏆💪🤝❤️🎉🚀
I'll see you soon with another heist plan, so stay tuned 🤑🐱👤🤗🤩
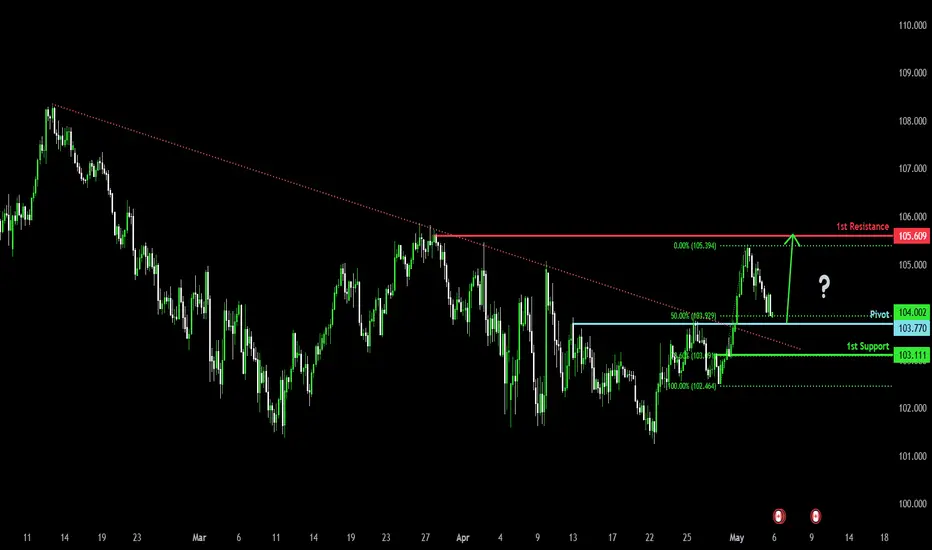
Bullish bounce off pullback support?CAD/JPY is falling towards the pivot which has been identified as a pullback support and could bounce to the 1st resistance which is a pullback resistance.
Pivot: 103.77
1st Support: 103.11
1st Resistance: 105.60
Risk Warning:
Trading Forex and CFDs carries a high level of risk to your capital and you should only trade with money you can afford to lose. Trading Forex and CFDs may not be suitable for all investors, so please ensure that you fully understand the risks involved and seek independent advice if necessary.
Disclaimer:
The above opinions given constitute general market commentary, and do not constitute the opinion or advice of IC Markets or any form of personal or investment advice.
Any opinions, news, research, analyses, prices, other information, or links to third-party sites contained on this website are provided on an "as-is" basis, are intended only to be informative, is not an advice nor a recommendation, nor research, or a record of our trading prices, or an offer of, or solicitation for a transaction in any financial instrument and thus should not be treated as such. The information provided does not involve any specific investment objectives, financial situation and needs of any specific person who may receive it. Please be aware, that past performance is not a reliable indicator of future performance and/or results. Past Performance or Forward-looking scenarios based upon the reasonable beliefs of the third-party provider are not a guarantee of future performance. Actual results may differ materially from those anticipated in forward-looking or past performance statements. IC Markets makes no representation or warranty and assumes no liability as to the accuracy or completeness of the information provided, nor any loss arising from any investment based on a recommendation, forecast or any information supplied by any third-party.
CAD_JPY BULLISH REBOUND|LONG|
✅CAD_JPY is going down now
But a strong support level is ahead at 103.888
Thus I am expecting a rebound
And a move up towards the target of 104.400
LONG🚀
✅Like and subscribe to never miss a new idea!✅
Disclosure: I am part of Trade Nation's Influencer program and receive a monthly fee for using their TradingView charts in my analysis.
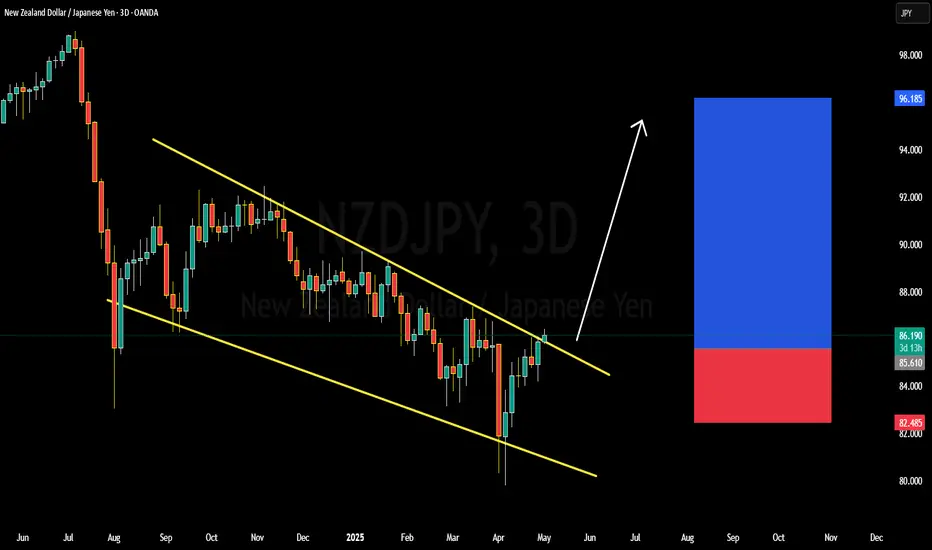
NZDJPY BULLISH OR BEARISH DETAILED ANALYSIS ??NZDJPY has successfully completed a bullish breakout from the descending channel structure that has been forming since mid-2024. The price action respected the trend boundaries flawlessly, and the breakout above the upper trendline confirms a reversal from the previous downtrend. Now trading around 86.200, this pair is showing strong momentum, supported by both technical breakout validation and fresh bullish sentiment in the market.
The pair is now targeting a measured move towards 93.000 in the coming weeks. The breakout is supported by increasing risk appetite across markets, as investors shift from safe-haven currencies like the Japanese Yen toward riskier assets such as the New Zealand Dollar. The sharp rejection from the lower trendline and the steady climb through April and early May marks the beginning of a potential bullish cycle. Traders should watch for retests and bullish continuation patterns to ride this wave.
Fundamentally, the New Zealand economy is seeing upward momentum with recent improvements in dairy exports and a surprise drop in unemployment to 3.8%, beating expectations. On the other hand, Japan’s stagnant inflation data and dovish Bank of Japan stance have weakened the Yen further. The widening interest rate differential between the Reserve Bank of New Zealand and the Bank of Japan continues to favor the Kiwi. This macro backdrop aligns with the technical breakout, offering additional conviction to bullish traders.
With technicals and fundamentals now in alignment, NZDJPY offers a high-probability long setup. Breakout traders and trend followers should consider riding this move toward the 93.000 target, with trailing stops to lock in profits as momentum continues. Keep an eye on global risk sentiment, commodity prices, and upcoming economic data from New Zealand for confirmation along the way.
CAD/JPY at Key Decision Zone: Breakout or Rejection?🕵️♂️ Chart Overview:
Instrument: CAD/JPY
Chart Type: Candlestick
Time Frame: Appears to be intraday (possibly 1H or 4H)
EMAs Used:
50 EMA (Red): 102.814
200 EMA (Blue): 102.710
📊 Key Zones Identified:
1. Immediate Zone (103.30 - 103.50)
Marked as: “Resistance + Support”
This is a key decision zone. Price has tested this region multiple times, showing it holds dual roles — a flip zone.
Price is currently testing this zone again. A break and retest above could confirm bullish momentum.
2. Upper Resistance Zone (104.80 - 105.50)
A broader supply area where previous strong selling pressure occurred.
This is the next logical target if price breaks and holds above 103.50.
3. Lower Support (101.29)
Strong horizontal support, clearly defined from previous lows.
If the price fails to break above the current zone, a rejection could lead to a move back down toward this support.
📈 Bullish Scenario:
Break above 103.50, with a successful retest confirming new support.
Momentum could carry price toward the 105.00–105.50 resistance.
Supported by 50 EMA crossing above 200 EMA (early sign of bullish crossover — Golden Cross).
📉 Bearish Scenario:
Rejection from the 103.30–103.50 zone could signal continuation of range-bound or bearish pressure.
Break below 102.00, followed by momentum towards 101.29 key support.
Would invalidate short-term bullish structure.
📌 Additional Technical Notes:
The chart shows consolidation between 102.00 and 103.50 — likely accumulation or re-accumulation phase.
EMAs are tightening, indicating a potential volatility expansion move is near.
Volume is not visible but would be useful to confirm breakout strength.
📍Conclusion:
CAD/JPY is currently at a critical decision zone. The next few candles will be key. Monitor:
Breakout direction
Retest confirmations
Momentum and volume indicators (if available)

CAD_JPY SHORT SIGNAL|
✅CAD_JPY is set to retest a
Strong resistance level above around 105.800
After trading in a local uptrend for some time
Which makes a bearish pullback a likely scenario
So we can enter a short trade with the
TP of 104.729 and the SL of 105.921
SHORT🔥
✅Like and subscribe to never miss a new idea!✅
Disclosure: I am part of Trade Nation's Influencer program and receive a monthly fee for using their TradingView charts in my analysis.
CAD/JPY Rally Could Fade Near Resistance – Watch for ShortsThe CAD/JPY pair is currently trading within a well-defined descending trendline. Multiple rejections are visible around the 108.300, 105.864, 105.434, and 105.044 levels, confirming strong bearish control over the medium term.
Price has recently bounced from a critical horizontal support near 101.246, forming a short-term bullish move toward the descending trendline. We are now approaching a confluence zone near the 103.800–104.000 area, where the downtrend line intersects. This zone is a potential supply area and could act as a strong resistance.
Trade Idea: Sell Setup Near Trendline (103.800–104.000)
Target: 102.532, 101.250
Invalidation: Break and close above 104.200

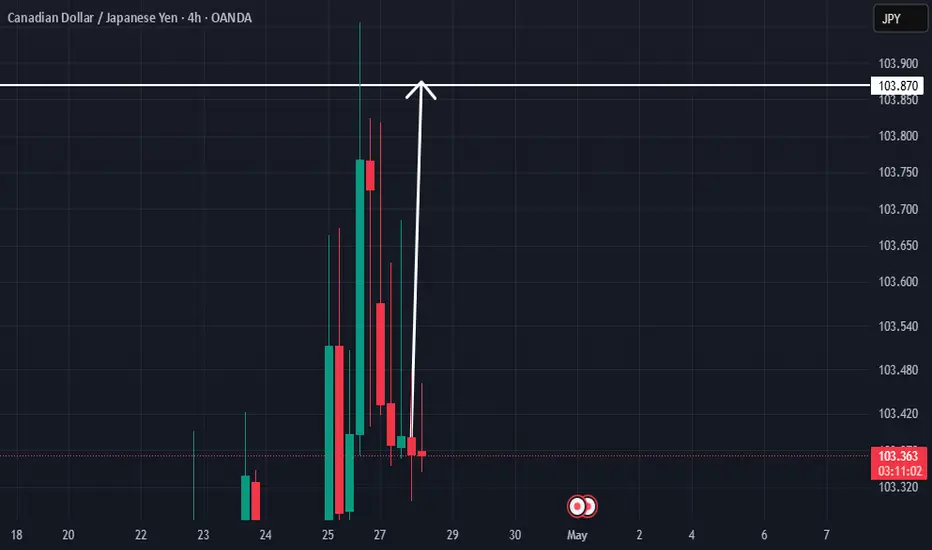
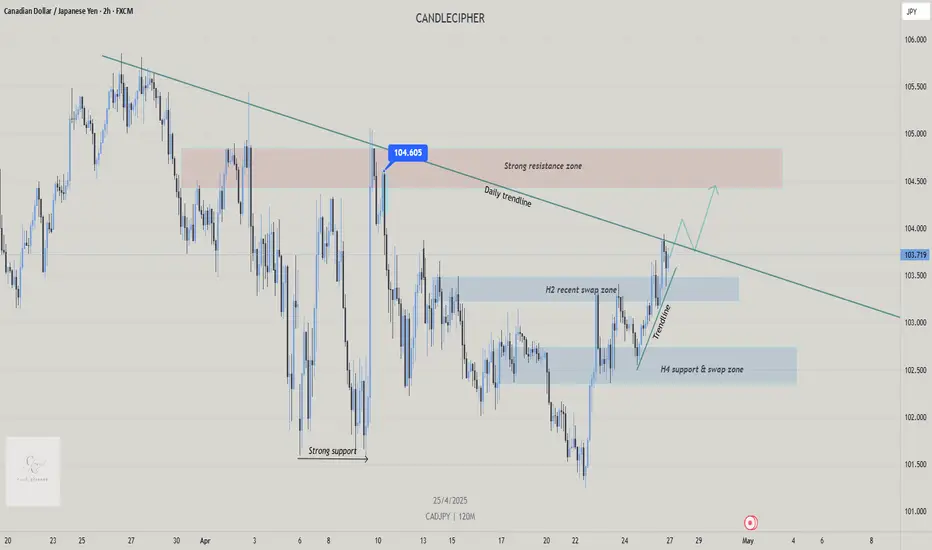
CADJPY Potential longsFX:CADJPY
🇨🇦/🇯🇵
📝 Price spiked by 300 pips after tapping into the strong support on 9 April but lost its momentum shortly after without breaking the daily trendline, suggesting sellers still in control. Price has now reached its daily trendline zone again, on the current price on the day of market close, we see a rejection candle on the 2H chart and slight push upwards.
📝 The buy structures have retraced to its demand zones on each key levels before continuing to push price upwards, forming a compression. If price breaks above the daily trendline and closes above with good momentum, I may expect price to go back and contest the 104.604 candle that gave the bears control for 2 weeks. Therefore, we can use lower timeframe confirmation to hop on buys when price breaks upward and retest.
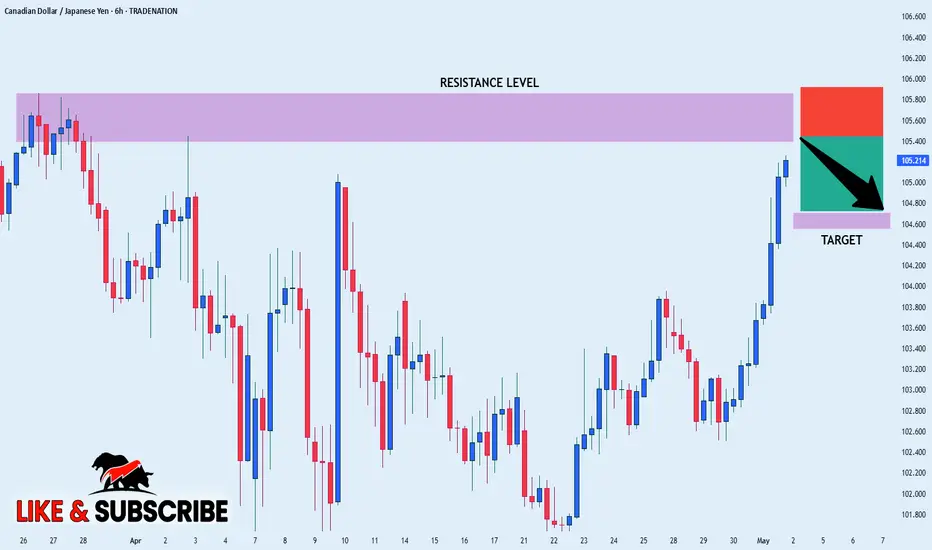
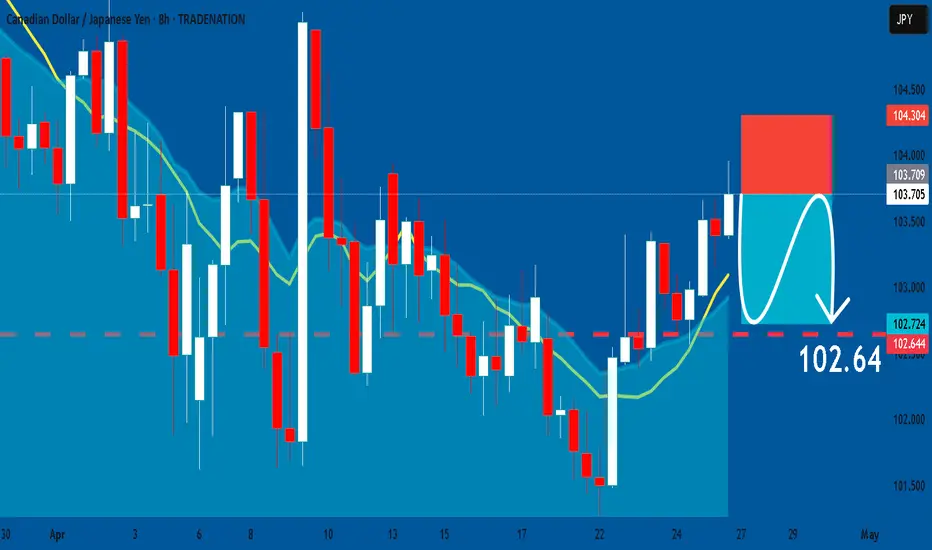
CADJPY: Bearish Continuation & Short Trade
CADJPY
- Classic bearish setup
- Our team expects bearish continuation
SUGGESTED TRADE:
Swing Trade
Short CADJPY
Entry Point - 103.70
Stop Loss - 104.30
Take Profit - 102.64
Our Risk - 1%
Start protection of your profits from lower levels
Disclosure: I am part of Trade Nation's Influencer program and receive a monthly fee for using their TradingView charts in my analysis.
❤️ Please, support our work with like & comment! ❤️
CADJPY Technical Analysis! SELL!
My dear subscribers,
CADJPY looks like it will make a good move, and here are the details:
The market is trading on 103.88 pivot level.
Bias - Bearish
Technical Indicators: Both Super Trend & Pivot HL indicate a highly probable Bearish continuation.
Target - 103.40
About Used Indicators:
The average true range (ATR) plays an important role in 'Supertrend' as the indicator uses ATR to calculate its value. The ATR indicator signals the degree of price volatility.
Disclosure: I am part of Trade Nation's Influencer program and receive a monthly fee for using their TradingView charts in my analysis.
———————————
WISH YOU ALL LUCK

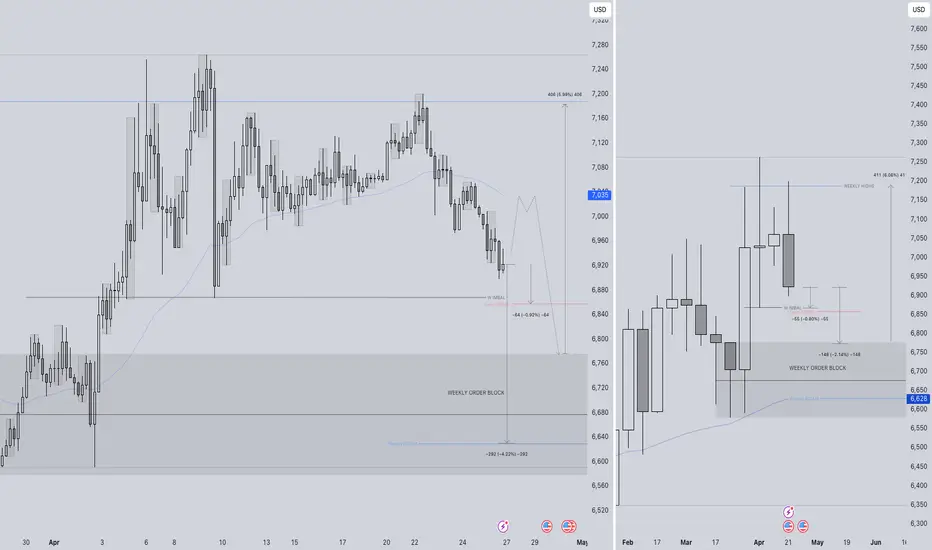
JPY ( YEN )BASKET FORECAST Q2 W18 Y25JPY ( YEN )BASKET FORECAST Q2 W18 Y25
Professional Risk Managers👋
Welcome back to another FRGNT chart update📈
Diving into some Forex setups using predominantly higher time frame order blocks alongside confirmation breaks of structure.
Let’s see what price action is telling us today!
✅The JPY Basket trackS the overall strength of the JPY against a weighted average of other currencies.
✅It can be used as an indicator of YEN strength which can be a tool for analysing and potentially hedging for or against the Index.
✅ Pairs to watch - GBPJPY, USDJPY EURJPY, CADJPY, AUDJPY
🔑 Remember, to participate in trading comes always with a degree of risk, therefore as professional risk managers it remains vital that we stick to our risk management plan as well as our trading strategies.
📈The rest, we leave to the balance of probabilities.
💡Fail to plan. Plan to fail.
🏆It has always been that simple.
❤️Good luck with your trading journey, I shall see you at the very top.
🎯Trade consistent, FRGNT X
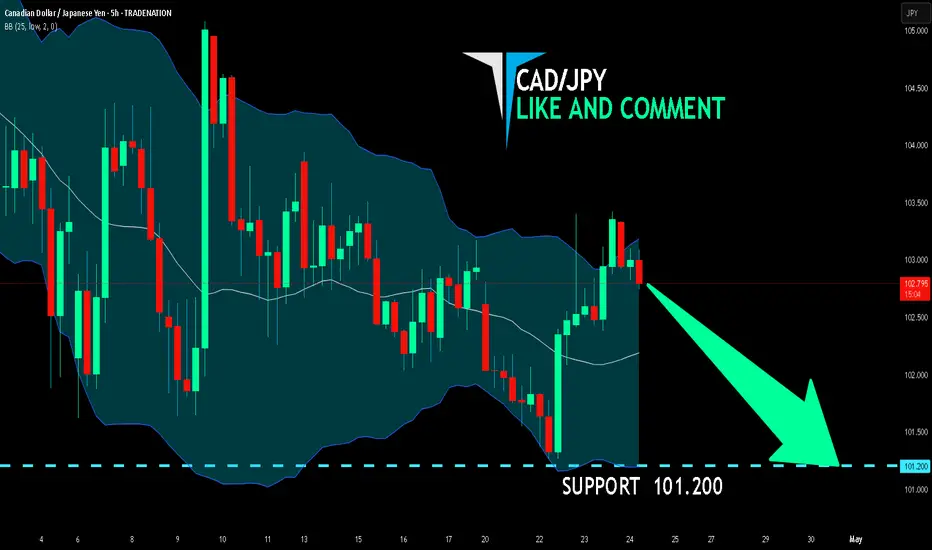
CAD/JPY BEARS WILL DOMINATE THE MARKET|SHORT
Hello, Friends!
Previous week’s green candle means that for us the CAD/JPY pair is in the uptrend. And the current movement leg was also up but the resistance line will be hit soon and upper BB band proximity will signal an overbought condition so we will go for a counter-trend short trade with the target being at 101.200.
Disclosure: I am part of Trade Nation's Influencer program and receive a monthly fee for using their TradingView charts in my analysis.
✅LIKE AND COMMENT MY IDEAS✅