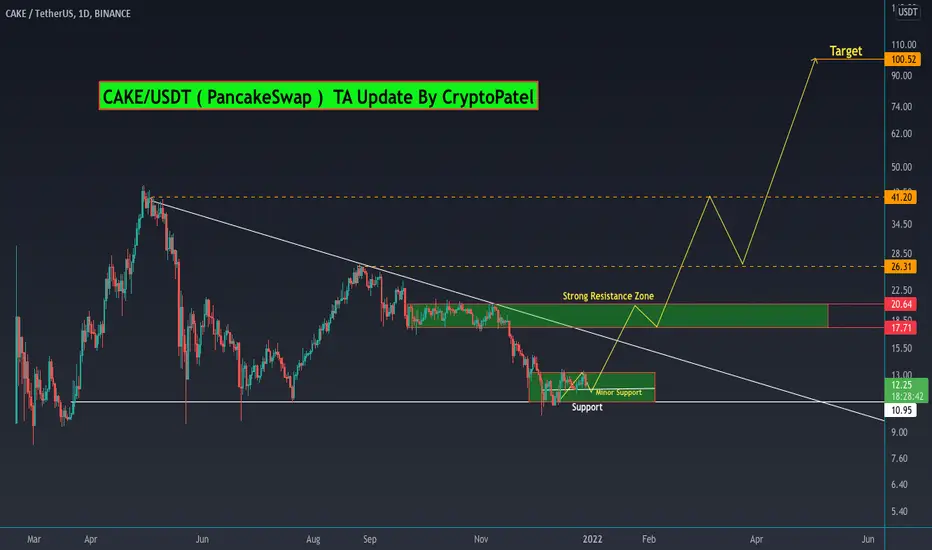
CAKE/USDT ( PancakeSwap ) is support bullish toward $50#CAKE/USDT ( PancakeSwap )
Request Chart:-
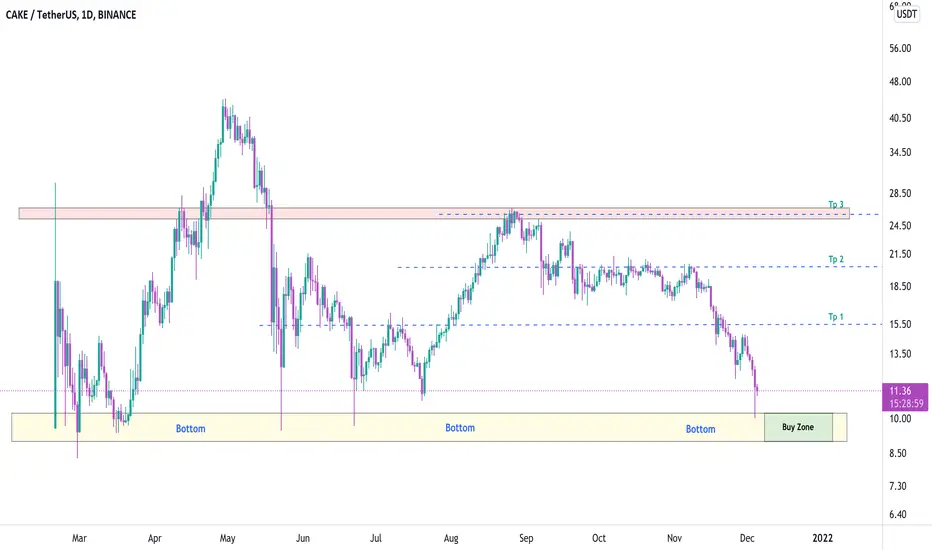
$Cake currently trading around $12
And $Cake is strong exchange coin so Its always better to hold in Long term.
And also $Cake giving good Staking ROI around 70% APR
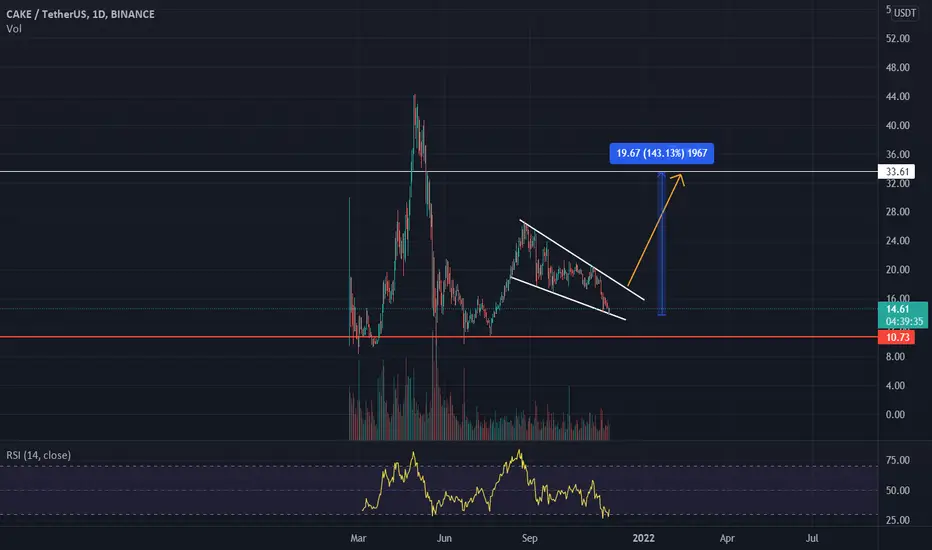
Now as per chart $11-$12.20 is good Accumulation zone.
Targets will be Very high if breaks $17 Strong resistance level.
After Break $17 I personally expected it can Hit $50 and $100 also Possible in Long term.
Its all about Targets.
Stop Loss:- As per chart $Cake will be bearish below $10
So any daily candle close below $10 that not good for Bull.
Cakebtc
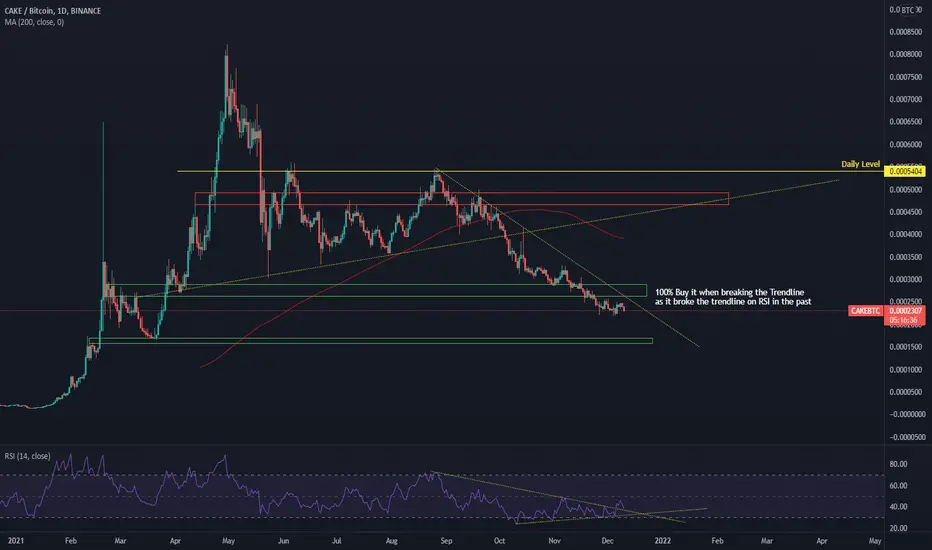
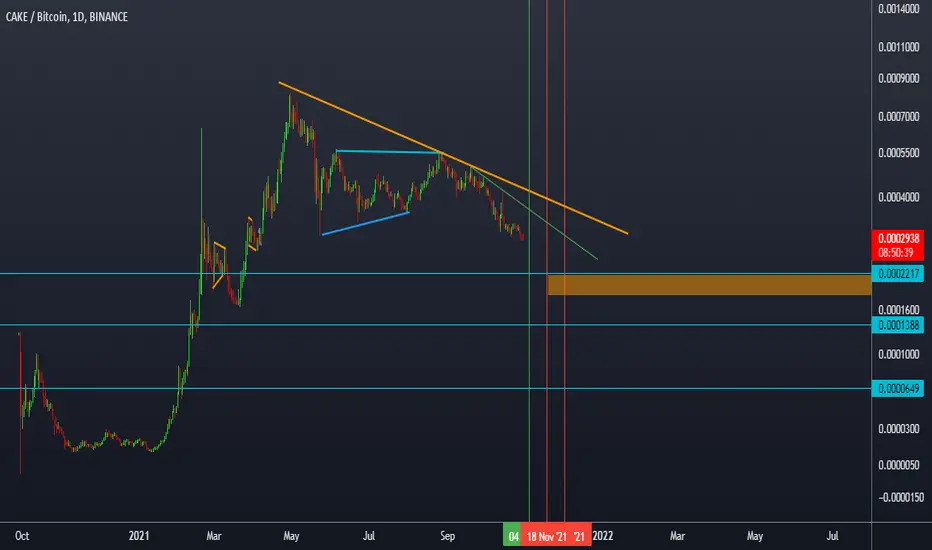
$CAKE, Breaking long descending trendline & showing a Buy signal$CAKE
Under current market conditions, this could be a trap or the start of something bigger.
In any case I will follow my strategy🙂
UCTS Buy printed on the daily(8% up already)
Breaking a long descending trendline & showing the 1st signal since Sep
Take it or leave it
#CAKE

Cake coin chart analysisCake coin chart analysis , as you can see from chart cake is facing high resistance from the trendline drawn .

cake long term setupLong term setup for $Cake
1. Recent token burn - few days back
2. Increasing dex volumes
TA + FA all good
Keep in mind of maintaining stop loss and risk management in ccase of setup fail

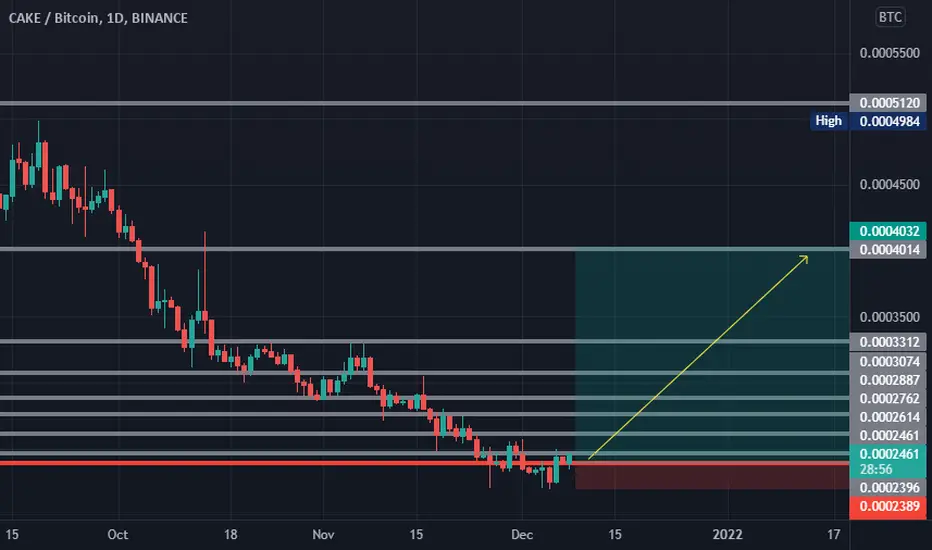
CAKE/BTCFollow it like a hulk and when it break the trendline, make sure to buy it as it broke the RSI trendline and Also has Bullish Divergence.
Cake right now is close to opportunity zone!Hello guys 😃
Before we start to discuss, I would be glad if you share your opinion on this post's comment section and hit the like button if you enjoyed it!
it's simple as drinking water! do not miss the chance, if the price hits 9$ zone(every time the price came near to this zone after a short time this coin pumped) do not hesitate and buy one step!
The mid-term target is MA200 for me.
Note: right now in the BSC chain, Cake has the most TVL! and it's $5.5b also mcap/tvl ratio is 0.5119.these parameters can show us investing in Cake has less risk than other coins for now!
Hope you enjoyed my analysis, You can support me with your likes and comments! (always open to hearing points from the others)
Attention: this isn't financial advice I'm just trying to share my vision and remember we must always see what's up with BTC after that go buy altcoins. never forget investment principles and do your research before investing.
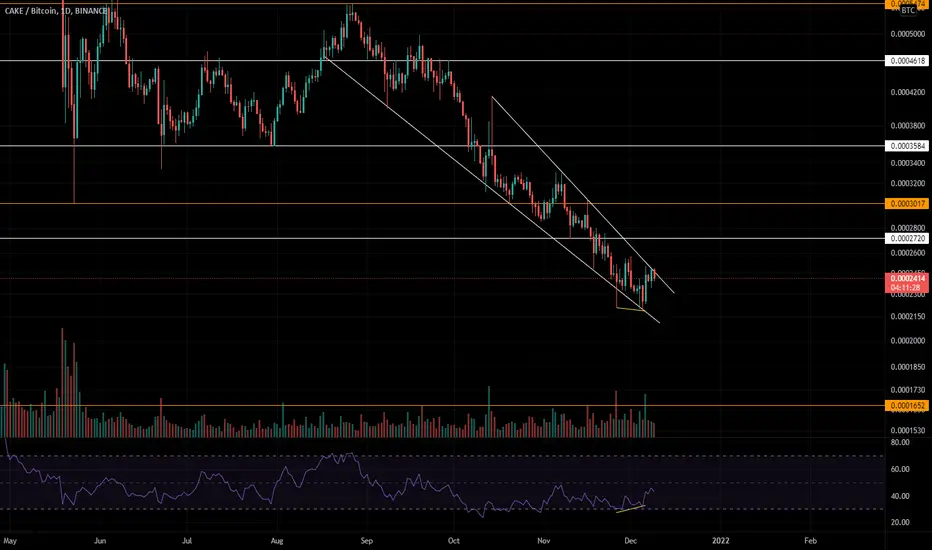
CAKE/BTC RSI DIVCake versus bitcoin looking bullish, confirmed by RSI div on daily and 4h.
White horizontals are daily s/r levels
Orange horizontals are weekly s/r levels
#NFA and #DYOR
PancakeSwap (CAKE) - December 7Hello?
Welcome, traders.
If you "follow", you can always get new information quickly.
Please also click "Like".
Have a nice day.
-------------------------------------
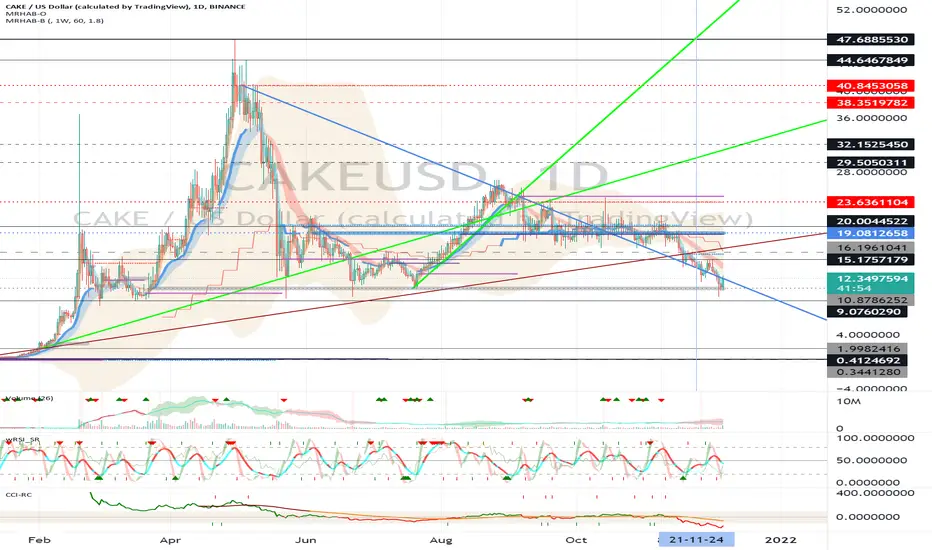
(CAKEUSD 1W Chart) - Mid-Long-Term Perspective
Above 9.0760290 point: Expected to create a new wave.
(1D chart)
It is necessary to check whether it is possible to ascend with support in the volume profile section formed in the section 10.8786252-16.1961041.
If it declines from the 9.0760290 point, there is a possibility of entering the mid- to long-term investment area, so careful trading is required.
To accelerate the uptrend, the price should remain above the 19.0812658 point.
------------------------------------------
(CAKEBTC 1W chart)
1652 Satoshi point and above: expected to continue upward trend
2903 Sakoshi point and above: Expected to create a new wave.
------------------------------------------
We recommend that you trade with your average unit price.
This is because, if the price is below your average unit price, whether the price trend is in an upward trend or a downward trend, there is a high possibility that you will not be able to get a big profit due to the psychological burden.
The center of all trading starts with the average unit price at which you start trading.
If you ignore this, you may be trading in the wrong direction.
Therefore, it is important to find a way to lower the average unit price and adjust the proportion of the investment, ultimately allowing the funds corresponding to the profits to be able to regenerate themselves.
------------------------------------------------------------ -------------------------------------------
** All indicators are lagging indicators.
Therefore, it is important to be aware that the indicator moves accordingly with the movement of price and volume.
However, for convenience, we are talking in reverse for the interpretation of the indicator.
** The MRHAB-O and MRHAB-B indicators used in the chart are indicators of our channel that have not been released yet.
(Since it was not disclosed, you can use this chart without any restrictions by sharing this chart and copying and pasting the indicators.)
** The wRSI_SR indicator is an indicator created by adding settings and options to the existing Stochastic RSI indicator.
Therefore, the interpretation is the same as the traditional Stochastic RSI indicator. (K, D line -> R, S line)
** The OBV indicator was re-created by applying a formula to the DepthHouse Trading indicator, an indicator disclosed by oh92. (Thanks for this.)
** Support or resistance is based on the closing price of the 1D chart.
** All descriptions are for reference only and do not guarantee a profit or loss in investment.
(Short-term Stop Loss can be said to be a point where profit and loss can be preserved or additional entry can be made through split trading. It is a short-term investment perspective.)
---------------------------------
CAKECAKE BTC is close to reaching critical levels, keep watching this chart just in case you want to increase YOUR BTC PORTFOLIO or you like the project "pancakeswap". this chart will help maybe a lot as CAKEUSDT did in the past.
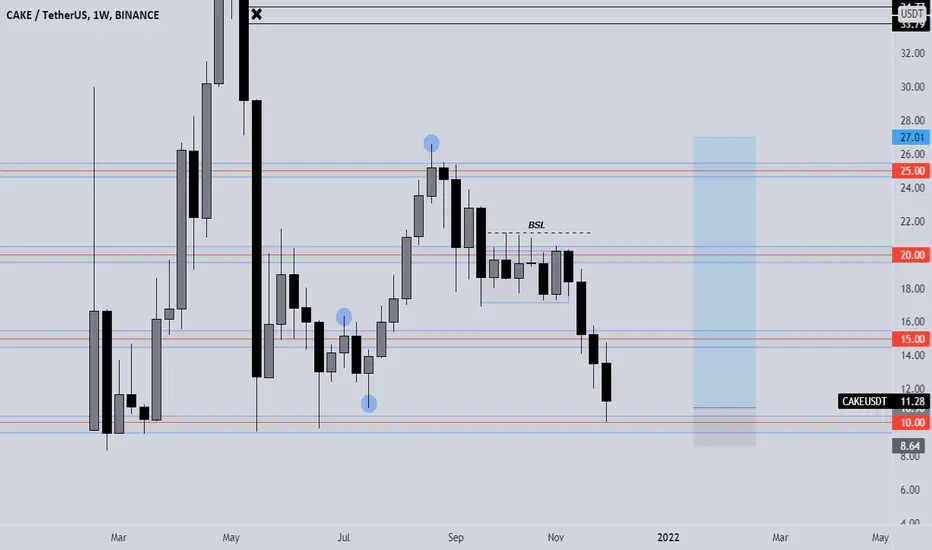
CAKEUSDT PENDING LONGS 💰💰💰The price is approaching a valuable area for DCA LONG TRADES on pankcakeswap, 10$ acts like a strong psychological barrier for the cake holders and i think it woudnt be broken and we will go back into 15/20/25$ area.
What do you think ? Commente below..
CAKEUSDT , We are in bottom of historyHelloooo everybody
According to the chart that we shown everything , the price is currently is in bottom of history and is in heavy support zone that we expect the price can range and support from here
We wanna to publish this idea in one of the community that ... is secret :D :D
You can buy one part of your capital in here and wait until the target reach
Previous analysis :
Good Luck
Abtin
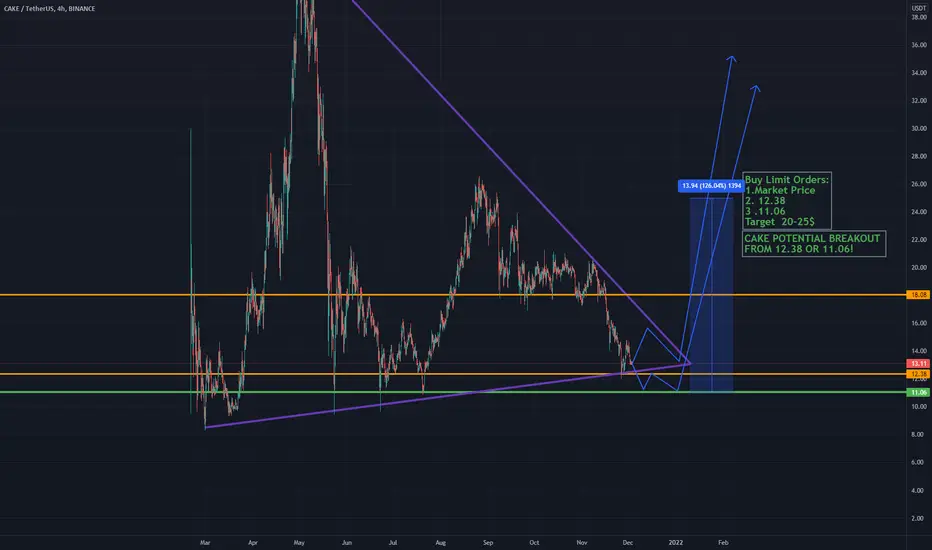
Cake Breakout this month?Cake went down over 70% this year!
I think we are very close to a breakout!
If you have any feedback about the chart pls feel free to tell me:)
MY IDEA ONLY NOT A FINANCIAL ADVICE!!!
Love Yall :)
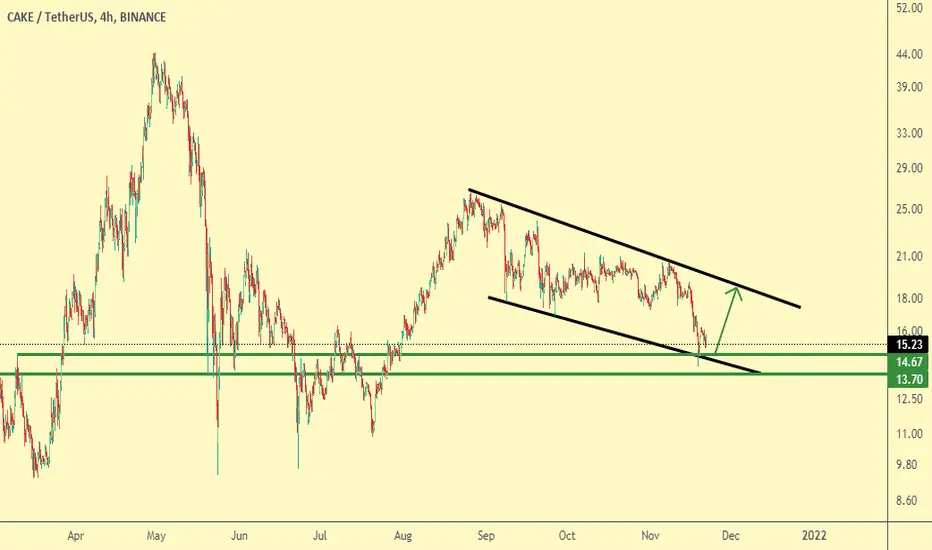
CAKEUSDT - BULLISH SIGNAL UPDATE!!As you all know, CAKE is not performing well from last 3 months and according to the Chart patterns, Decending Bullish Flag is formed, Breakout formation and also indicators giving bullish signal.
Short term Trade, DYOR Before taking trade, as i'm not responsible for your loss.
RISK FACTORS:
Market/ BTC CRASH
Happy Trading :)
Good Luck!
If you like my idea, please support:
Binance Smart Chain ( BSC ): 0x69Ea86D0f6B762fC36A322b0C833D2bd04534b3d
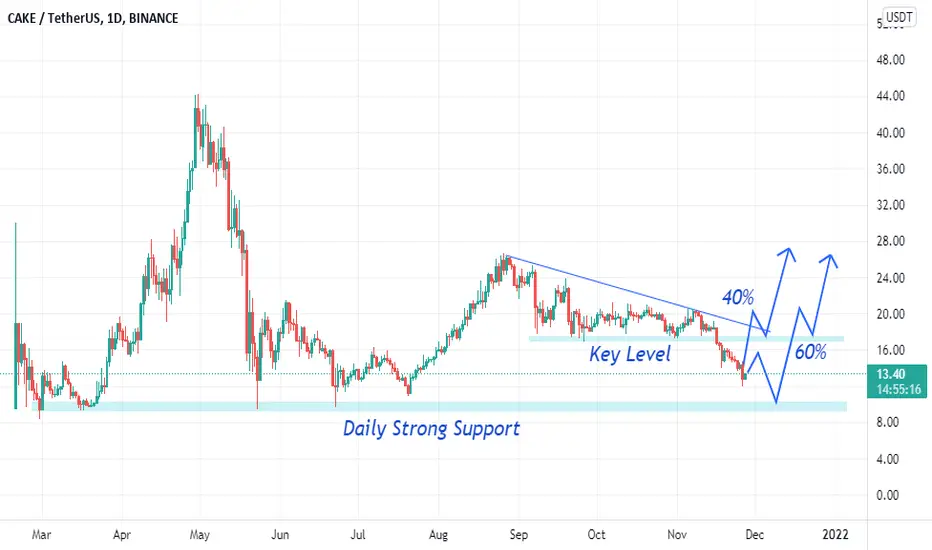
CAKE (pancakeswap) price analysisthere is a H&SH pattern here and if the price breaks above trendline, we may see a rise.

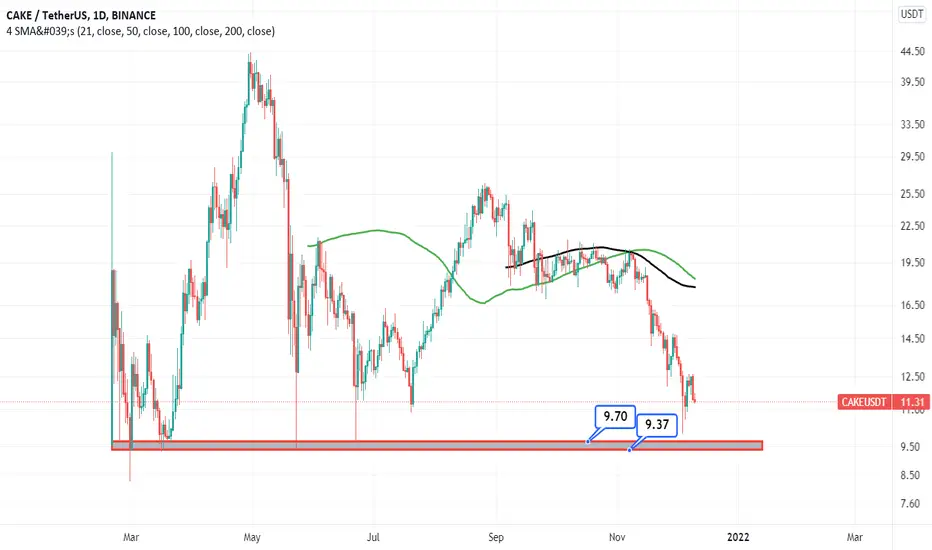
CAKEUSDT Analysis On Daily Hello Trader's
I am sharing my Analysis for Cake and I think you should wait for the price to come down and touch his support. it good for buy/long..
thanks for your support.
Cake - Will double your moneyCAKE is in falling wedge and is ready to move up. Bullish Divergence on RSI will give a good pump soon. They are burning tokens and their TVL is ATH.
CAKE (pancakeswap) price analysisCAKE (pancakeswap) can move like this as it is hovering around a support level.
CAKEUSDT , We should sell now because ...Hello everybody
According to the chart we shown it , we are in downward trend and we had fall down price suddenly but the momentum of the movement is becoming weak to fall more and more , we had breakwave and now its seem the correction of the break wave is done and ready to retest again the bottom that made .
CAKE is one of the most powerful token in DeFi base , and use BSC and BNB for trading , Do you know what does it mean ????
Dont forget use stop loss and observe money management
Good Luck
Abtin
PancakeSwap (CAKE) - November 18Hello?
Welcome, traders.
By "following", you can always get new information quickly.
Please also click "Like".
Have a nice day.
-------------------------------------
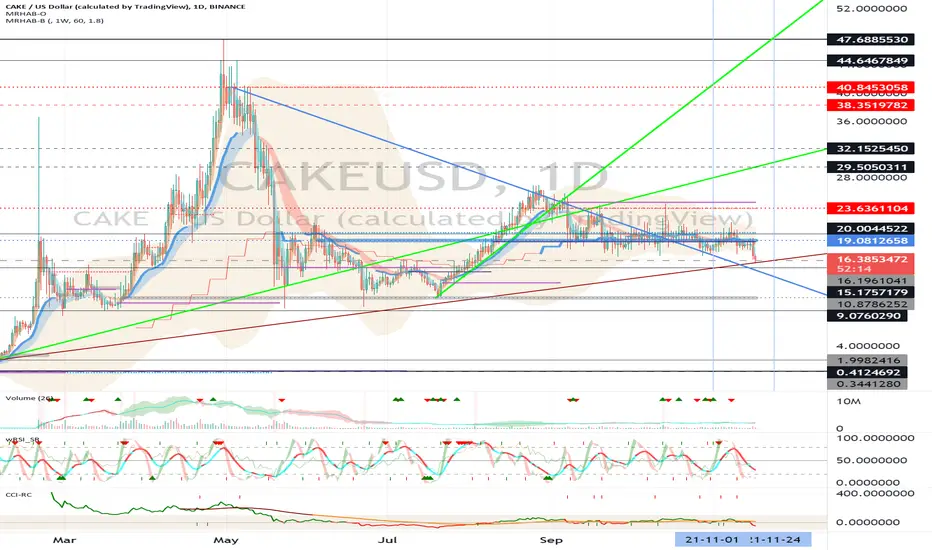
(CAKEUSD 1W Chart) - Mid-Long-Term Perspective
Above the 9.0760290 point: the uptrend expected to continue
Above 15.1757179 point: Expected to create a new wave.
(1D chart)
It must move above the 19.0812658 point to turn into an uptrend.
If the price is maintained above the 15.1757179-16.1961041 range, a move is expected to move upwards above the 19.0812658 point.
If it deviates from the downtrend line, it is expected to rise.
First resistance section: 19.0812658-20.0044522
Second resistance section: 29.5050311-32.1525450
First support section: 15.1757179-16.1961041
Second support section: 9.0760290-10.8786252
------------------------------------------
(CAKEBTC 1W chart)
Above 0.0001652 point: expected to continue uptrend
------------------------------------------
We recommend that you trade with your average unit price.
This is because, if the price is below your average unit price, whether it is in an uptrend or in a downtrend, there is a high possibility that you will not be able to get a big profit due to the psychological burden.
The center of all trading starts with the average unit price at which you start trading.
If you ignore this, you may be trading in the wrong direction.
Therefore, it is important to find a way to lower the average unit price and adjust the proportion of the investment, ultimately allowing the funds corresponding to the profits to regenerate themselves.
------------------------------------------------------------ -----------------------------------------------------
** All indicators are lagging indicators.
Therefore, it is important to be aware that the indicator moves accordingly as price and volume move.
However, for the sake of convenience, we are talking in reverse for the interpretation of the indicator.
** The MRHAB-O and MRHAB-B indicators used in the chart are indicators of our channel that have not been released yet.
(Since it was not disclosed, you can use this chart without any restrictions by sharing this chart and copying and pasting the indicators.)
** The wRSI_SR indicator is an indicator created by adding settings and options to the existing Stochastic RSI indicator.
Therefore, the interpretation is the same as the traditional Stochastic RSI indicator. (K, D line -> R, S line)
** The OBV indicator was re-created by applying a formula to the DepthHouse Trading indicator, an indicator disclosed by oh92. (Thanks for this.)
** Support or resistance is based on the closing price of the 1D chart.
** All descriptions are for reference only and do not guarantee a profit or loss in investment.
(Short-term Stop Loss can be said to be a point where profit and loss can be preserved or additional entry can be made through split trading. It is a short-term investment perspective.)
---------------------------------
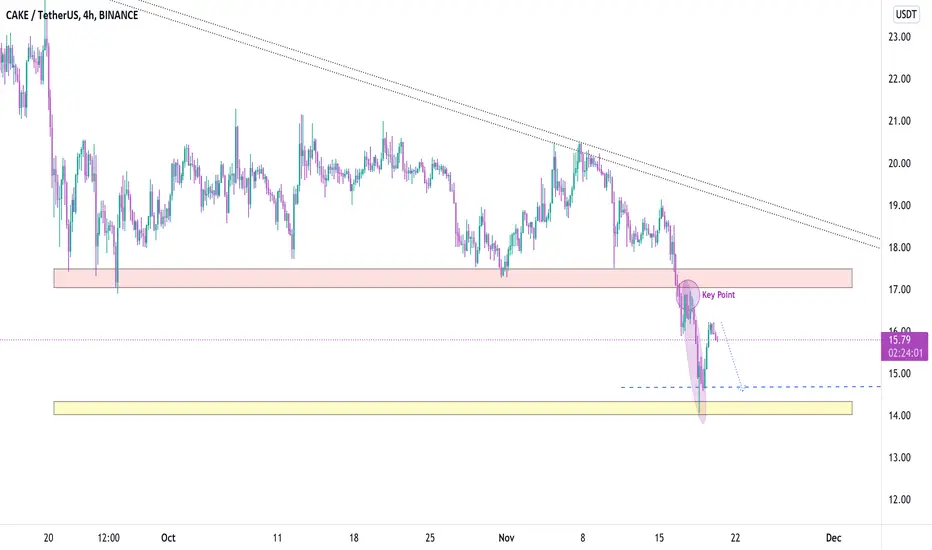
cake update after breaking first supporwe can open our position when we see a good candle on the support area !
" look for the price action "

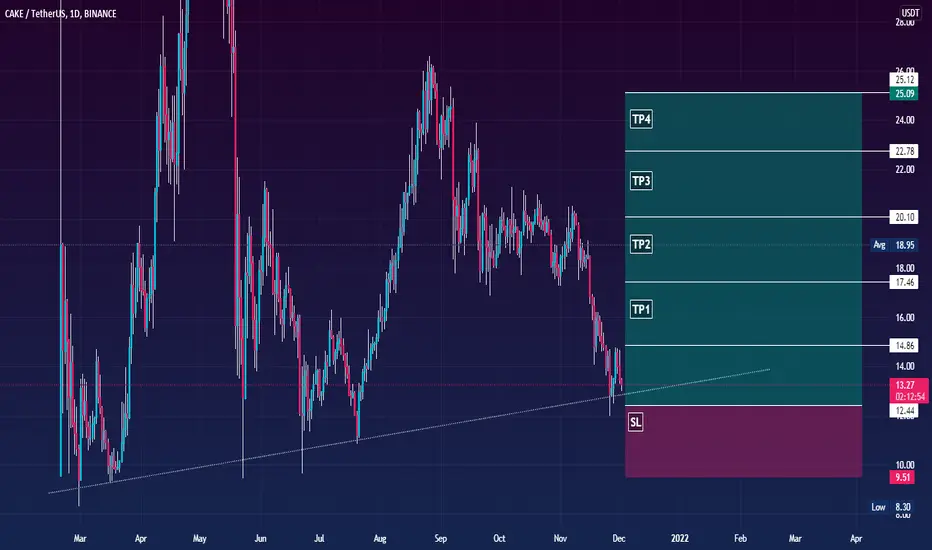
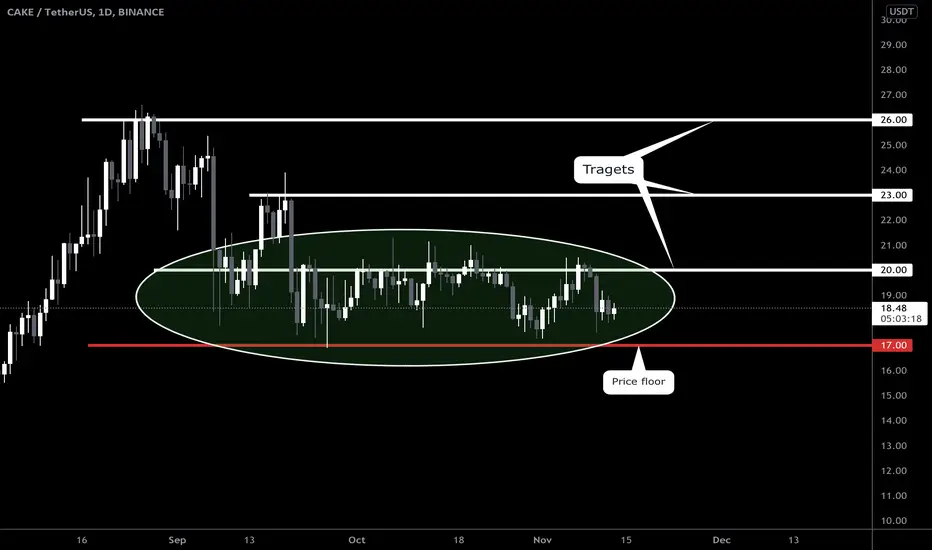
CAKE/USDTOn a daily TF, the price floor of CAKE can be around $17, and you can enter at this price. The price is in the range, and it is at the bottom. If the market grows, the targets are $20, $23, and $26.
Cake is ready for next leg upCake is moving in a parallel channel and is at the bottom of the channel, best spot to buy. This will go back up $50 soon.
