AUDCAD - Incredible Strong AreaHey!
I would like to share one super-strong area from the AUDCAD graph where anybody could find something tradeable after they have made their own research.
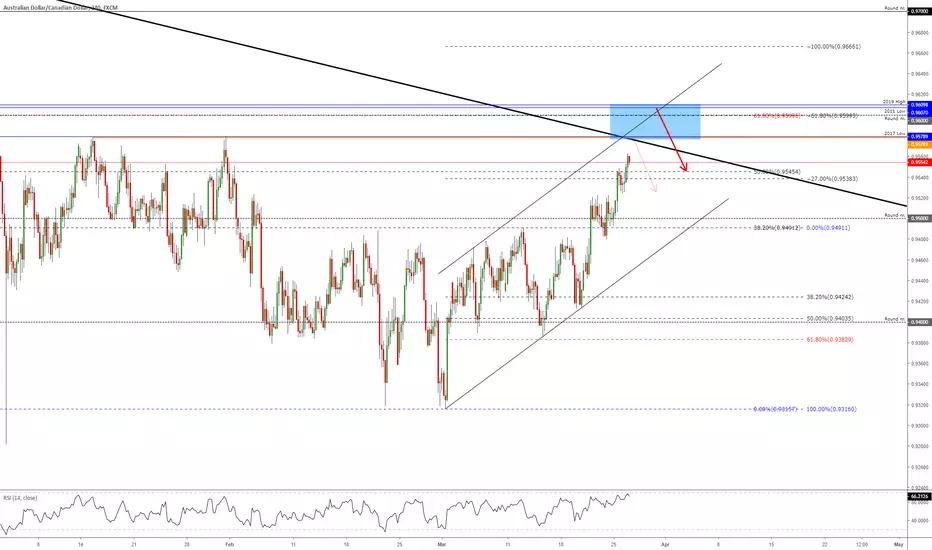
Two major crossing areas in one 32 pips wide box and I will count those criteria which is on this marked blue box and they should ALL act as resistance levels:
1. 2011 low
2. 2017 low
3. 2019 high
4. Round number 0.96000
5. Recently worked resistance level (from mid of January 2018, thin orange line)
6. The trendline since 14. March 2018 (fat black line)
7. Fibonacci 62% retracement level - pulled from 3. December high to 1. March low
8. Fibonacci extension ~161% - pulled from 1. March low to 12. March high
9. Channel projection runs through those areas, which also should act as a resistance.
What the heck ahh?! :)
First arrow retracement (0.95800) arrow consist of:
1. The trendline
2. 2017 low
3. Recently worked resistance level
4. And if it goes right away then channel projection
The second retracement (0.96000) arrow consists of:
1. Fibo retracement 62%
2. Fibo extension 161%
3. 2011 low
4. 2019 high
5. The round number 0.96000
6. Channel projection
As you see, then the second one is a lot stronger than the first one but there are some questions - if it reaches into the second retracement area then the price has made a break above the trendline and the market structure could change. So, to be safer then You have to wait for a daily candle rejection from those levels and it should close below the trendline!
Those were my thoughts and pretty precise guidelines but definitely do your own research!
Do not forget to support my idea post by hitting the "LIKE" button!
Thank You!
Have a nice day,
Cheers!
*This information is not a recommendation to buy or sell, it is used for educational purposes only!