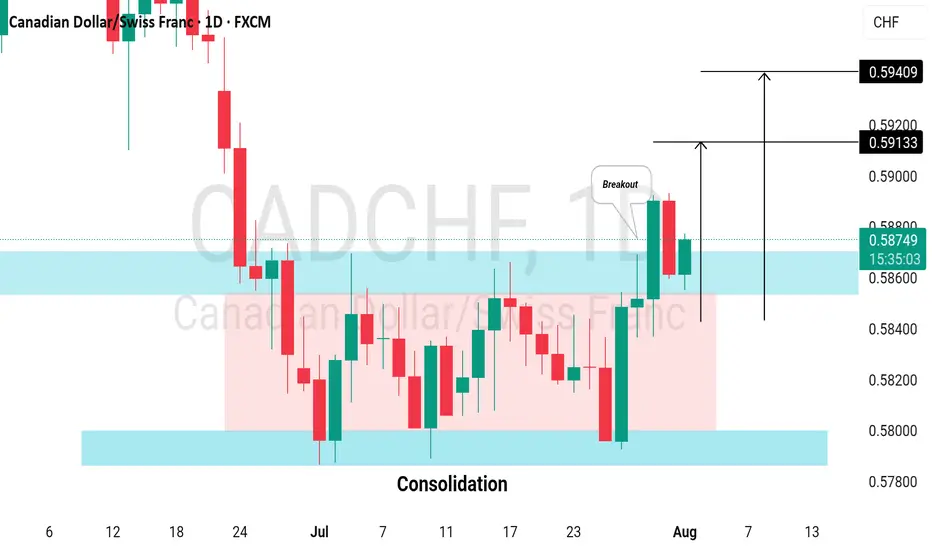
CADCHF: Bullish Continuation After Consolidation📈 CADCHF was consolidating for almost a month in a horizontal range on the daily chart.
Following a significant bullish surge, it broke above resistance yesterday.
The price is likely to continue rising, with targets set at 0.5913 and 0.5940.
Candlestick Analysis
Correction Ahead? SP500 Prints Reversal Signal at Key Resistance📘 This market moves like a textbook chart
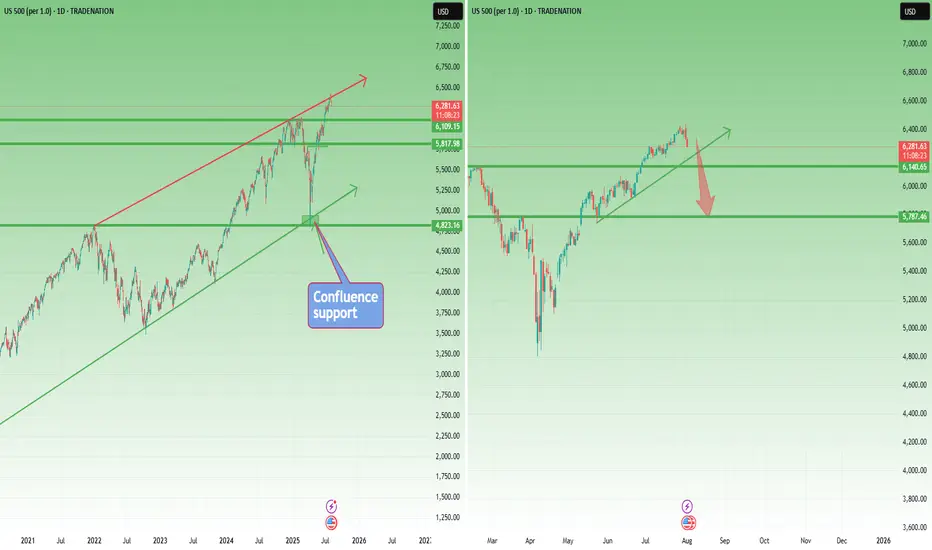
SP500 is acting like a perfect case study from a trading manual. Back in early April, the index dipped just below 5,000, right into a confluence support zone ( I had spoken about this at the time ) – formed by the long-term ascending trendline and the 2022 all-time high. Just like other U.S. indices, the market reversed aggressively from that area.
🚀 A 30% rally in 4 months
From that low, SP500 rallied around 30% in just four months. An incredible move that brought the index straight to the upper boundary of the yearly rising channel.
🕯️ Bearish signal at the top
And just like in NAS100’s case , the index printed a strong Bearish Engulfing candle exactly at that resistance level. This kind of signal, after such a rise, shouldn’t be ignored.
📉 A correction is not only probable – it’s needed
A pullback from here is not just likely, but in my opinion, healthy and necessary . Short-term speculators could look for a move toward the 6,150 zone, which would already offer decent room for profit.
🔍 What if it goes deeper?
I wouldn’t be surprised to see a correction down to 5,750–5,800. That’s about a 10% decline, which wouldn't even classify as a bear market, just a normal reset after a euphoric rally.
🧠 Perspective matters
In a market that gained 30% in four months, a 10% correction is not a crash — it’s discipline being restored.
Disclosure: I am part of TradeNation's Influencer program and receive a monthly fee for using their TradingView charts in my analyses and educational articles.
XRP Critical Levels to Play This MonthHello I am the Cafe Trader.
This weekend we are shifting focus into the crypto market for a quick overview. If you read my last XRP article, we nailed the bottom for longs, and the sellers for a great positional play. This time we are going to analyze the current failed breakout.
Are Bulls Trapped? Does this still have room to leg up?
Point 1
We can start with the trend break. Massive buyers pushed this move higher, giving XRP a relatively quick All time high, But July 23rd shorts were able to shove this back inside of the previous high.
This signifies that there are bulls trapped, but the interesting thing to note is that the volume has reduced significantly since the last two ATH's. So this also would indicate a lack of buying interest at the highs.
Buyers are just not willing to to get involved with the same conviction as before (yet). No buyers, no continuation (even if there is not many sellers/profit takers).
Point 2
Strong buyers proved their interest with a "hot" reaction at $2.95.
With no "real" seller coming into this market yet, there is nothing stopping this continuation from legging up (so far).
Therefore I stand bullish, and am looking for a move up to $4.64 as a Target.
Point 3
Buying into this can feel tricky, your first entry for a classic two bar trend break would've been at the top of demand. I do think we will get another opportunity here, I definitely would not chase this, because it could play this range for a while before another leg up.
Setup
Trend break continuation.
Entry 3.13
Stop 2.65
Exit TP 4.64
Risk to Reward 3.1
If there is a close below these strong buyers, this could com all the way back down to 2.15-2.3 at least.
The reason for the wider stop here is because we don't want to get swept and then ran. A more conservative stop could be $2.85 which would be a 6R trade. Take your pick
Long Term
If you are late to the party on XRP (I know many are) here are some entries according to your sentiment:
Almost FOMO = 3.13
Aggressive = 2.95
Good price = 2.15-2.3
Steal = 1.60 - 1.93
That's all for XRP. We are going to be looking at Ethereum ETH Next.
Thanks for reading and happy trading!
@thecafetrader

Top in Place? NASDAQ100 Signals Exhaustion After Incredible Run📈 The crazy run since April
NASDAQ100 has had a spectacular run since early April, when the index dipped to 16,300 amid rising tensions caused by Trump’s tax war. From that low, we’ve seen a mind-blowing rally of over 7,000 points, which translates to a 40% gain in just 4 months.
Such a rise is not just impressive— it’s overextended , especially by historical standards. Markets don’t move in straight lines forever, and this one might be showing signs of fatigue.
🕯️ Bearish signal at the top
Fast forward to this week: yesterday, the index marked a new all-time high at 23,700, but closed the day with a strong bearish engulfing candle — one that wipes out the gains of the previous 4 trading sessions.
This is not a small technical detail. Such candles, when appearing after an extended rally, often signal exhaustion and a potential shift in momentum.
❗ Top in place?
In my opinion, there's a high probability that a top has been set, at least temporarily. We might be looking at the beginning of a healthy correction, or even something more meaningful, depending on follow-through in the next sessions.
📉 Where to next?
The first major support to watch is the 22,200 level.
I expect that zone to be tested soon — and honestly, considering how much the index has gone up, this shouldn’t surprise anyone. It’s nothing more than a minor pullback, all things considered.
🧠 Stay smart!
When markets go vertical, it pays to stay disciplined and realistic. Tops rarely announce themselves, but when signals like this appear, it’s wise to listen.
Disclosure: I am part of TradeNation's Influencer program and receive a monthly fee for using their TradingView charts in my analyses and educational articles.

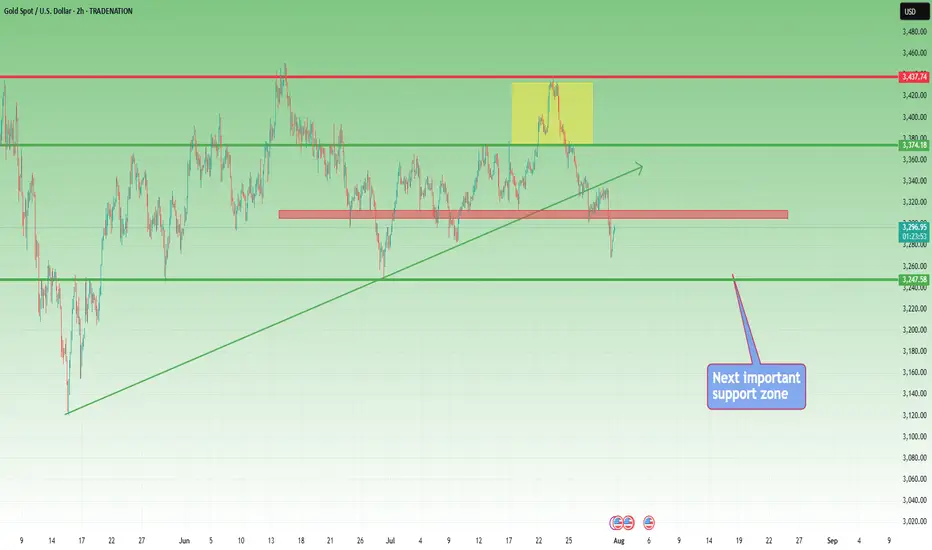
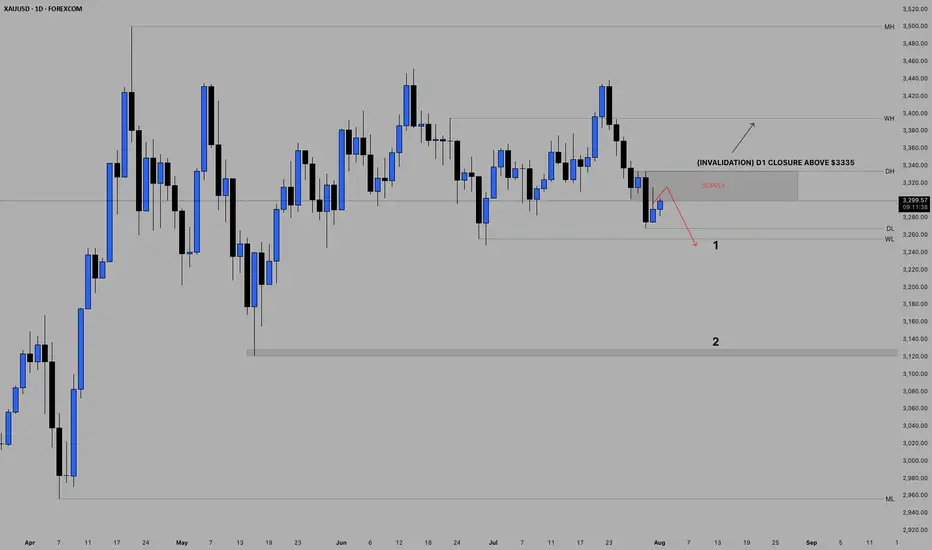
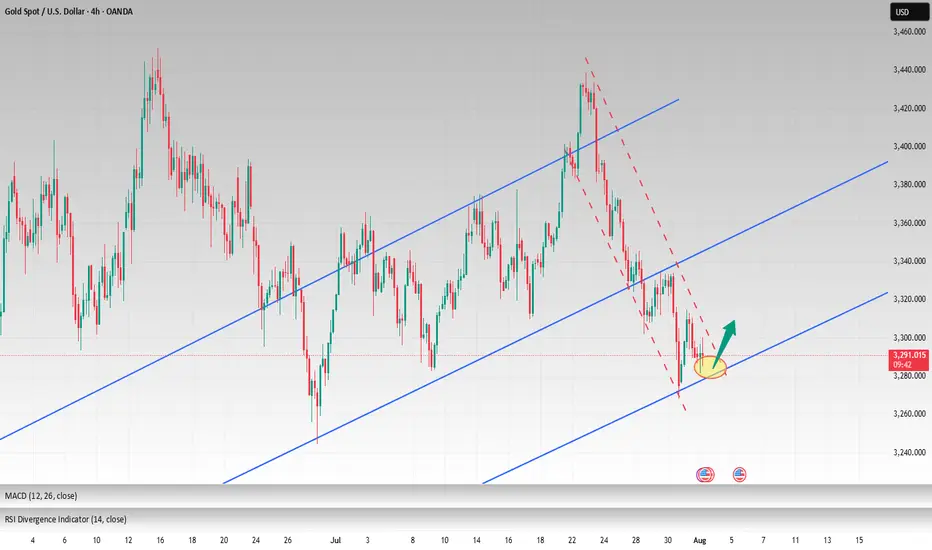
XAUUSD Update – Down Continuation to 3250?1. What Happened Yesterday
After an anemic correction that formed a bearish flag, Gold finally broke below 3300 and even dipped under the 3280 support zone — which was my primary downside target. While the move during the day didn’t have enough momentum to reach my second sell limit, I was already in a low-volume short position, so I didn’t miss the move entirely.
2. The Key Question
Has the drop ended, or are we looking at further downside?
3. Why I Expect More Downside
• The overall structure remains bearish.
• The newly formed resistance (previous support) is now the new sell zone.
• If the price drops towards 3280 again, continuation to 3250 becomes very probable.
4. Trading Plan
Selling rallies remains the preferred strategy, especially on spikes into resistance. As long as the price stays below 3335-3340 zone, the bearish outlook remains intact.
5. Conclusion
Sell the rallies. The technical picture still favors downside continuation — no need to overcomplicate it. 🚀
Disclosure: I am part of TradeNation's Influencer program and receive a monthly fee for using their TradingView charts in my analyses and educational articles.
POSSIBLE BEARISH CONTINUATION ON GOLDBased on price action, Gold presents a very bearish sentiment from the daily point of view.
The indicated supply region may be the area of interest for the build up of the sells if indeed Gold is bound for the monthly lows.
Confirmation is needed for an entry.
Doge is a LaggerHello I am the Cafe Trader.
Today we are looking at DOGE.
Normally I refuse to look at "Meme Coins" but with a 33 Billion Dollar Market cap, I don't think it falls into it's own category.
Doge, like many Crypto, have come alive. If this is one you are looking at, here are the Keys:
Short Term
A new seller did prevail as of July 23rd. It's important to note that they are still not in control of this rally. We need to see a key buyer get taken out first. This leads us to the scenario I have drawn.
Green Machine
Big buyers move markets... A lot. They can't buy what they want to buy on the open market without a reaction, so what do they do? Simple
Buy... then wait... then buy again near where they bought before.
So your "Strong buyer" is that area.
You have passive buyers looking to get a good price at 19.223 This would offer the greatest position for a reversal and a continuation.
Long
Entry - .19.250
Stop - .17.050
1st TP .24.050
2nd TP .28.600
Final TP .38.250
This should take at least a month. Be prepared to not look at it everyday.
Long Term
These prices should reflect your sentiment on DOGE.
Aggressive = .20.650
Good Price = .18.900 - 19.250
STEAL = 13.950 - 14.550
Thanks for reading, Don't forget to Boost and Follow !
Happy Trading
@thecafetrader

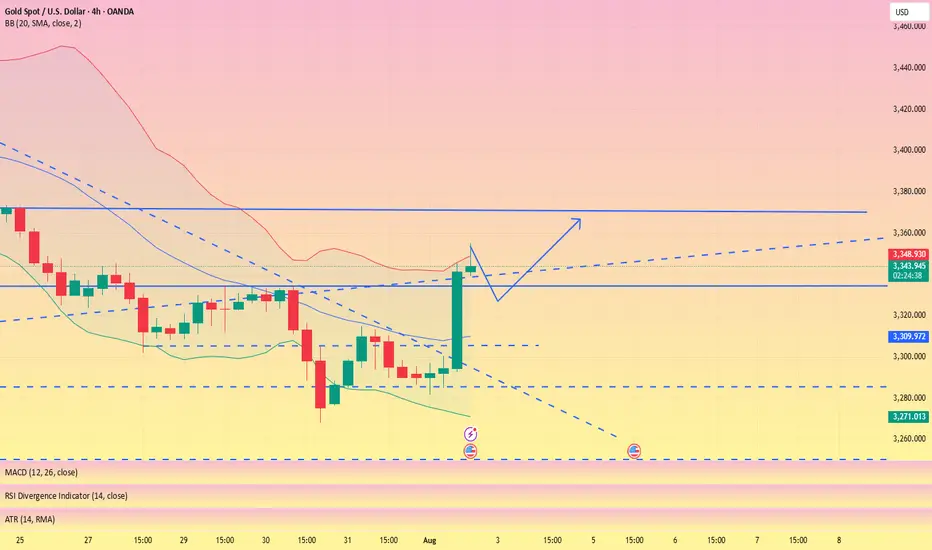
NFP data is positive, the bullish trend remains unchanged#XAUUSD
The current market, influenced by data such as NFP, remains bullish, even briefly pushing towards the 4H upper limit of 3350, reaching a high near 3354.📈
In the short term, gold still has upward momentum and could even reach the previous high resistance level near 3375.🐂
Currently, gold is undergoing a technical correction and needs to begin a pullback to accumulate more bullish momentum, giving traders who previously missed the opportunity to get on board.🚀
As resistance continues to rise, support below will also rise. 📊If gold retreats below 3335-3315, consider going long.📈
🚀 SELL 3335-3315
🚀 TP 3350-3375
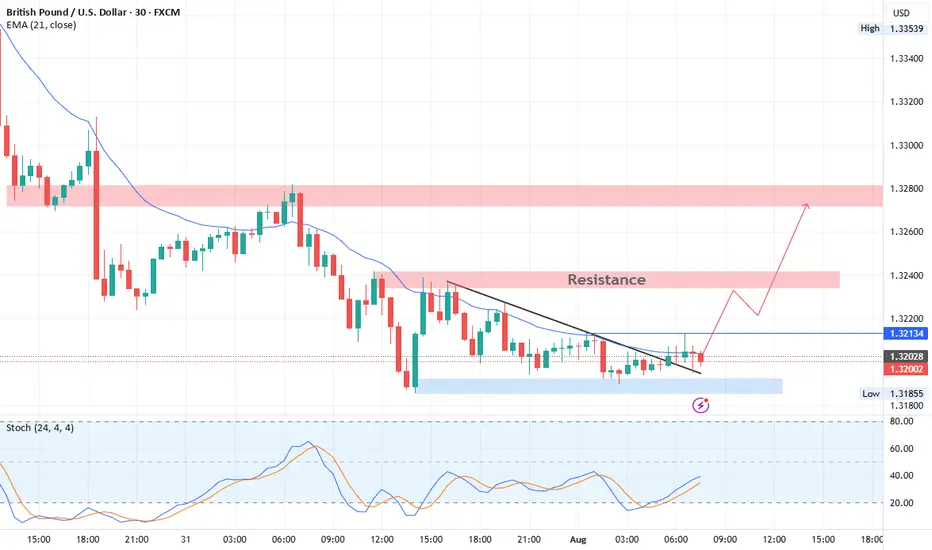
GBPUSD Technical BreakdownTrendline Breakout:
Price has decisively broken above a short-term descending trendline, signaling a potential shift in intraday momentum from bearish to bullish.
Support Zone (1.3185 – 1.3195):
This demand area has provided a strong base, with multiple successful rejections confirming buyer interest.
Resistance Levels:
Near-term resistance: 1.3213 (minor breakout level – watch for retest)
Key upside targets: 1.3240 followed by the major supply zone at 1.3275 – 1.3290
📈 Trade Outlook:
Bias: Bullish above 1.3213
Entry Idea: Look for bullish confirmation on a retest of 1.3213 as support
Targets:
TP1: 1.3240
TP2: 1.3275 – 1.3290
Invalidation: A sustained move below 1.3185 would invalidate the setup and reopen downside risk.
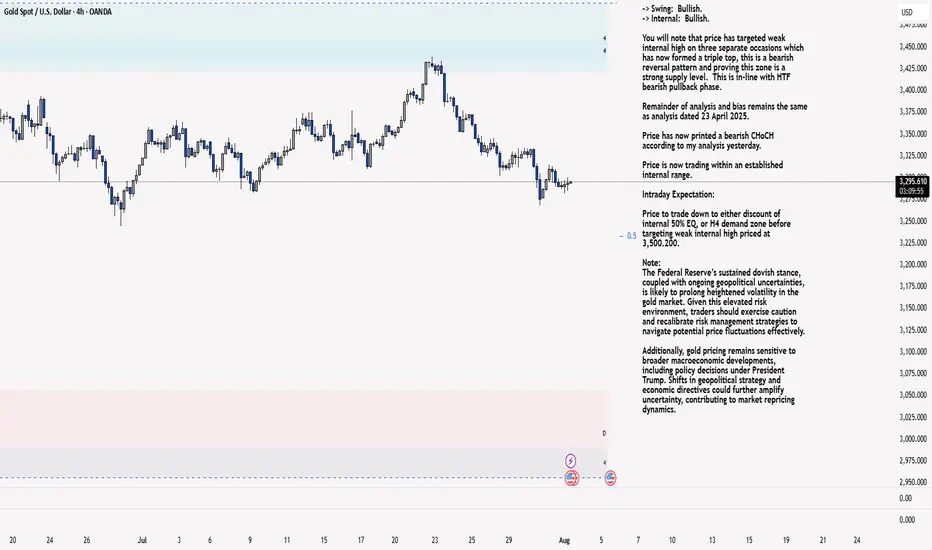
XAU/USD 01 August 2025 Intraday AnalysisH4 Analysis:
-> Swing: Bullish.
-> Internal: Bullish.
You will note that price has targeted weak internal high on three separate occasions which has now formed a triple top, this is a bearish reversal pattern and proving this zone is a strong supply level. This is in-line with HTF bearish pullback phase.
Remainder of analysis and bias remains the same as analysis dated 23 April 2025.
Price has now printed a bearish CHoCH according to my analysis yesterday.
Price is now trading within an established internal range.
Intraday Expectation:
Price to trade down to either discount of internal 50% EQ, or H4 demand zone before targeting weak internal high priced at 3,500.200.
Note:
The Federal Reserve’s sustained dovish stance, coupled with ongoing geopolitical uncertainties, is likely to prolong heightened volatility in the gold market. Given this elevated risk environment, traders should exercise caution and recalibrate risk management strategies to navigate potential price fluctuations effectively.
Additionally, gold pricing remains sensitive to broader macroeconomic developments, including policy decisions under President Trump. Shifts in geopolitical strategy and economic directives could further amplify uncertainty, contributing to market repricing dynamics.
H4 Chart:
M15 Analysis:
-> Swing: Bullish.
-> Internal: Bullish.
H4 Timeframe - Price has failed to target weak internal high, therefore, it would not be unrealistic if price printed a bearish iBOS.
The remainder of my analysis shall remain the same as analysis dated 13 June 2025, apart from target price.
As per my analysis dated 22 May 2025 whereby I mentioned price can be seen to be reacting at discount of 50% EQ on H4 timeframe, therefore, it is a viable alternative that price could potentially print a bullish iBOS on M15 timeframe despite internal structure being bearish.
Price has printed a bullish iBOS followed by a bearish CHoCH, which indicates, but does not confirm, bearish pullback phase initiation. I will however continue to monitor, with respect to depth of pullback.
Intraday Expectation:
Price to continue bearish, react at either M15 supply zone, or discount of 50% internal EQ before targeting weak internal high priced at 3,451.375.
Note:
Gold remains highly volatile amid the Federal Reserve's continued dovish stance, persistent and escalating geopolitical uncertainties. Traders should implement robust risk management strategies and remain vigilant, as price swings may become more pronounced in this elevated volatility environment.
Additionally, President Trump’s recent tariff announcements are expected to further amplify market turbulence, potentially triggering sharp price fluctuations and whipsaws.
M15 Chart:
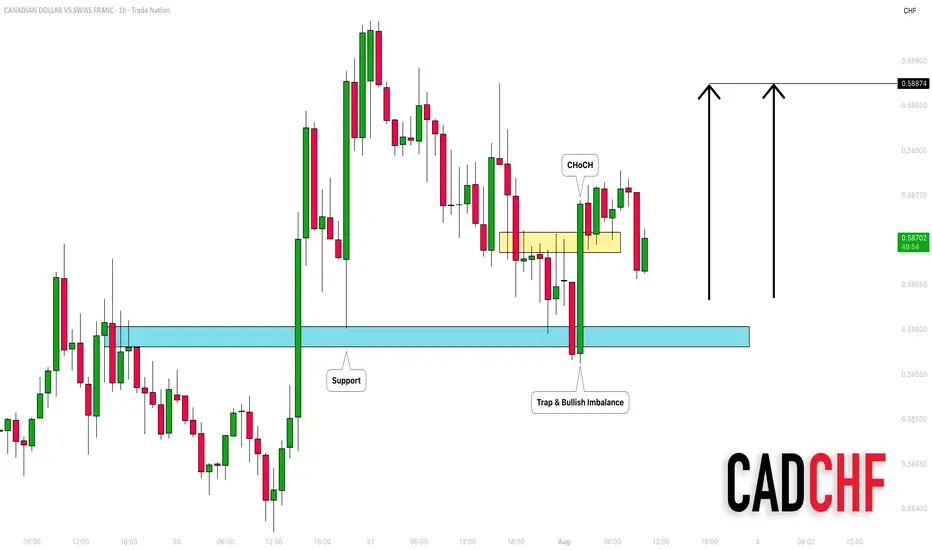
CADCHF: Bullish Move After the Trap 🇨🇦🇨🇭
There is a high chance that CADCHF will go up today.
After a test of a key horizontal support, the price formed
a liquidity grab with a consequent bullish imbalance.
We can expect growth to 0.5887
❤️Please, support my work with like, thank you!❤️
I am part of Trade Nation's Influencer program and receive a monthly fee for using their TradingView charts in my analysis.
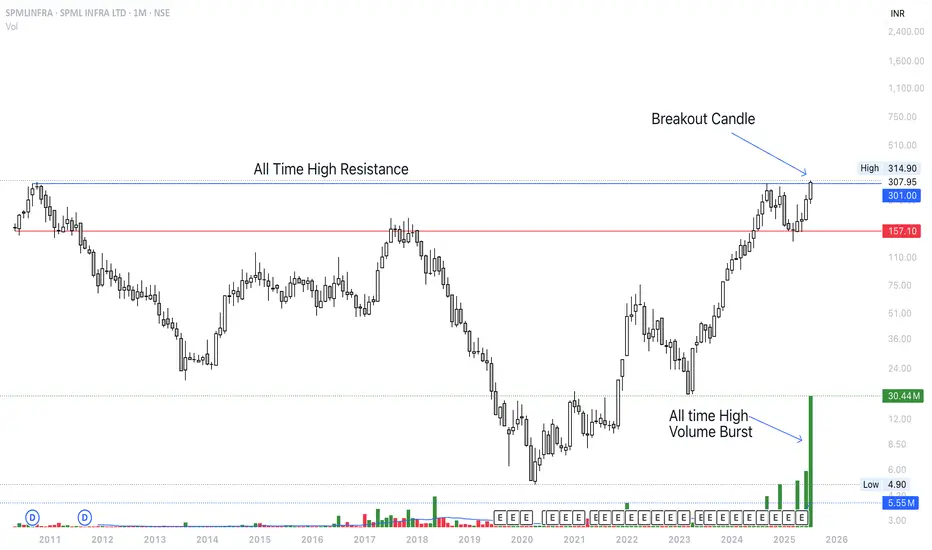
Breakout Soon <> SPMLINFRAStock is pushing above All time High resistance level. Keeping on radar. It would have been solid breakout if the Monthly closing was above 310 level. Volume also supporting the level. Recently realty sector rally also supporting.
META Double Top? Think Again. Hello, my name is The Cafe Trader.
As part of our MAG 7 Series, we tackle META next on the list.
This article is for:
– Long-Term Investors
– Long-Term Hedges
– Swing Traders
– Options Traders
⸻
Brief Notes:
1. Meta is going all-in on AI, integrating it across all platforms (Instagram, Facebook, WhatsApp…).
2. 97% of Meta’s revenue still comes from ads. They’ve rebounded strongly from Apple’s policy changes—thanks in large part to AI targeting.
3. Meta is thinking long-term with AR/VR.
4. International user growth has exploded.
Conclusion: Bullish winds continue to blow behind META.
⸻
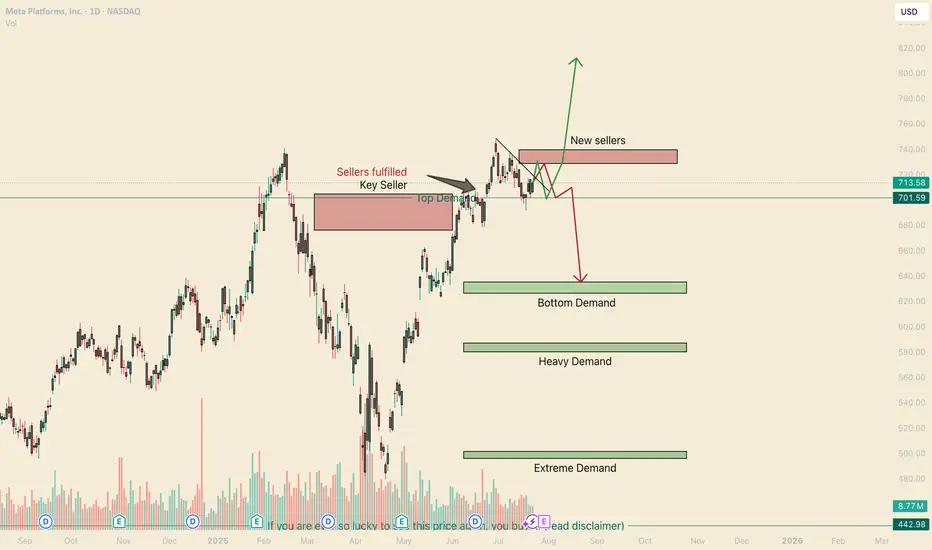
Long-Term Levels
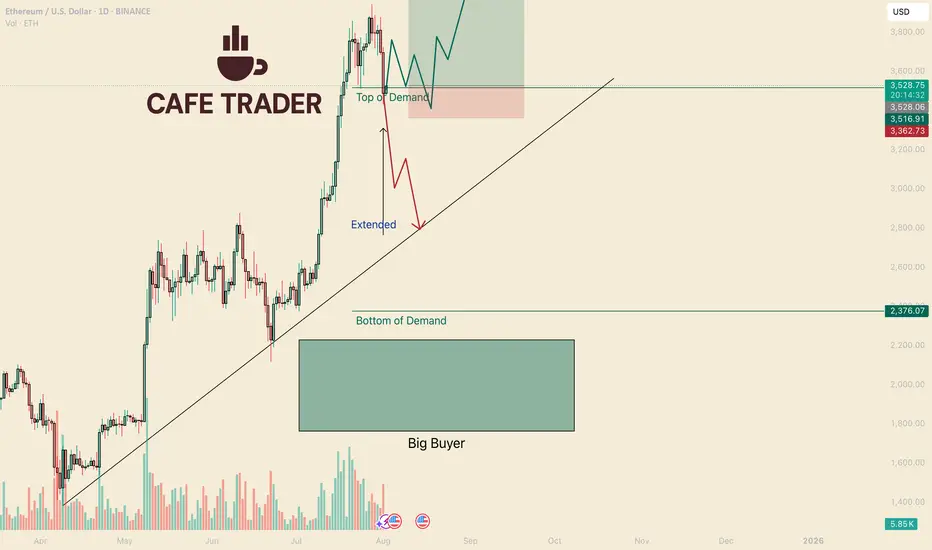
• Aggressive Buy = $701.59 → Marked as “Top of Demand.” This is where aggressive buyers are looking to add.
• Good Value = $626–$635 → Marked “Bottom of Demand.”
• STEAL = $496–$501 → Marked “Extreme Demand.”
Why not buy at the ‘Heavy Demand Zone’?
Great question. If bears take out those buyers above this zone, it suggests something major has shifted in sentiment around META.
Even though there’s heavy demand here, I’d want to observe how sellers approach the area. You’ll likely get multiple chances to enter if buyers defend it. But if it breaks down, the best pricing lies at “Extreme Demand.”
For long-term holders looking to hedge downside, I suggest a Bear Put Spread or outright puts. More on this under the Red Scenario Options.
⸻
For Traders
Let me be real—this chart is tricky.
The V-shaped recovery signals strong bullish interest. That insane rally took out a major seller, further fueling the bulls.
That said, how we pulled away from the previous ATH (all-time high) shows weakness—low buying interest, followed by a real seller stepping in.
So yeah, I’m mixed on sentiment. But I’m confident in identifying liquidity and managing exits fast.
⸻
Two Scenarios
✅ Green Scenario
– Stock:
The bounce off “Top of Demand” is a strong bullish signal. Bears will be under pressure around $729, though I expect one more rejection before we break through.
I liked the original entry at “Top of Demand.” If entering again, I’d wait for a crack below that zone and watch the close—if we recover and close above it (especially if the dip was deep), that’s a strong signal to re-enter.
Target: take partial or full profits around $729. Hold the rest for highs or a breakout.
– Options:
If you can grab the 715 Calls with 3–5 days out for under $4.50, this setup could easily hit 2–3R.
Even better if you can get closer-to-the-money contracts for cheaper.
⸻
❌ Red Scenario
– Stock:
I believe this “new seller” is a fabricated seller—likely to get squeezed.
But if no new buying interest shows up to challenge that seller, we could see pressure on “Top of Demand” and a legit correction, maybe even a broader consolidation range.
Next few days will reveal the strength of buyers.
If no aggressive buying steps in, I like the short setup, targeting “Bottom of Demand” for TP.
– Options:
Long-Term Holders:
Use 2–3% of your META share value on a Bear Put Spread or put options.
If using puts, get 2–3 weeks of time. Go as close to the money as your risk allows.
Active Traders:
This could move fast if it plays out. If you can grab a 710 Put with 3–5 days for under $1.00, hold until a big red candle (3–5%) forms.
If it keeps dragging down, roll into a new contract the following week.
⸻
Follow for more analysis and updates — and as always,
Happy Trading.
📲 @thecafetrader
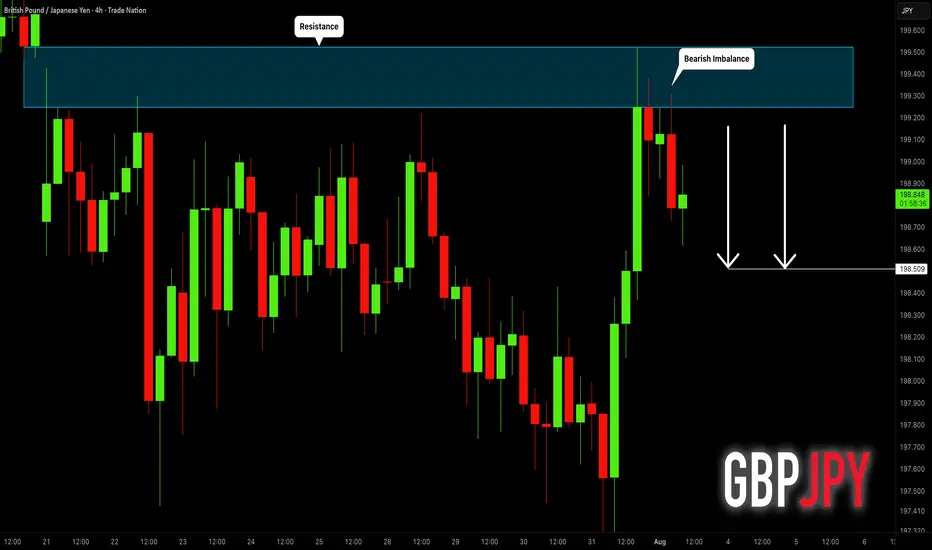
GBPJPY: Pullback From Resistance 🇬🇧🇯🇵
I think that GBPJPY will pull back from a wide
intraday supply area.
As a confirmation, I see a bearish imbalance candle that
is formed after its test.
Goal - 198.51
❤️Please, support my work with like, thank you!❤️
I am part of Trade Nation's Influencer program and receive a monthly fee for using their TradingView charts in my analysis.
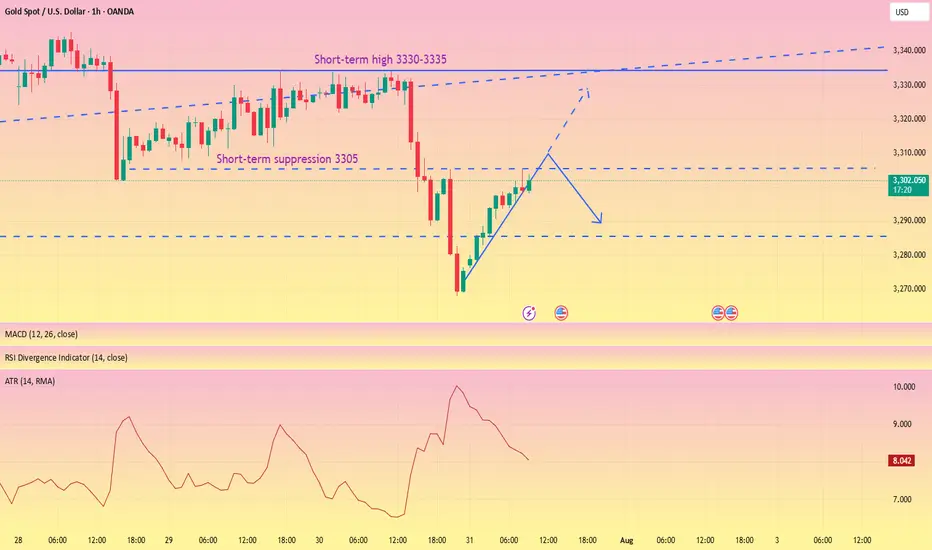
How to maintain stable operations before NFP dataYesterday, gold closed the month with a long upper shadow doji candlestick, indicating strong upward pressure, with monthly resistance at 3439-3451. Today marks the beginning of the month, and with the release of numerous data indicators such as NFP, unemployment benefits, and PMI, there is considerable uncertainty, so intraday trading should proceed with caution.
Judging from the daily chart, the current MACD indicator is dead cross with large volume, and the smart indicator is running oversold, indicating a low-level fluctuation trend during the day. At present, we need to pay attention to the SMA60 moving average and the daily middle track corresponding to 3327-3337 on the upper side, and pay attention to the intraday low around 3280 on the lower side. The lows of the previous two days at 3275-3268 cannot be ignored. There is a possibility that the low-level oscillation will touch the previous low again.
From the 4H chart, technical indicators are currently flat, with no significant short-term fluctuations expected. Low-level volatility is expected to persist within the day. Then just focus on the support near 3275 below and the middle track pressure near 3307 above. Looking at the hourly chart, gold is currently oscillating below the mid-range band, with resistance at 3295-3307 to watch in the short term.
Overall, the market is expected to remain volatile before the release of today's data. Based on Wednesday's ADP data, this round of data is also expected to be around $100,000. The contrast between ADP and NFP last time deserves our caution. The current market is basically optimistic about the short-selling situation, which is exactly what I am most worried about. If the gold price can stabilize above 3,300 before the NY data, the possibility of NFP data being bullish cannot be ruled out.
Intraday European trading suggestion: if the current gold price falls back to 3285-3280 and stabilizes, you can consider short-term long positions, with the target at 3295-3305. If the gold price tests the low of 3275-3268 again and does not break through, you can consider a second chance to go long. After making a profit of $10-20, you can consider exiting the market with profits. The market is volatile and unstable, so be sure to bring SL with you and pay close attention to the impact of the NFP data. Conservative investors can enter the market after the data is released.
The rebound is weak, short orders intervene#XAUUSD
After two consecutive trading days of volatility, gold finally began to fall under pressure near 3335. After breaking through the 3300 mark, the price of gold accelerated its decline, reaching a low of around 3268, and yesterday's daily line closed with a large negative line. 📊
Today's rebound is more likely to be based on the buffering performance of the impact of news. The ATR data also shows that the bullish momentum is slowly weakening in the short term. 🐻After digesting the impact of yesterday's news through rebound during the day, it may fall again in the future.📉
📎The primary focus today is 3305 above, which was also the high point of yesterday's pullback correction. If the gold price rebounds to 3305-3320 and encounters resistance and pressure,📉 you can consider shorting and look towards 3290-3270.🎯
If the short-term gold rebound momentum is strong and breaks through the 3305-3320 resistance area, it will be necessary to stop loss in time. Gold may be expected to touch yesterday's high resistance of 3330-3335, which is the second point to consider shorting during the day.💡
🚀 SELL 3305-3320
🚀 TP 3290-3270
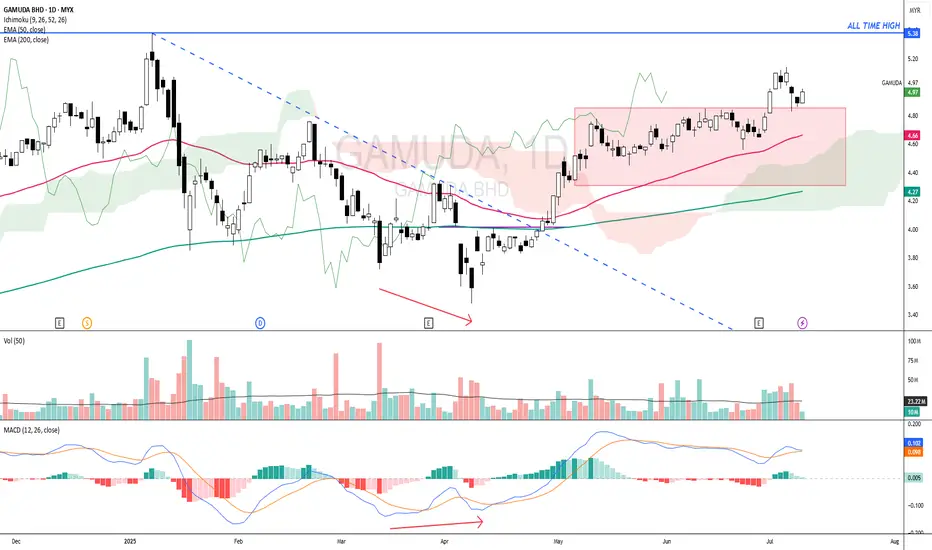
GAMUDA - Leading stock in CONSTRUCTION SECTORGAMUDA - CURRENT PRICE : RM4.97
Based on Japanese Candlestick , 30 April 2025 candle was a LONG CLOSING BOZU WHITE CANDLE . At that particular moment, it changed the trend from BEARISH to BULLISH because :
1) Price already above EMA 200 and closed on that day above EMA 50
2) Price closed into ICHIMOKU CLOUD
3) CHIKOU SPAN starts moving above CANDLESTICK
4) MACD also bullish
At current moment, after two days of selling pressure the share price turns positive today and closed higher than previous day's high. This may consider as potential buy on dips for those didn't have position yet. Supported by rising EMAs, the share price may move up to test the all time high level.
ENTRY PRICE : RM4.94 - RM4.98
TARGET : RM5.36 and RM5.57
SUPPORT : Below EMA 50 on closing basis
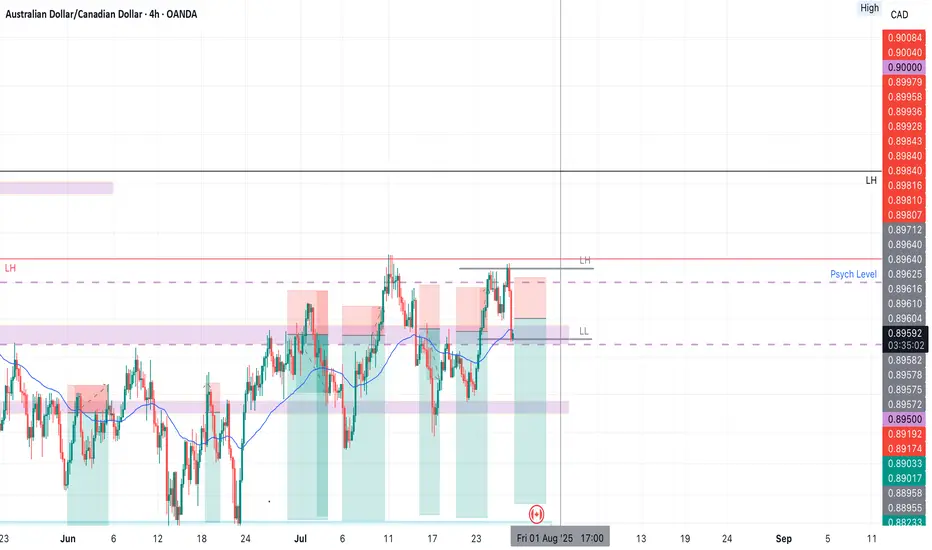
AUDCAD SHORT Market structure bearish on HTFs 3
Entry at both Daily and Weekly AOi
Weekly Rejection at AOi
Previous Weekly Structure Point
Daily Rejection at AOi
Previous Structure point Daily
Around Psych Level 0.90000
H4 EMA retest
H4 Candlestick rejection
Rejection from Previous structure
Levels 4.51
Entry 120%
REMEMBER : Trading is a Game Of Probability
: Manage Your Risk
: Be Patient
: Every Moment Is Unique
: Rinse, Wash, Repeat!
: Christ is King.
Three White Soldiers & Three Black CrowsHello, Traders! 😎
In technical analysis, not all candlestick patterns are created equal. While some merely hint at indecision or short-term corrections, others shout with conviction: "Trend reversal is coming…" Two of the most powerful momentum candlestick formations are the Three White Soldiers and the Three Black Crows. When they appear, traders PAY ATTENTION. In this article, we’ll dive deep into: What do these patterns look like? Why do they form? What do they tell us about market psychology? How to trade them?+ Their limitations 👇🏻
What Are Three White Soldiers and Three Black Crows?
These Are Multi-Candle Reversal Patterns That Suggest A Strong Shift In Market Sentiment:
Three White Soldiers. A 🐂bullish reversal pattern that occurs after a downtrend. It consists of three consecutive long-bodied green (or white) candles, each closing higher than the last, and ideally opening within the previous candle’s real body.
Three Black Crows. A 🐻bearish reversal pattern that shows up after an uptrend. It’s made of three consecutive long-bodied red (or black) candles, each closing lower than the last and opening within the previous candle’s real body. They signal not just a change in price, but a shift in power, from sellers to buyers (or vice versa).
Candles With a Message
Unlike most one-candle signals or minor patterns, these sequences tell a real story. They show that one side has taken clear control over the market — not for an hour, not for a single day, but for multiple sessions. And that kind of shift, especially on higher timeframes like daily or weekly charts, is something seasoned traders pay close attention to.
Let’s get into the psychology for a second. Imagine you’re a trader who just watched BTC drop for two weeks. Then out of nowhere, three strong green candles appear, each more bullish than the last. You’re seeing buyers push through resistance levels like they don’t even exist. That’s not just a bounce, that’s confidence. That’s the kind of thing that makes people FOMO back in, or finally close out their shorts. Same with the Black Crows. If the price has been climbing and suddenly sellers start hammering it for three days straight? That’s not retail panic. That’s big money exiting.
Now, How do Traders Trade Them?
Well, a lot of people jump in right after the third candle closes. If you’re going long on the Three White Soldiers, you’re betting that the breakout has legs. Same for shorting the Black Crows.
But, and here’s the trap, not all of these patterns play out. Sometimes, that third candle is the climax, not the beginning. So confirmation matters. Volume should increase. The move should break a recent key level. Indicators like RSI or MACD should support the shift. Otherwise, you might just be catching the end of a move, not the start of one.
Another mistake? Ignoring context. These patterns mean nothing if they’re forming in the middle of chop or during low-volume holiday trading. They work best when they signal the end of exhaustion.
And let’s be honest. Even if the pattern is clean, you still need a plan. Stops should go below the first green candle (for bullish setups) or above the first red one (for bearish setups). If price moves against you, it means momentum never really shifted. That’s your cue to get out fast.
Final Thoughts
Three White Soldiers and Three Black Crows are powerful tools in the hands of a patient trader. Of course, these patterns aren’t perfect. They don’t account for time, so a 3-day move might seem powerful, but if it happens slowly over 12-hour candles, it’s not as strong as the same pattern on a daily chart with volume.
The takeaway? These are patterns worth knowing, not because they’re magic, but because they reflect a real shift in market behavior. When Three White Soldiers or Three Black Crows show up in the right place, at the right time, with the right confirmation… that’s when charts stop being random and start making sense. But remember. They are indicators, not guarantees. The best traders use them in conjunction with other tools and a clear trading plan.

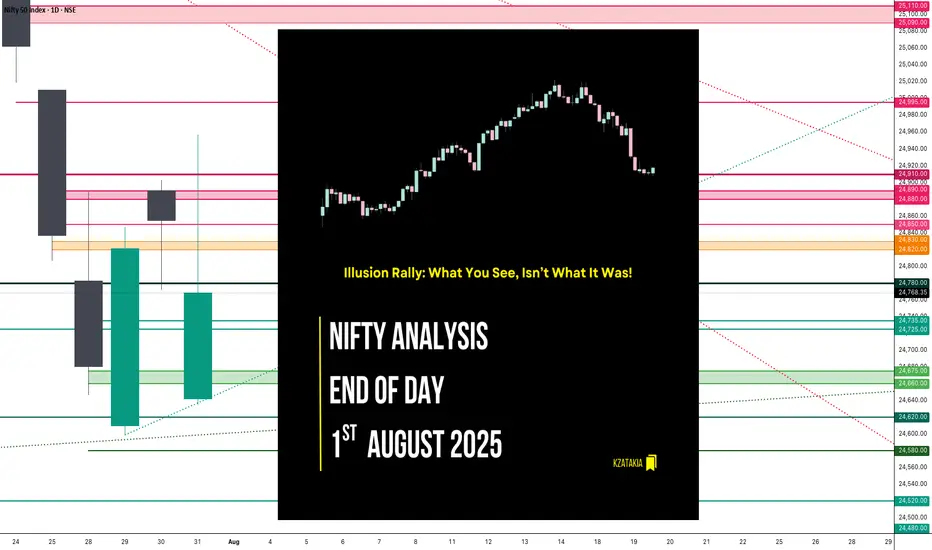
Nifty Analysis EOD – August 1, 2025 – Thursday🟢 Nifty Analysis EOD – August 1, 2025 – Thursday 🔴
🎢 Illusion Rally: What You See, Isn’t What It Was!
🧾 Nifty Summary
As we all expected, a negative gap-down opening occurred due to external news. Nifty opened 183 points lower, tested the 24,660–24,675 support zone, then rebounded sharply after a symmetrical triangle + VWAP breakout. The rally pierced through all key levels like a hot knife through butter, topping at 24,950, only to reverse with equal intensity. Closed at 24,765.
📌 Despite the technical structure, today’s move had no clear technical reasoning — more likely triggered by a mix of tariff news, confidence in Modi, weekly + monthly expiry, and manipulation.
📌 in spite of a bullish candle, strong upper rejection from 24,950 hints weakness. Candle appears bullish on colour, but bears dominated intraday close — forming a bearish Moboroshi Candle (illusion of strength).
📌 Bearish Moboroshi Candle Structure : close > open and close < Previous Close
🔍 Intraday Walk
📉 Gap down of 183 pts
🟢 Support held at 24,660–24,675
🔺 Symmetrical triangle + VWAP breakout
🚀 Sharp upmove to 24,950 zone
🔁 Reversal with same intensity
📉 Closed at 24,765 — below prior close
🖼 5 Min Time Frame Chart with Intraday Levels
📉 Daily Time Frame Chart with Intraday Levels
🕯 Daily Candle Breakdown
Open: 24,642.25
High: 24,956.50
Low: 24,635.00
Close: 24,768.35
Change: −86.70 (−0.35%)
Candle Structure:
✅ Green Candle (Close > Open) → +126.10 pts real body
⬆️ Upper Wick → 188.15 pts (Very Long)
⬇️ Lower Wick → 7.25 pts (Tiny)
Interpretation:
Opened near yesterday's low
Intraday sharp rally towards 24,950+
Faced strong selling at highs
Closed above open, but way below high — signals clear rejection
Candle Type:
📌 Bearish Moboroshi Candle — Appears bullish but hides weakness
🧠 Buyers strong initially, but sellers took control at the top
Key Insight:
Bulls need decisive close above 24,880–24,910
Else, expect drift back toward 24,660–24,675
🛡 5 Min Intraday Chart
⚔️ Gladiator Strategy Update
ATR: 208.29
IB Range: 93.95 → Medium
Market Structure: Unbalanced
Trades Triggered:
✅ 10:40 AM – Long Entry → Trailing Target Hit (R:R – 1:6.25)
📌 Trade Summary: Big R:R win today on breakout with trailing logic execution!
🧱 Support & Resistance Levels
🔺 Resistance Zones:
24,820 ~ 24,830
24,850
24,880 ~ 24,890
24,910
🔻 Support Zones:
24,780
24,725 ~ 24,715
24,660 ~ 24,650
24,620 ~ 24,600
💭 Final Thoughts
"When the move can’t be explained, the best position is caution."
Today's market behavior reinforces the idea that not all moves are technical. Keep your tools sharp, but don’t ignore contextual chaos.
✏️ Disclaimer
This is just my personal viewpoint. Always consult your financial advisor before taking any action.
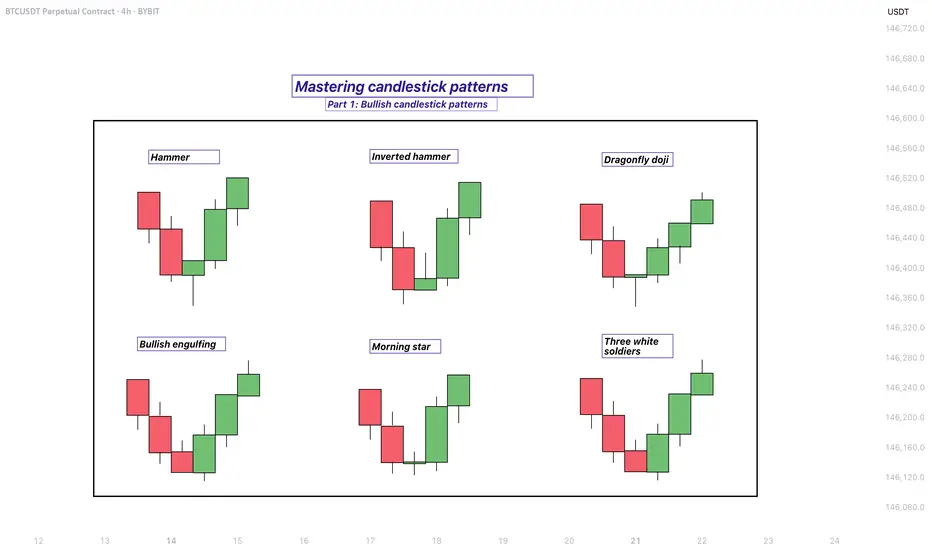
Mastering bullish candlestick patterns - How to use it!In this guide, we will explore some of the most important bullish candlestick patterns used in technical analysis. These patterns are essential tools for traders and investors who want to better understand market sentiment and identify potential reversal points where prices may start moving upward.
What will be explained:
- What are bullish candlestick patterns?
- What is the hammer?
- What is the inverted hammer?
- What is the dragonfly doji?
- What is the bullish engulfing?
- What is the morning star?
- What is the three white soldiers?
- How to use bullish candlestick patterns in trading?
What are bullish candlestick patterns?
Bullish candlestick patterns are specific formations on a candlestick chart that signal a potential reversal from a downtrend to an uptrend. These patterns are used by traders and investors to identify moments when the market sentiment may be shifting from bearish to bullish. Recognizing these patterns can help traders time their entries and make more informed decisions based on price action and market psychology. While no single pattern guarantees success, they can provide valuable clues when combined with other forms of analysis such as support and resistance, trendlines, and volume.
What is the Hammer?
The Hammer is a single-candle bullish reversal pattern that typically appears at the bottom of a downtrend. It has a small real body located at the upper end of the trading range, with a long lower shadow and little to no upper shadow. The long lower wick indicates that sellers drove the price lower during the session, but buyers stepped in strongly and pushed the price back up near the opening level by the close. This shift in momentum suggests that the downtrend could be coming to an end, and a bullish move might follow.
What is the Inverted Hammer?
The Inverted Hammer is another single-candle bullish pattern that also appears after a downtrend. It has a small body near the lower end of the candle, a long upper shadow, and little to no lower shadow. This pattern shows that buyers attempted to push the price higher, but sellers managed to bring it back down before the close. Despite the failure to hold higher levels, the buying pressure indicates a possible reversal in momentum. Traders usually look for confirmation in the next candle, such as a strong bullish candle, before acting on the signal.
What is the Dragonfly Doji?
The Dragonfly Doji is a special type of candlestick that often indicates a potential bullish reversal when it appears at the bottom of a downtrend. It forms when the open, high, and close prices are all roughly the same, and there is a long lower shadow. This pattern shows that sellers dominated early in the session, pushing prices significantly lower, but buyers regained control and drove the price back up by the end of the session. The strong recovery within a single period suggests that the selling pressure may be exhausted and a bullish reversal could be imminent.
What is the Bullish Engulfing?
The Bullish Engulfing pattern consists of two candles and is a strong indication of a reversal. The first candle is bearish, and the second is a larger bullish candle that completely engulfs the body of the first one. This pattern appears after a downtrend and reflects a shift in control from sellers to buyers. The bullish candle’s large body shows strong buying interest that overpowers the previous session’s selling. A Bullish Engulfing pattern is even more significant if it occurs near a key support level, and it often signals the beginning of a potential upward move.
What is the Morning Star?
The Morning Star is a three-candle bullish reversal pattern that occurs after a downtrend. The first candle is a long bearish one, followed by a small-bodied candle (which can be bullish, bearish, or a doji), indicating indecision in the market. The third candle is a strong bullish candle that closes well into the body of the first candle. This formation shows a transition from selling pressure to buying interest. The Morning Star is a reliable signal of a shift in momentum, especially when confirmed by high volume or a breakout from a resistance level.
What is the Three White Soldiers?
The Three White Soldiers pattern is a powerful bullish reversal signal made up of three consecutive long-bodied bullish candles. Each candle opens within the previous candle’s real body and closes near or at its high, showing consistent buying pressure. This pattern often appears after a prolonged downtrend or a period of consolidation and reflects strong and sustained buying interest. The Three White Soldiers suggest that buyers are firmly in control, and the market may continue moving upward in the near term.
How to use bullish candlestick patterns in trading?
To effectively use bullish candlestick patterns in trading, it’s important not to rely on them in isolation. While these patterns can signal potential reversals, they work best when combined with other technical tools such as support and resistance levels, moving averages, trendlines, and volume analysis. Traders should also wait for confirmation after the pattern forms, such as a strong follow-through candle or a break above a resistance level, before entering a trade. Risk management is crucial—always use stop-loss orders to protect against false signals, and consider the broader market trend to increase the probability of success. By integrating candlestick analysis into a comprehensive trading strategy, traders can improve their timing and increase their chances of making profitable decisions.
Thanks for your support. If you enjoyed this analysis, make sure to follow me so you don't miss the next one. And if you found it helpful, feel free to drop a like 👍 and leave a comment 💬, I’d love to hear your thoughts!
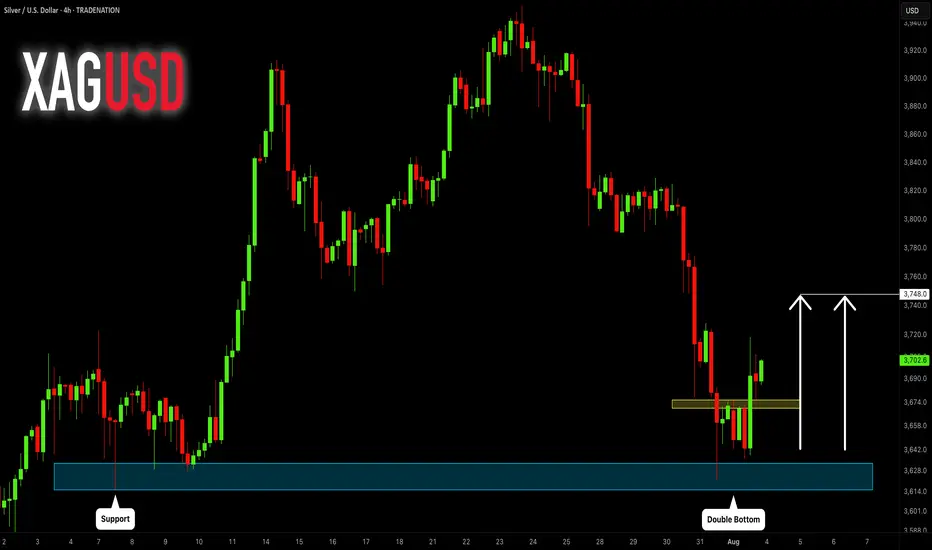
SILVER (XAGUSD): More Growth Ahead
It looks like Silver is going to continue growing next week,
following a strong bullish reaction to a key daily horizontal support.
The next strong resistance is 3748.
It will be the next goal for the buyers.
❤️Please, support my work with like, thank you!❤️
I am part of Trade Nation's Influencer program and receive a monthly fee for using their TradingView charts in my analysis.
ETH Critical Next Few Days.Hello I am the Cafe Trader.
Today we are taking a close look at Ethereum.
After the Tariff news and the Jobs report, The market as a whole seems very bearish suddenly to many. Even though we do have aggressive sellers in the short term, The market is still bullish in the mid to long term. Let's take a look.
Sentiment has changed
A major catalyst (like the Tariffs news) can cause a change of terrain. Buyers may become more bashful, taking their foot off the gas (where the put it before). Reactions to kry levels (like "top of demand") will give us clues into how strong are they still.
Short Term
ETH had a huge rally, Whats does a healthy rally need for a continuation?
Consolidation
This brings us to the charts
Top of demand gives us evidence of how convicted these current buyers still are in a market. A hot reaction = Aggressive Demand. Cold Reaction = Hesitant or lack of Demand.
Todays close was a touch cold, but considering the recent bearish news and data, not terrible. Buyers are still active in this area, but since the terrain might have changed, I have given you two scenarios.
Green Scenario
For this to play out, we need to see buyers step in immediately. The longer ETH stays in this demand, the heavier they will become (and it's a long way down)
Wait for a second test minimum. Best to get a hot reaction. If it presses into the demand zone, Cut it early. (always good to wait for a close)
Entry 3,518
Stop 3,360
TP 1 3,990
TP 2 Breakout? Trailing stop?
Red Scenario
If we can't close above top of demand (Like tomorrow...) This is the likely scenario. I would be hard pressed to try and catch a knife this overextended. So until we identify where the new sellers are sitting, I can't give you any trades on this scenario. If you are short biased this could run all the way down to the bottom of demand.
I'll keep a close eye this over the weekend and keep updates.
Long Term
These prices should be according to your personal sentiment on ETH.
Aggressive = 3,500
Good price = on the trend roughly 2,900 - 3k
STEAL = 2,200 - 2,400
That's all for ETH! Enjoy your weekend, and Happy Trading!
@thecafetrader