Today's summary and tomorrow's market forecast📰 News information:
1. Focus on tomorrow's CPI data
2. Bowman's speech at the Federal Reserve
3. Tariff information outflows and countries' responses to tariff issues
📈 Technical Analysis:
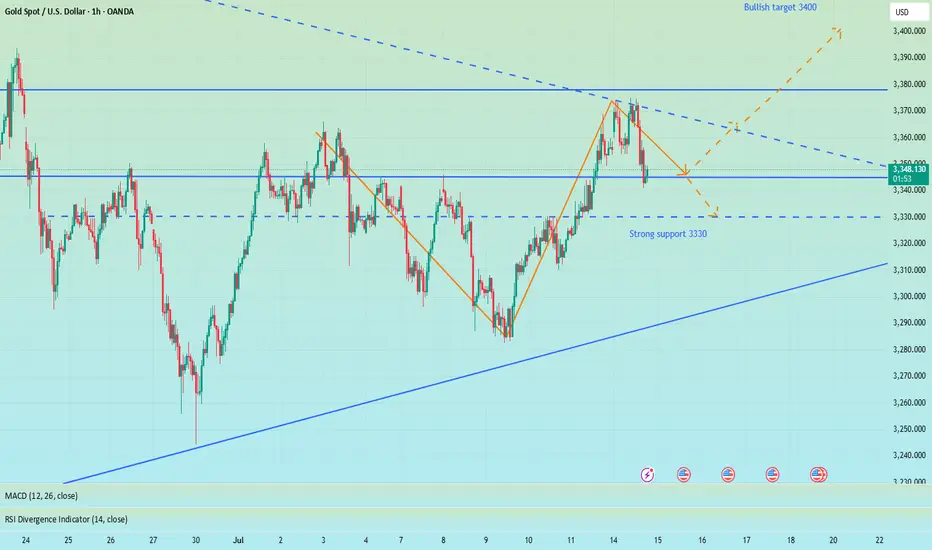
Bros, I had some things to deal with just now so I went out for a while. Now I come back to share my ideas. When the market is blindly chasing longs, I chose to give a bearish trading opportunity. I know that after I proposed the idea of shorting to test the support level of 3340-3330 below, many people were skeptical and even looked at it with a sarcastic attitude. After all, most people in the market are long. But facts and results have proved that only by following the trend can there be better room for operation. When doing transactions, you must first have a clear goal. Those who follow the crowd will often only blame their mistakes on others or luck.
Regarding the arrangements for future trading, first of all, 3375-3385 above is still an important short-term resistance. If today's closing is above 3360, then 3375 will most likely be tested again during the Asia-Europe trading session. Once it goes up again, it is very likely to break through the resistance area of 3375-3385. Before the US data, the price may stay at 3390 or 3400. On the contrary, if today's closing is below 3360, then the price still has room for adjustment. In this way, 3340 will not be the low point of this week. The bearish volatility in the Asian and European sessions will also test the strong support of 3330-3320.
In addition to investment, life also includes poetry, distant places, and Allen. Facing the market is actually facing yourself, correcting your shortcomings, facing your mistakes, and exercising strict self-discipline. I share free trading strategies and analysis ideas every day for reference by brothers. I hope my analysis can help you.
OANDA:XAUUSD PEPPERSTONE:XAUUSD FOREXCOM:XAUUSD FX:XAUUSD TVC:GOLD FXOPEN:XAUUSD
Candlestick Analysis
AUD/USD: Bearish Pattern Hints at Downside MoveAUD/USD has struggled on pushes towards .6600 recently, including on Monday where a bearish reversal completed a three-candle evening star pattern—a notable topping pattern. While price signals ahead of major U.S. economic data during the Northern Hemisphere summer should be treated with extra caution, in an environment where trade uncertainty and geopolitical tensions are unlikely to be resolved in the near term, a short setup may be in order.
Should AUD/USD push back towards minor resistance at .6558 without breaking above, shorts could be established beneath the level with a stop above for protection. .6490 screens as a logical initial target, aligning with the 50-day moving average with the July 7 low located just below.
Some may look to enter around current levels, but given the caveats on the price signal, the preference is to let the setup come to you rather than forcing it.
Good luck!
DS

GBPUSD ANALYSIS After seeing the previous day close bearish we can expect the market to continue in to support area of 133.750 but a slight retracement could be in play before further push down

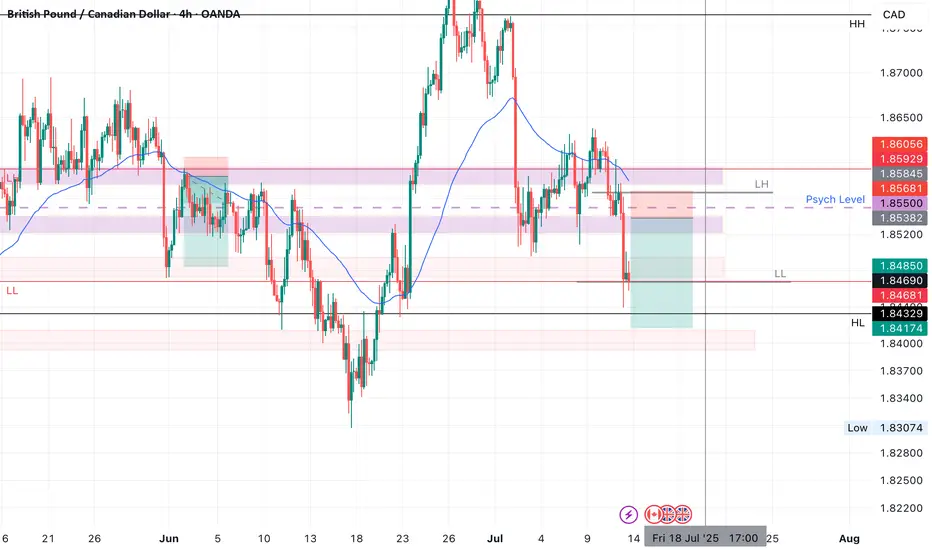
GBPCAD SHORTMarket structure bearish on HTFs DH
Entry at both Weekly and Daily AOi
Weekly Rejection at AOi
Daily Rejection at AOi
Daily EMA retest
Previous Structure point Daily
Around Psychological Level 1.85500
H4 Candlestick rejection
Rejection from Previous structure
Levels 4.04
Entry 100%
REMEMBER : Trading is a Game Of Probability
: Manage Your Risk
: Be Patient
: Every Moment Is Unique
: Rinse, Wash, Repeat!
: Christ is King.
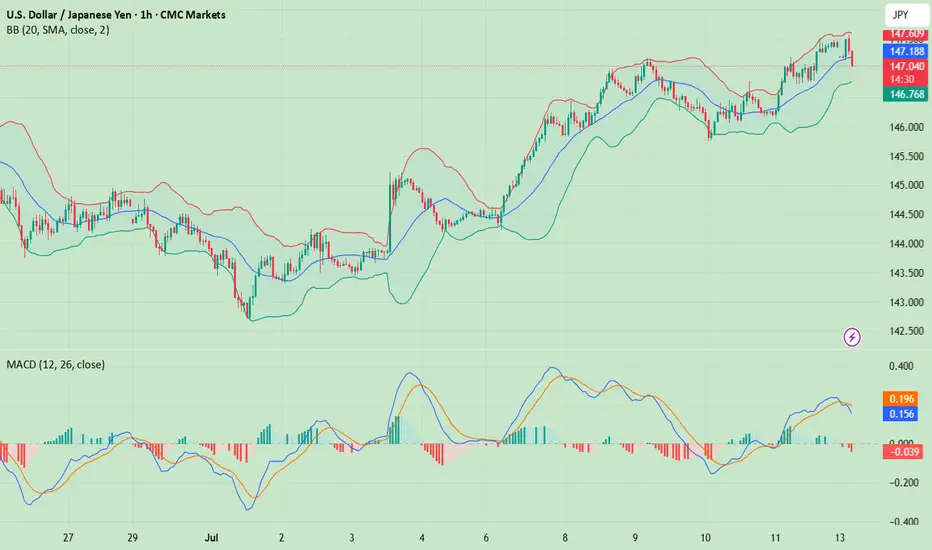
USD/JPY(20250714)Today's AnalysisMarket news:
① Fed's Goolsbee: The latest tariff threat may delay rate cuts. ② The Fed responded to the White House's "accusations": The increase in building renovation costs partly reflects unforeseen construction conditions. ③ "Fed's megaphone": The dispute over building renovations has challenged the Fed's independence again, and it is expected that no rate cuts will be made this month. ④ Hassett: Whether Trump fires Powell or not, the Fed's answer to the headquarters renovation is the key.
Technical analysis:
Today's buying and selling boundaries:
147.02
Support and resistance levels:
148.39
147.88
147.55
146.49
146.15
145.64
Trading strategy:
If the price breaks through 147.55, consider buying, and the first target price is 147.88
If the price breaks through 147.02, consider selling, and the first target price is 146.49
Mid-Session Market InsightsMid-Session Market Insights
In today's session, I'm closely monitoring eight different futures markets: S&P 500, NASDAQ 100, Russell 2000, Gold, Crude Oil, Euro Dollar, Yen Dollar, and Aussie Dollar.
S&P 500: We're seeing a rotational pattern within the prior day's value area and the CVA. I'm eyeing long opportunities from the prior value area low up to the high.
NASDAQ 100: The market is a bit choppy around the PVA and CVA highs, with a slight upward intraday trend. I'm staying cautious here.
Russell 2000: Also choppy, but we've got acceptance within the CVA. I'm looking for long opportunities from the CVA low, which aligns with the prior day's low.
Euro Dollar: I'm currently short from the CVA high, with the first target at the prior day's low. We've broken below the prior value area, so I'll trail this trade and see how it develops.
Yen Dollar: It’s been a bit of a mixed bag. I took a short below the CVA and prior day's low, got stopped out, but it was still a decent setup.
Aussie Dollar: I took some long positions that weren't the best setups, as it was quite choppy near the CVA high and prior day's low. Lesson learned for next time.
Crude Oil: I took a short from the CVA and PVA highs, hit my target at the low of those areas, and we’re currently hovering around that level.

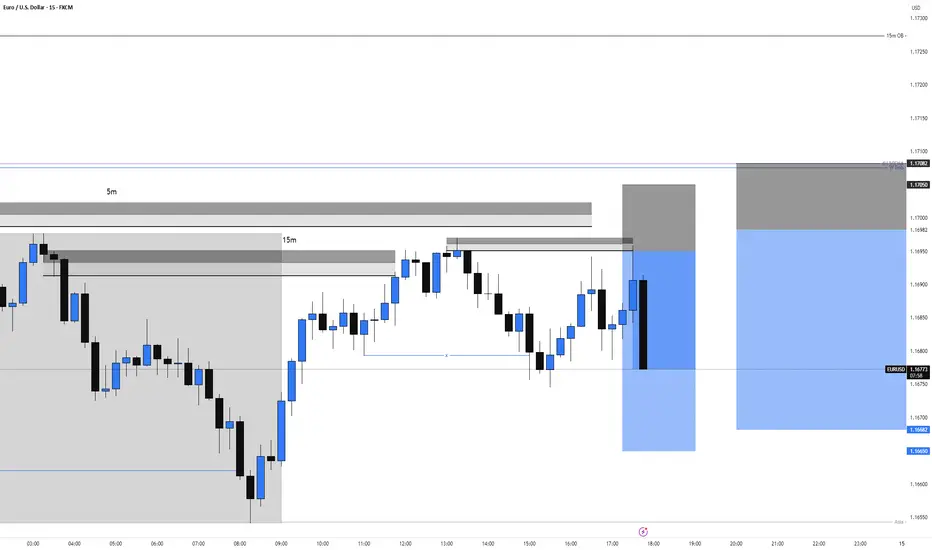
EURUSD Short re entry, 14 JulyHTF Downtrend with Clean LTF Setup
Bias remains bearish with HTF downtrend, W imbalance resting above, and 4H 50EMA close to our zone.
📉 Confluence:
Textbook LTF structure, expecting LH → LL
DXY reacting from 15m POI + Asia low to fill
15m Extreme OB + 5m OB as entry zone
Clean 1m BOS confirming sellers stepping in → add another 50%
🎯 Entry: 50% tap of 5m OB after 1m BOS
🛡️ SL: Above LH structure
📌 TP: At least 1:3 RR down to Asia low
⚠️ Minor risk with W imbalance above, but strong trend and confirmations to support the trade.
3 hours ago
Trade active
We got an 1mBOS from the 15m POI
Got 2 entry points now : The one from the 5m OB marked out on the photo and one at the lower 5m that created the break. Will see what happens
High sell probability on Gold!!! Don’t sleep on it!XAUUSD (Gold) previous bullish momentum that was currently developing slowed down in the early hours of New York trading session today around the resistance level of 3357.80 I sense a big correction coming on Gold especially as higher timeframe (monthly) is already showing multiple candlestick exhaustion which signals profit taking activities after a prolonged bullish trend that has been developing since the major breakout around the $2,000 level. A sell opportunity is Envisaged once our entry criteria is met.
Expect a significant drop in price!

Nifty Analysis EOD – July 14, 2025 – Monday🟢 Nifty Analysis EOD – July 14, 2025 – Monday 🔴
"Broken Support, Fought Resistance – Tug of War in Play"
Nifty began the day with a classic Open = High (OH) setup, instantly rejecting any bullish intent. The crucial support zone of 25,080–25,060 was taken out early, and the market went on to mark the day's low at 25,001.95, a level that quickly turned into a decisive battleground.
After a bounce from the low, 25,125 emerged as a stiff resistance that pushed the index back below the broken support zone. For most of the session, the same support zone turned into resistance — a textbook polarity flip. However, in the final hour, Nifty showed resilience and finally closed back above 25,080, ending the session at 25,082.30.
🔄 The structure was full of failed intraday breakouts, signaling confusion and conflict — likely fueled by a wider CPR, imbalanced market structure, and medium IB of 109 pts. It was a low-volatility session, but packed with psychological tests.
🕯 5 Min Time Frame Chart with Intraday Levels
🕯 Daily Time Frame Chart with Intraday Levels
🕯 Daily Candle Breakdown
Open: 25,149.50
High: 25,151.10
Low: 25,001.95
Close: 25,082.30
Change: −67.55 (−0.27%)
📊 Candle Structure Breakdown
Real Body: 67.20 points – small to moderate bearish body
Upper Wick: 1.60 points – negligible upside attempt
Lower Wick: 80.35 points – strong defense from day’s low
🔍 Interpretation
Opened higher but got instantly rejected (OH formation).
Sellers took charge early but failed to hold momentum all the way.
The long lower wick reflects buyer presence at key 25,000 zone.
The close below open but above reclaimed support suggests tug of war — with bulls slightly redeeming themselves by EOD.
🕯 Candle Type
Hammer-like red candle — while bearish on close, the long lower shadow indicates potential exhaustion of selling and hints at reversal if follow-through buying emerges next session.
📌 Key Insight
25,000–25,020 has emerged as crucial near-term support.
A strong open or close above 25,150–25,180 may confirm a bullish reversal setup.
Breakdown below 25,000 opens the door for a fall toward 24,950 or lower.
🛡 5 Min Intraday Chart
⚔️ Gladiator Strategy Update
ATR: 188.77
IB Range: 109.20 → Medium IB
Market Structure: 🔴 Imbalanced
Trades Triggered
09:50 AM – Long Trade → ❌ SL Hit
01:05 PM – Short Trade → ❌ SL Hit
📉 Tough day for directional trades — false breakouts dominated.
📌 Support & Resistance Zones
Resistance Levels
25,125
25,168
25,180 ~ 25,212
25,260
25,295 ~ 25,315
Support Levels
25,080 ~ 25,060
25,000 ~ 24,980
24,965
💭 Final Thoughts
“Reclaimed ground doesn’t mean victory – yet. Watch the next move. Rejection below 25,000 ends the bulls' narrative; a strong move above 25,180 rewrites it.”
✏️ Disclaimer
This is just my personal viewpoint. Always consult your financial advisor before taking any action.

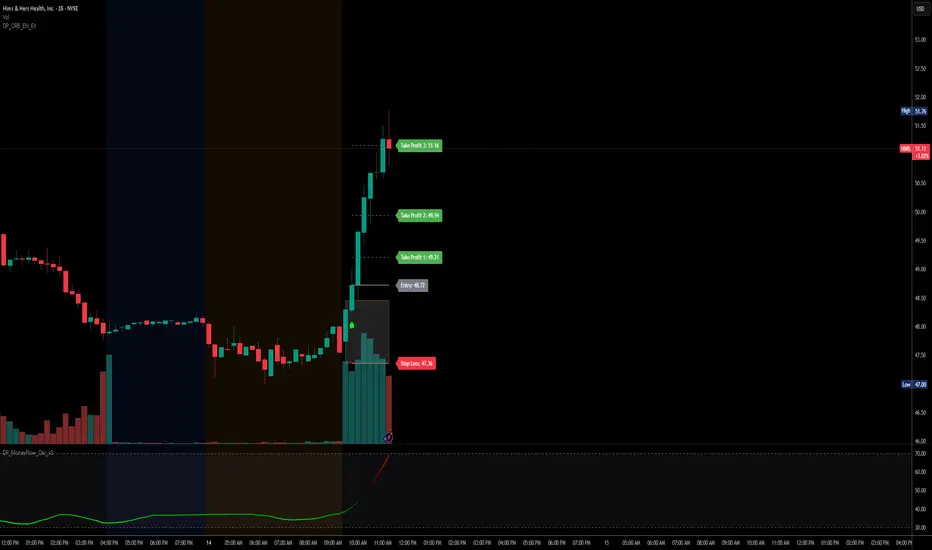
$HIMS - ORBCLEAN breakout for NYSE:HIMS today.
DP_ORB Indicator marked it at candle close outside of ORB Zone, with confirmation bias from a higher high, and volume. All take profits were hit!
If you want the DP_ORB Indicator for FREE:
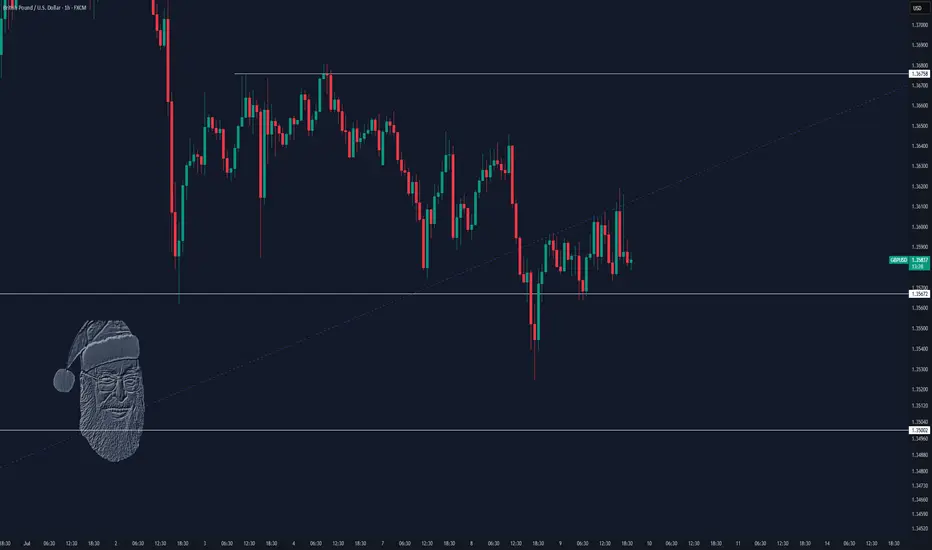
Skeptic | GBP/USD Update: Triggers Fired Up!Hey everyone, it’s Skeptic! ;) yesterday, the support at 1.35672 saw a fake breakout and snapped back into the 4-hour box we’ve been tracking. But bearish momentum is still strong, so here’s the play:
✔️ If you opened a short already , With the fake breakout signaling potential momentum shift, consider taking profits or closing if price consolidates above 1.36089. Why? The fakeout increases the chance of a momentum change.
✨ For new short positions , the 1.35672 break remains a valid trigger. If it breaks again, it could kickstart a major bearish leg, targeting lower supports at 1.35000 and 1.34227 —both strong reaction zones.
📊 The HWC is uptrend, so shorts need extra caution—reduce risk or take profits early.
📉 For longs , wait for a break and consolidation above 1.36406 . This level saw a strong rejection, signaling it’s a key resistance the market respects. A break here, liquidating short positions (which means buying), could spark a solid uptrend leg with great R/R potential.
🔔 Confirmation : Use RSI entering oversold for shorts or overbought for longs. The HWC uptrend means shorts carry higher risk, so tighten your risk management—stick to 1%–2% risk per trade.
🔼 Key Takeaway: Short at 1.35672 if it breaks again, long at 1.36406 with confirmation. Stay sharp for momentum shifts and keep stops tight. I’ll update if the market structure flips!
💬 Let’s Talk!
Which GBP/USD trigger are you locked on? Hit the comments, and let’s crush it together! 😊 If this update lit your fire, smash that boost—it fuels my mission! :)))
Gold Bulls Are Back – Eyes on 3450 GOLD – Bulls Regain Control After Defending 3280
🟡 Last week was a dynamic one for Gold traders.
The week began with signs of an upside reversal, followed by a drop to test the 3280 support. That dip held—and from there, we saw a strong push higher, ending the week right at the top of the range.
📌 Friday’s close left behind a continuation Pin Bar on the weekly chart – a strong signal in favor of the bulls.
- This week started with a new local high at 3375,but we’re now seeing a pullback in the 3355 area at the time of writing.
What’s next?
Given last week’s price action, bulls seem to have won the battle and appear ready to challenge the 3400 level.
My plan for this week:
I’m looking to buy dips, and as long as nothing changes, my target is the 3450 zone.
Disclosure: I am part of TradeNation's Influencer program and receive a monthly fee for using their TradingView charts in my analyses and educational articles.

Big Week for Markets: U.S. CPI Tomorrow – What It Means for GoldThis week is packed with news, but the main focus is the U.S. CPI report dropping tomorrow.
🗓 Key Event: U.S. CPI Report
📍 July 15, 2025 | 12:30 p.m. UTC
The CPI report measures inflation and heavily influences the Fed’s rate decisions. Last month’s CPI came in at 2.4% vs. 2.5% expected, following 2.3% vs. 2.4% in April. While it seems inflation is rising, the bigger picture shows stable annual inflation in the 2.3%–3.0% range, keeping things under control—likely the reason Trump is pressuring Powell to cut rates.
Market expects June CPI to be 2.7%.
🤔 Possible Scenarios:
1️⃣ CPI > 2.7%: Bullish for DXY 📈. The stronger the print, the bigger the spike, but I see this scenario as less probable.
2️⃣ CPI < 2.7%: Bearish for DXY 📉. We may see a USD dump, though likely shallow since CPI could still be higher than previous months.
✨ What About Gold?
I don’t expect a major reaction in gold:
✅ Higher CPI? Gold often benefits as an inflation hedge.
✅ Lower CPI? Also supportive for gold as it weighs on the USD.
🔍 Technical Outlook:
Gold has been trading within a triangle since April 22, forming lower highs and higher lows. We may currently be in Wave D (Elliott Wave), aiming toward the triangle’s upper boundary slightly above $3,400 resistance. After that, Wave E may develop – but that’s a story for another post.

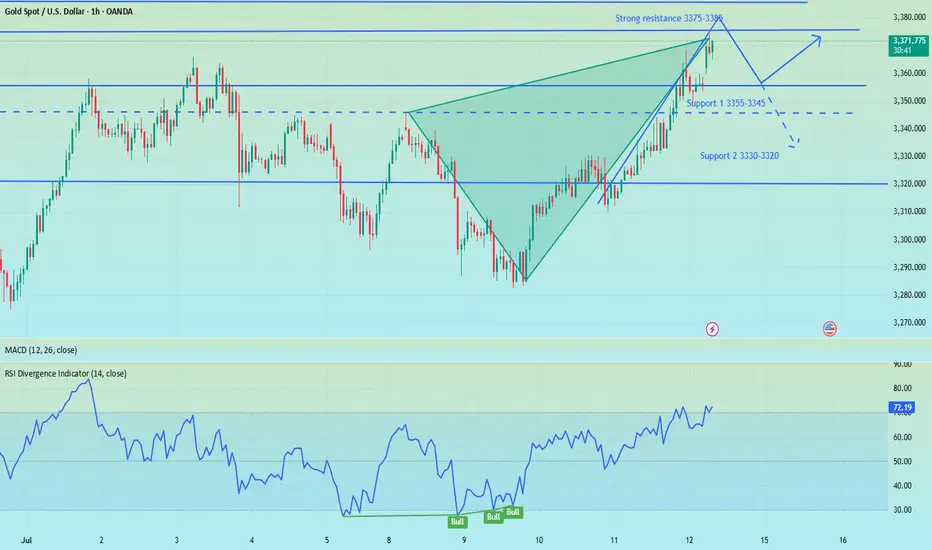
Gold still has room to pull back, be brave and short gold!Gold continued to rebound today, and we also successfully gained 150pips profit in long gold trading. However, although gold is currently maintaining its upward trend, the rebound strength of gold is not strong during the European session, and it has repeatedly touched 3375 and then fell back, proving that there is still some resistance above. In my previous trading point of view, I also emphasized that gold is under pressure near 3380 in the short term. In addition, from a technical perspective, today's intraday high is limited to 3395.
So in order to dump the bullish momentum so that it can break through 3380 more smoothly, or even continue to above 3340, gold will inevitably have a retracement in the short term. So when most people in the market are still waiting for a retracement to go long on gold, I will definitely not waste the opportunity of gold retracement in vain.
So for short-term trading, I will consider shorting gold appropriately in the 3375-3395 area, with the target looking at 3360-3350. After gold falls back as expected, we might as well consider going long on gold at a low level.

Gold fluctuates downward, go long again when it falls back
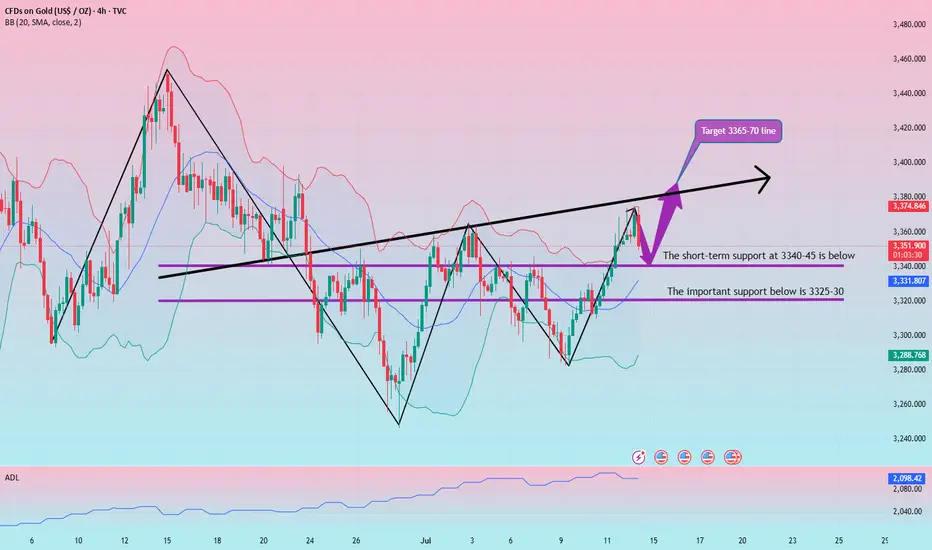
Gold is currently fluctuating downward. Although the trend is bullish, we must not rush into the market. The technical side needs to step back. We need to be cautious when going long. We need to grasp the entry position and step back to 3340-45 and then more!
From the 4-hour analysis, the short-term support below focuses on the neckline of the hourly line of last Friday, 3340-45, and the focus is on the support of 3325-30. The intraday step back continues to follow the trend and the main bullish trend remains unchanged. The short-term bullish strong dividing line focuses on the 3325 mark. The daily level stabilizes above this position and continues to follow the trend and bullish rhythm. Before falling below this position, continue to follow the trend and follow the trend. The main tone of participation. I will remind you of the specific operation strategy in the VIP group, and pay attention to it in time.
Gold operation strategy:
Gold goes long at the 3340-45 line when it steps back, and covers long positions at the 3325-30 line when it steps back, stop loss 3317, target 3365-70
The market is bullish, but I am bearish. Don't regret it.📰 News information:
1. Focus on tomorrow's CPI data
2. Bowman's speech at the Federal Reserve
3. Tariff information outflows and countries' responses to tariff issues
📈 Technical Analysis:
This week, the US CPI data, consumer index, tariff issues and geopolitical situation are all key points to pay attention to. In the morning, both our long and short positions had good gains, making a good start to the week. The best way is to follow the trend and grab limited profits!
In the 4H cycle, the current trend shows a Zhendan upward pattern, and bulls still occupy the dominant low position in the short term. At the daily level, three consecutive positive days at the end of last week broke through the middle track, and the high point broke through the previous high, indicating that the short-term adjustment is over, and the rise in the market to test 3400 will be a high probability event. At present, the MACD daily line is bullish, the Bollinger Bands are flat, and the gold price is above the middle track. The bulls are strong, but there is still a need for a correction. Intraday trading focuses on the strength of the European session. If the European session is strong, the US session will continue to rise, and if the European session is weak, the US session will bottom out again. In the short term, if it touches 3370-3375 again, you can consider shorting and look towards 3365-3355 SL 3380.
🎯 Trading Points:
sell 3370-3375
tp 3365-3355-3345
In addition to investment, life also includes poetry, distant places, and Allen. Facing the market is actually facing yourself, correcting your shortcomings, facing your mistakes, and exercising strict self-discipline. I share free trading strategies and analysis ideas every day for reference by brothers. I hope my analysis can help you.
FXOPEN:XAUUSD TVC:GOLD FX:XAUUSD FOREXCOM:XAUUSD PEPPERSTONE:XAUUSD OANDA:XAUUSD
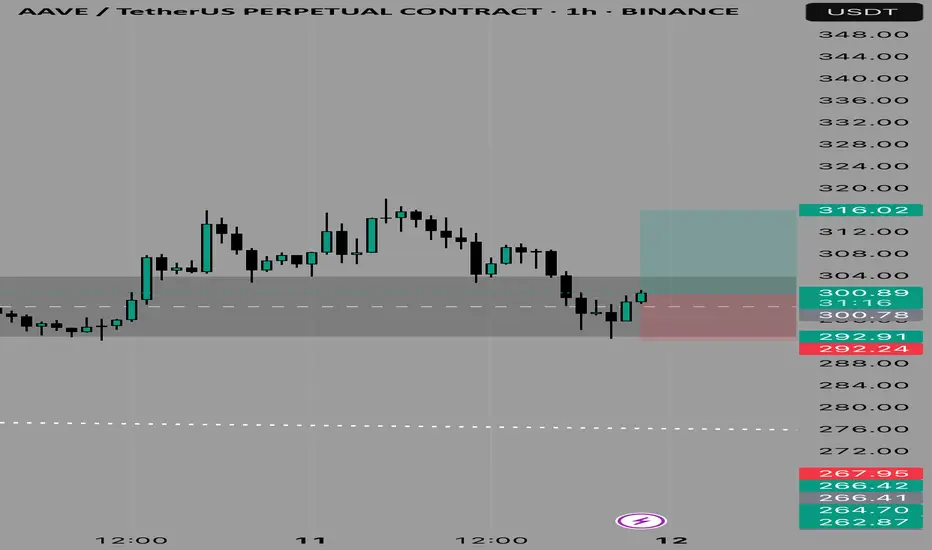
AAVE IDEA JUL11-25So here is a quick one
Let’s see how this OB works in seach of short-term liquidity 💪

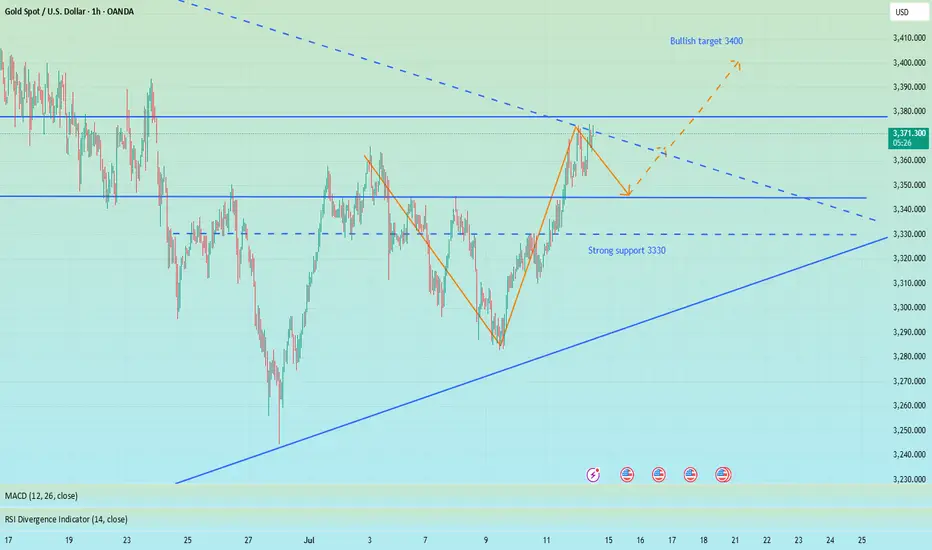
Beware of the market's trap of luring more investors, short 3335Regarding recent trading strategies, I believe you have also seen my trading win rate. I often inform the future trend of gold several hours or even days in advance, because my many years of trading experience have made me an excellent poisonous wolf in the trading market. Now I see a lot of bullish voices in the market, but my wolf’s sense of smell has discovered danger signals. In the short term, I think that without the influence of news, the market needs to digest the overbought momentum of the bulls. From the 4H chart, the middle track of the Bollinger Band is at 3332, which is very close to the strong support of 3330 given by us during the day. Therefore, I think that at least within 4 hours, gold will fall back to test the support below 3340-3330, or even 3320. Since most people want to follow the crowd, let them go. They will only fall into the trap set by the market. Let's prove with facts whether following the wolf pack will make you hungry or well fed.
OANDA:XAUUSD

Capital Flow Outlook – BTC Leads, Alts Await a SignalOver the past two quarters, Tether's (USDT) market cap has expanded by over 66%, rising from ~$95B in late 2024 to ~$159.5B by mid-July 2025. This confirms a strong capital injection into the crypto space — reminiscent of early bull market cycles.
But where that capital flows tells the deeper story:
USDT.D is in a clean downtrend, showing that capital is actively rotating out of stables — a risk-on signal.
BTC.D continues climbing, confirming Bitcoin as the primary recipient of inflows. While the current move hasn’t reached exhaustion, the nearest potential reversal point is the weekly volume imbalance at ~67.5%.
Should that level fail to trigger a reaction, the next major reversal zone lies near 73% — the last known macro ceiling for dominance.
ETH.D has shown a structural shift, bouncing from a key macro low with a clear Change in State of Delivery (CSD). A revisit to the April high around 8.55% is looking increasingly likely.
SOL.D is fighting for structure, having reacted to a mid-point imbalance situated in the discount zone. This positioning is favorable for buyers, but structurally it still leans toward sweeping the April low at 2.13% before a valid CSD can form.
---
🧠 Conclusion:
While capital is clearly flowing back into the market, Bitcoin remains the primary destination. Until we see:
A reaction or rejection at BTC.D reversal zones
ETH.D continuing upward toward prior range highs
And SOL.D confirming a structural shift from discount
...a full altseason expansion remains premature.
> The capital is here — but the rotation isn’t.
Altseason is still brewing — and could take the rest of the year to fully materialize.
— Silent Edge

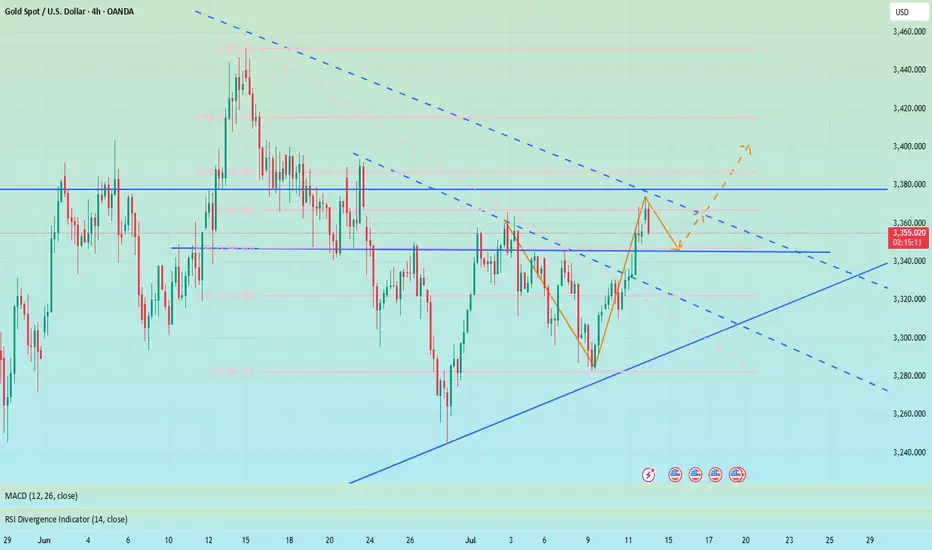
Gold gaps up and open higher,beware of going long at high levelsBros, the Asian session opened higher in the morning. Currently, gold is falling back to the SMA1O moving average. We will continue to be bullish after it falls back and stabilizes. At present, it has broken through the key resistance level of 3360. The daily line has shown a strong pattern of three consecutive positives. The gold price remains in the rising channel, and the bullish trend is obvious. As the gold price moves up, the short-term moving average moves up with it. At present, 3355-3345 constitutes an important support in the short term, and 3375-3385 above constitutes a short-term resistance area. Whether it can stand firmly above 3360 this week is the key.
Severe overbought in the short term, there are trading risks for long positions at high levels. Short-term operation suggestions for the Asian and European sessions: consider shorting when it touches 3365-3375, and stop loss when it breaks 3375. The target focuses on 3355-3345, and the breakout looks at 3330-3320. On the contrary, if it stabilizes at 3355-3345, you can consider going long.
Short position profit, focus on 3355-3345 support📰 News information:
1. Focus on tomorrow's CPI data
2. Bowman's speech at the Federal Reserve
3. Tariff information outflows and countries' responses to tariff issues
📈 Technical Analysis:
The short-term bears have successfully hit the TP to realize profits, and the trading strategy is still valid. Continue to pay attention to the 3355-3345 support during the day. If effective support is obtained here, you can consider going long. For the rebound, the first TP can focus on the 3365 line. If the gold price breaks through 3380 in the future, it will not be far from 3400. If it falls below, pay attention to the support of 3330-3320 below. It is expected that this is the limit position of short-term bearishness. The impact of tariffs is still there, and the bullish trend remains optimistic in the short term, unless Europe, Japan and other countries have a new solution to tariffs.
🎯 Trading Points:
BUY 3355-3345
TP 3365-3380-3400
In addition to investment, life also includes poetry, distant places, and Allen. Facing the market is actually facing yourself, correcting your shortcomings, facing your mistakes, and exercising strict self-discipline. I share free trading strategies and analysis ideas every day for reference by brothers. I hope my analysis can help you.
OANDA:XAUUSD PEPPERSTONE:XAUUSD FOREXCOM:XAUUSD FX:XAUUSD TVC:GOLD FXOPEN:XAUUSD
XAU/USD 14 July 2025 Intraday AnalysisH4 Analysis:
-> Swing: Bullish.
-> Internal: Bullish.
You will note that price has targeted weak internal high on two separate occasions forming a double top which is a bearish reversal pattern. This is in-line with HTF bearish pullback phase.
Remainder of analysis and bias remains the same as analysis dated 23 April 2025.
Price has now printed a bearish CHoCH according to my analysis yesterday.
Price is now trading within an established internal range.
Intraday Expectation:
Price to trade down to either discount of internal 50% EQ, or H4 demand zone before targeting weak internal high priced at 3,500.200.
Note:
The Federal Reserve’s sustained dovish stance, coupled with ongoing geopolitical uncertainties, is likely to prolong heightened volatility in the gold market. Given this elevated risk environment, traders should exercise caution and recalibrate risk management strategies to navigate potential price fluctuations effectively.
Additionally, gold pricing remains sensitive to broader macroeconomic developments, including policy decisions under President Trump. Shifts in geopolitical strategy and economic directives could further amplify uncertainty, contributing to market repricing dynamics.
H4 Chart:
M15 Analysis:
-> Swing: Bullish.
-> Internal: Bullish.
H4 Timeframe - Price has failed to target weak internal high, therefore, it would not be unrealistic if price printed a bearish iBOS.
The remainder of my analysis shall remain the same as analysis dated 13 June 2025, apart from target price.
As per my analysis dated 22 May 2025 whereby I mentioned price can be seen to be reacting at discount of 50% EQ on H4 timeframe, therefore, it is a viable alternative that price could potentially print a bullish iBOS on M15 timeframe despite internal structure being bearish.
Price has printed a bullish iBOS followed by a bearish CHoCH, which indicates, but does not confirm, bearish pullback phase initiation. I will however continue to monitor, with respect to depth of pullback.
Intraday Expectation:
Price to continue bearish, react at either M15 supply zone, or discount of 50% internal EQ before targeting weak internal high priced at 3,451.375.
Note:
Gold remains highly volatile amid the Federal Reserve's continued dovish stance, persistent and escalating geopolitical uncertainties. Traders should implement robust risk management strategies and remain vigilant, as price swings may become more pronounced in this elevated volatility environment.
Additionally, President Trump’s recent tariff announcements are expected to further amplify market turbulence, potentially triggering sharp price fluctuations and whipsaws.
M15 Chart:
