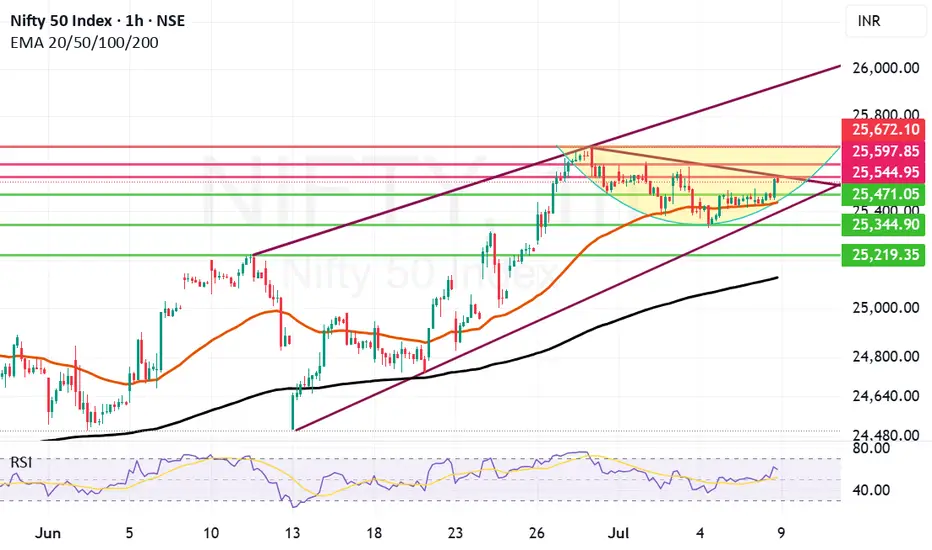
Closing above 25544 should be first step for Nifty to break freeNifty today closed in positive but still it might not be free enough to crate further bull run. the first step that Nifty needs to take to get out of this range bound trade zone or consolidation is to get a closing above 25544.
Further to this step it my find resistances at 25597, 25672. Once we close above 25672 the possibility that Bulls can regaining 26K levels and go even higher becomes stronger.
The Supports for Nifty currently remain at 25471, 25437 which is Mother line or 50 Hours EMA, 25344, 25219 and finally 25125. 25125 is the Father line support or 200 hours EMA. Closing below 25215 will empower Bears to drag Nifty further down wards.
Disclaimer: The above information is provided for educational purpose, analysis and paper trading only. Please don't treat this as a buy or sell recommendation for the stock or index. The Techno-Funda analysis is based on data that is more than 3 months old. Supports and Resistances are determined by historic past peaks and Valley in the chart. Many other indicators and patterns like EMA, RSI, MACD, Volumes, Fibonacci, parallel channel etc. use historic data which is 3 months or older cyclical points. There is no guarantee they will work in future as markets are highly volatile and swings in prices are also due to macro and micro factors based on actions taken by the company as well as region and global events. Equity investment is subject to risks. I or my clients or family members might have positions in the stocks that we mention in our educational posts. We will not be responsible for any Profit or loss that may occur due to any financial decision taken based on any data provided in this message. Do consult your investment advisor before taking any financial decisions. Stop losses should be an important part of any investment in equity.
Candlestick Analysis
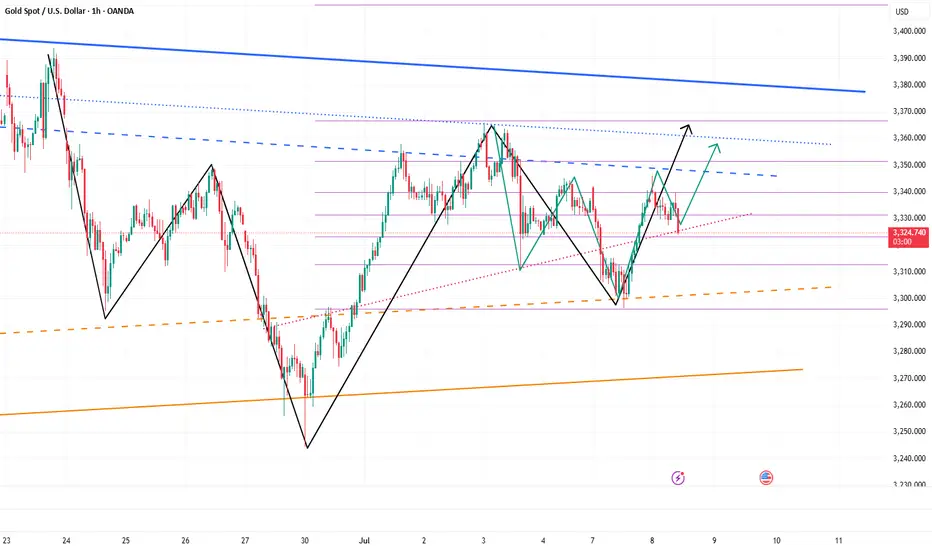
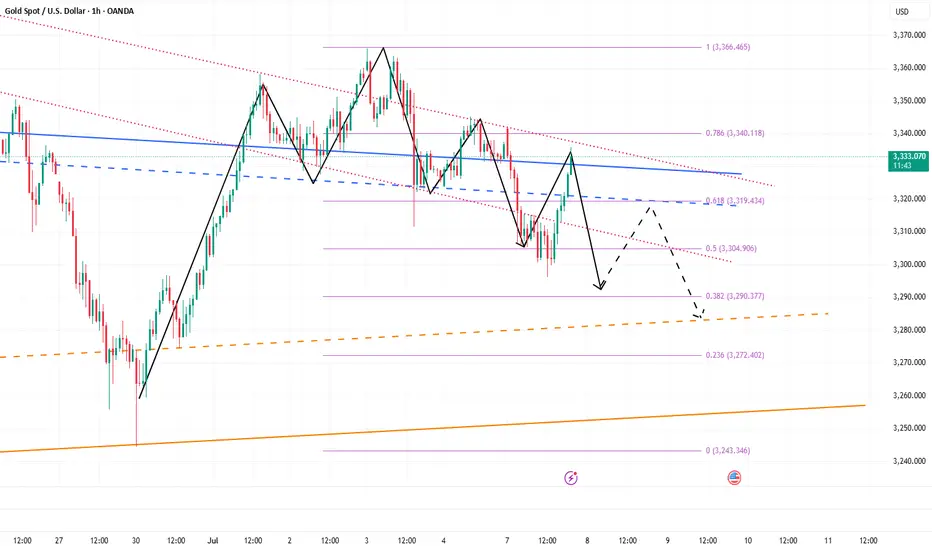
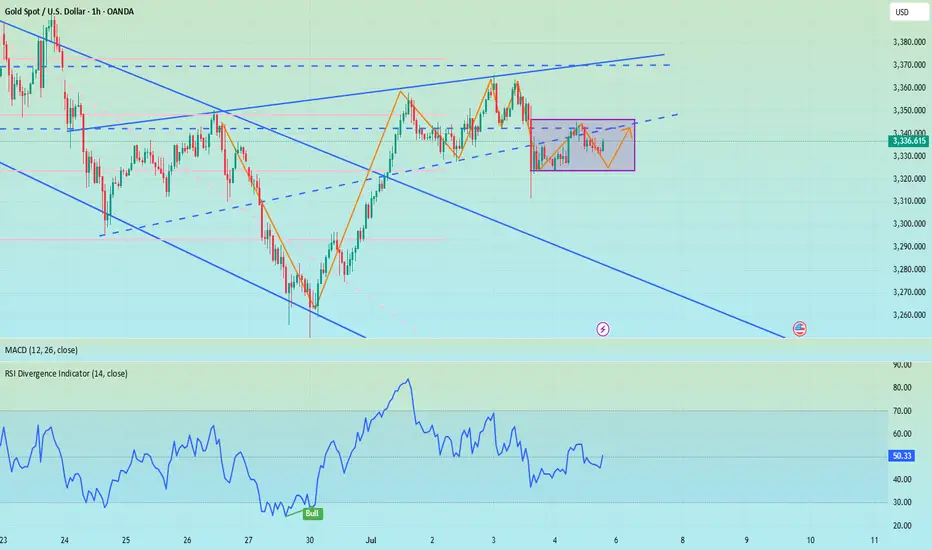
Gold is expected to regain bullish momentum and continue to 3360Yesterday, gold rebounded from 3296 and was able to reach around 3345. Although the process was rather painful, we have to admit that gold bulls still have the energy to wrestle with bears, and the gold market is not one-sidedly dominated by bears. As gold gradually tested and confirmed the effectiveness of support during the retracement process and then rebounded effectively, the short-term structure of gold gradually changed and began to favor bulls.
After gold hit bottom and rebounded yesterday, we can clearly see from the short-term structure that gold has successfully constructed a head and shoulders bottom structure in the three areas of 3295-3244-3296 in the short term, thus playing an absolute supporting role in the structure; and in the process of repeated testing of gold, there are signs of constructing a head and shoulders bottom structure in the three areas of 3310-3296-3325 locally again. Under the effect of the structural support resonance of the head and shoulders bottom, gold may not go below 3320 again, and may even regain the bullish trend and continue to the 3345-3355 area.
So I think there is a lot of profit potential in going long on gold. We can go long on gold with the 3330-3320 area as support and look towards the target area: 3340-3350-3360
EURUSD Short, 08 JulyHTF Bearish Continuation & Intraday Confirmation
HTF bias remains bearish, reacting from W/D OB and completing the daily imbalance left from yesterday. Now looking for continuation lower, supported by a clean 4H OB.
📉 Confluence:
15m Decisional OB in play
5m OB entry zone with a clean 1m BOS
DXY gap + imbalance still open in our favor + Correlation between EU and DXY
Asia session structure aligned
🎯 Entry: Retest of 5m OB after 1m BOS
🛡️ SL: Above recent high, ~10 pips
📌 TP: Asia low – 1:3 RR
⚠️ Risk: OB is mid-Asia (less ideal), and DXY Daily imbalance not filled yet
Still a solid setup with structure + HTF narrative backing it.

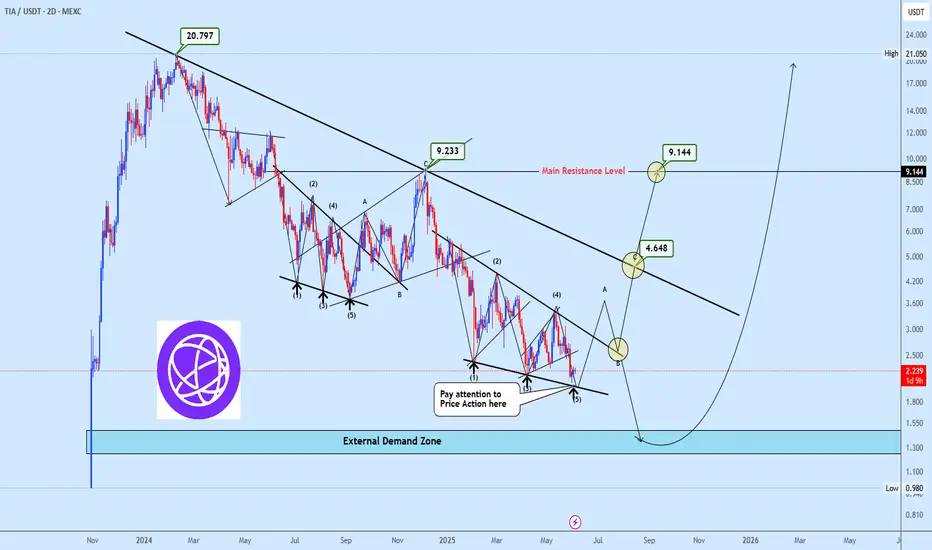
TIAUSDT Monitoring Completion of Bearish 5-Wave FormationTIAUSDT remains in a structured downtrend, nearing completion of a potential 5-wave bearish pattern similar to a previous setup that led to an upside breakout before resuming the decline. A similar scenario is anticipated this time, with plans to go long if price action confirms a strong rejection around Wave 5.
A projected ABC corrective move outlines the near-term bullish targets. The $4.648 level will act as a key pivot; a breakout above it could shift momentum bullishly, opening the path toward $9.144. However, failure at that level may trigger renewed downside toward the $1.30–$1.55 demand zone.
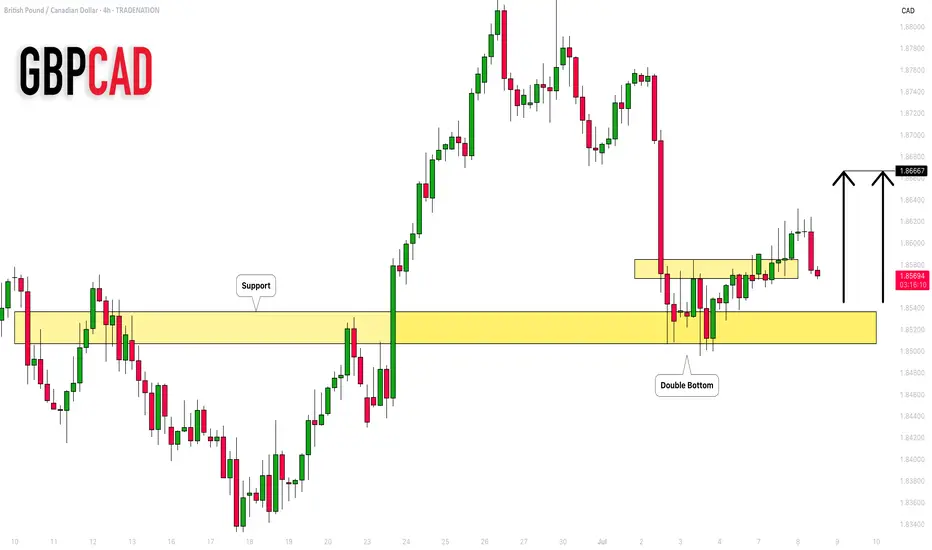
GBPCAD: Bullish Continuation Ahead?! 🇬🇧🇨🇦
One of the pairs that we discussed on the today's live stream
is GBPCAD.
The price nicely respected a key daily/intraday horizontal support.
A double bottom pattern on that and a bullish violation of its neckline
provide strong bullish confirmations.
I expect up move to 1.8666
❤️Please, support my work with like, thank you!❤️
I am part of Trade Nation's Influencer program and receive a monthly fee for using their TradingView charts in my analysis.
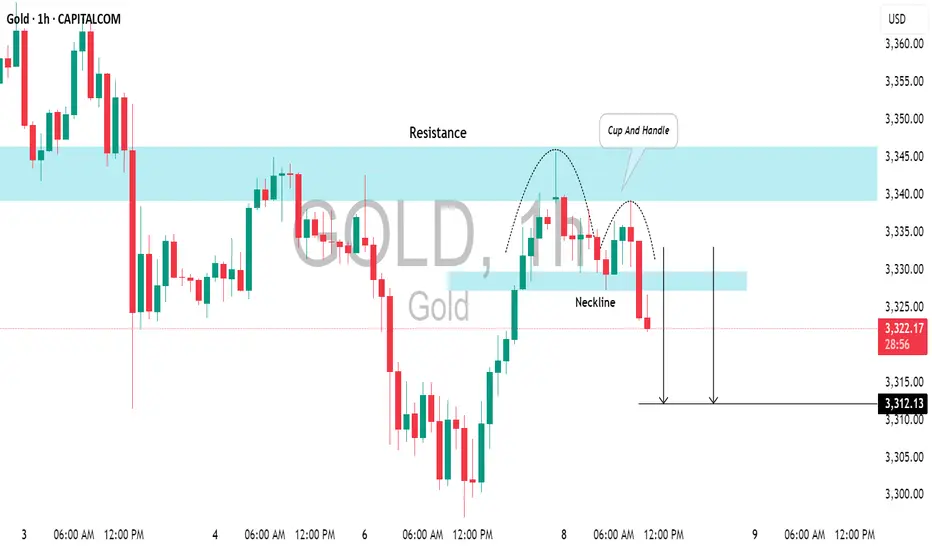
GOLD (XAUUSD): Pullback From ResistanceI believe that 📉Gold price may continue to decline from the identified resistance level.
This outlook is supported by the formation of a cup and handle pattern on an hourly time frame.
My target for this retracement is set at 3312.
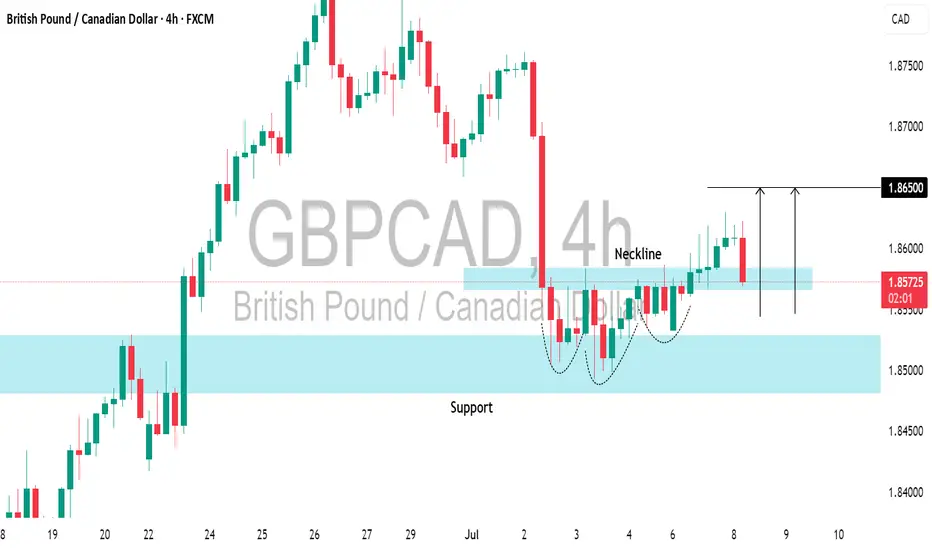
GBPCAD: Classic Pullback Trade for TodayThe GBPCAD pair formed a head and shoulders pattern at a crucial daily/intraday horizontal support level.
The recent breach of its neckline indicates a notable strength of buyers, suggesting a bullish momentum.
Given this technical setup, I anticipate that the pair could rally and potentially reach the 1.8650 level in the near term.
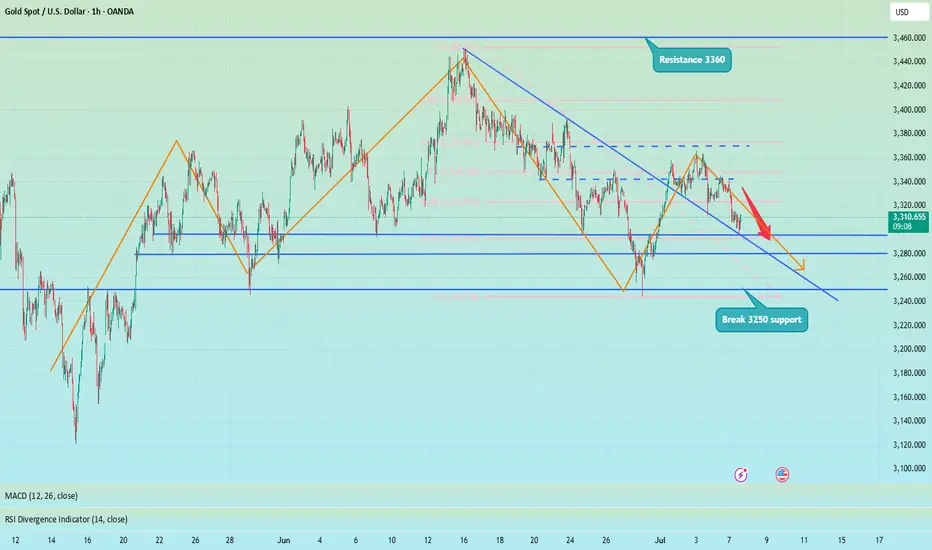
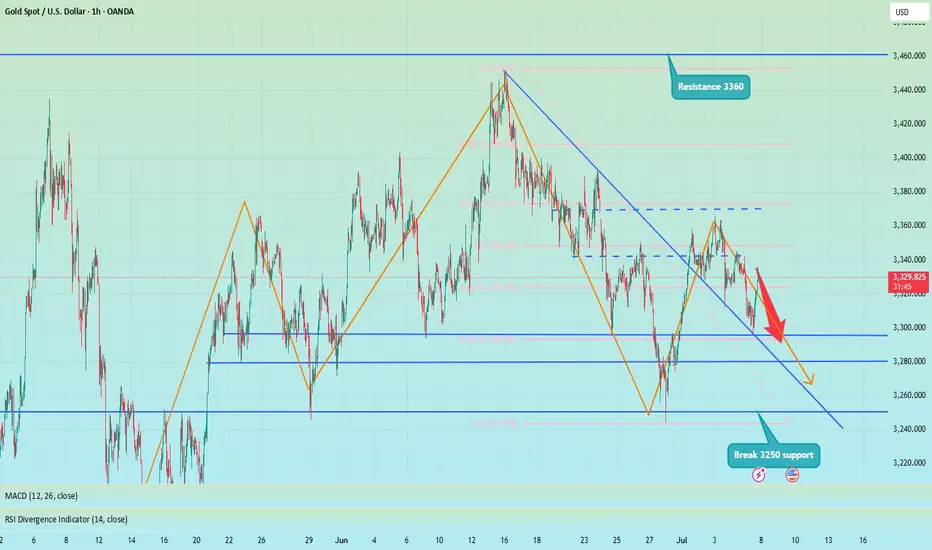
Below 3360, short sellers still have profit potential!Although gold has steadily rebounded to around 3345, compared with yesterday's gold falling below 3330 again, the rebound in the short term is not strong; overall, gold is still in a weak and volatile pattern, with pressure from the upper side at 3350-3360; and there is technical buying support in the lower 3300-3290 area. It is under the influence of the resistance area and the support area that gold lacks continuity.
So before gold breaks through effectively, I think both the long and short sides of gold have profit potential, so for the current short-term trading, we can temporarily maintain the high-sell-low-dregs trading within the range.
1. Consider shorting gold in batches with 3345-3365 as resistance, TP: 3330-3320-3310;
2. Consider going long gold in batches with 3325-3305 as support, TP: 3345-3355-3365
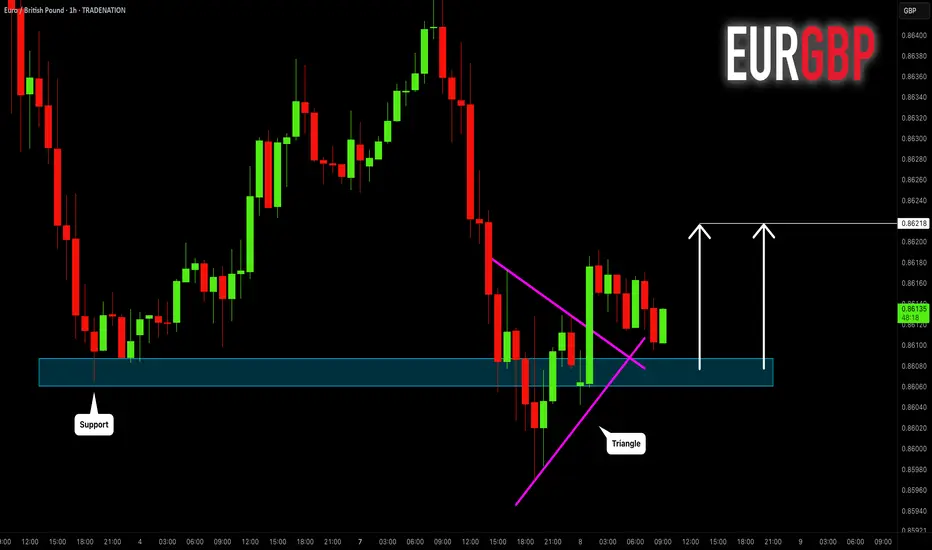
EURGBP: Bullish Move After False Breakout 🇪🇺🇬🇧
EURGBP will likely go up from a key daily/intraday support,
following a bullish breakout of a resistance line
of a bullish triangle on an hourly time frame.
The price may go up to 0.86218 level then.
❤️Please, support my work with like, thank you!❤️
I am part of Trade Nation's Influencer program and receive a monthly fee for using their TradingView charts in my analysis.
SAIL FUTURE - Strengthening on Daily time frameSAIL future getting strengthening along with metal sector in India. SAIL may surge toward 145-148 zone.
This is for educational purpose only - Do your own research before taking any trades

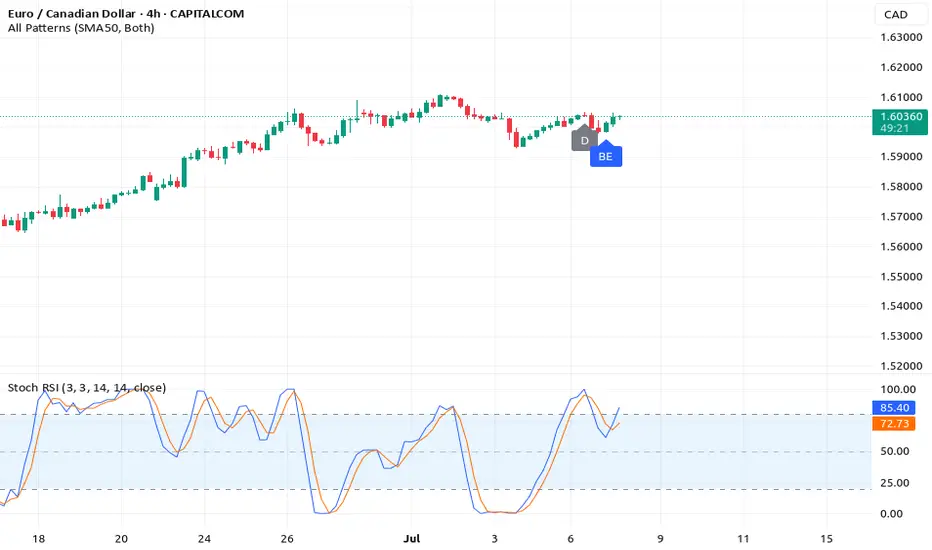
How a Triple Breakout and Daily Reversal Signal Point to a 25%..How a Triple Breakout and Daily Reversal Signal Point to a 25% Bullish Opportunity on EURCAD
Introduction
A strong bullish signal has formed on the EURCAD currency pair, capturing the attention of traders using a combination of
breakout confirmation and daily chart reversal signals. With a clear confluence across the 4-hour, daily, and weekly timeframes,
this technical setup offers a well-supported case for a buy position with an estimated 25% upside, targeting the 1.6100 level.
Whether traded intraday or held for a few days, the structure of this trade offers exceptional technical clarity and reward
potential.
✅ Key Technical Highlights
🔹 4-Hour Breakout Confirmation
The EURCAD pair has broken decisively above a recent range high on the 4-hour chart. This breakout occurred on increased volume,
which validates the move as more than a false spike. Price action shows bullish momentum building as candles close strongly above
the 50-period EMA, indicating short-term strength.
🔹 Weekly Chart Breakout Structure
Zooming out, the weekly chart reveals that EURCAD has cleanly broken through a key resistance zone, which had previously
capped price several times. The breakout aligns with the long-term trend shift, reinforcing the bullish narrative from a macro
perspective. Support now sits firmly below at previous resistance.
🔹 Daily Chart Reversal Signal
The daily chart offers the most critical insight: a strong reversal pattern, potentially a bullish engulfing or morning star, has
formed near the breakout area. This suggests a change in sentiment and invites buying pressure as traders react to the clear
reversal signal after a recent pullback. This reversal provides
timing precision for the trade.
🎯 Take-Profit and Target Projection
The price target is placed at 1.6100, which corresponds to:
A previous structural high
A Fibonacci extension zone
A round psychological number respected historically
The move to this level offers a potential 25% profit window, depending on entry price and lot size. This makes it attractive for both day traders and short-term swing traders.
🕒 Trade Duration Outlook
While this breakout setup is forming across the weekly and daily charts, the 4-hour entry makes it highly suitable for day trading.
Traders who prefer intraday execution can look for a pullback to breakout support for entry, followed by momentum confirmation
from RSI or volume spikes.
Swing traders may hold the position over several days, aiming for the full stretch to the 1.6100 target, while trailing stops to lock in profits.
⚠️ Risk and News Awareness
Traders must remain cautious of:
Oil price movements, which directly impact CAD strength
Economic data from the Eurozone or Canada (GDP, employment, interest rate updates)
Central bank speeches that may introduce volatility
Risk should be limited by placing stop-loss orders just below the 4-hour breakout level or the low of the daily reversal candle.
📌 Why This EURCAD Setup Matters
This setup is more than just a breakout—it combines:
Multi-timeframe confirmation
Momentum breakout on the 4-hour chart
Weekly structure validation
Daily chart reversal timing
These factors build a strong technical case for bullish continuation and provide high confidence for experienced and new traders alike.
Conclusion
EURCAD presents a powerful trading opportunity backed by clear technical signals across major timeframes. With a 25% upside and
precise entry timing from a daily reversal pattern, this is the kind of setup traders seek for both fast profits and well-structured
trades. Whether approached as a day trade or a swing play, the EURCAD breakout is one to watch.
Disclaimer: This content is for educational and informational purposes only. It does not constitute financial advice or a
recommendation to buy or sell any financial instrument. Use a simulation trading account before you trade with real money and learn risk management and profit taking strategies.

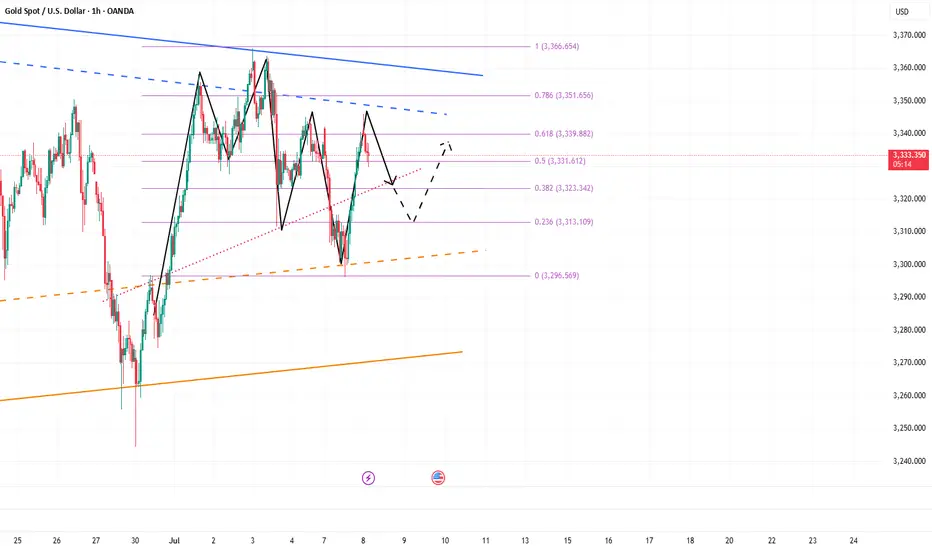
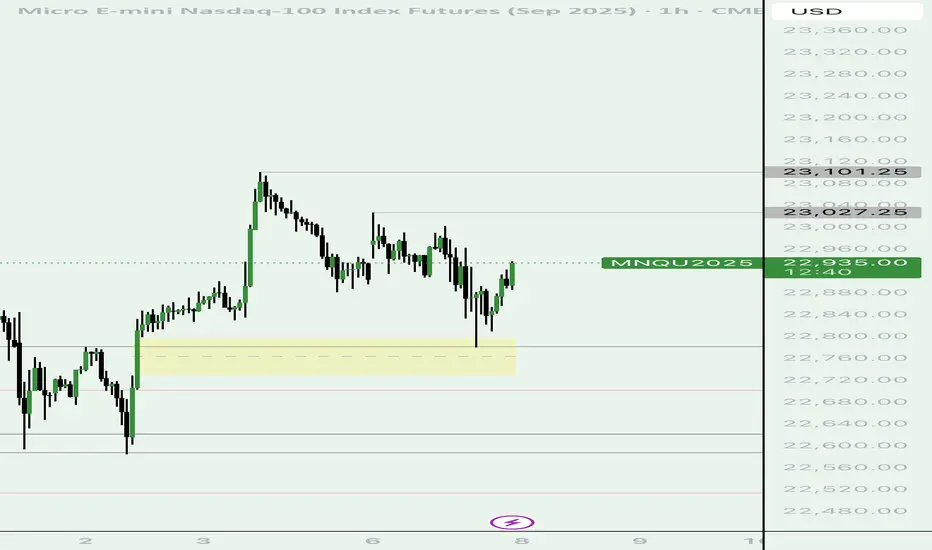
If we are still bullish futures look to expect these levels. If we are still trending bullish a return back to the old gap low found in the fib & the fvg within the 1hr time fractal .. with a continuation of higher futures - we can see the level delineating in gray lines are my upside targets to see want to reprice to in a order to continue higher.
Shorts trapped? No, the head and shoulders top is still downOver the weekend, I gave a trading strategy for going long at 3315-3305. Today, I updated and optimized the long order trading, maintained the high-short-low-long trading strategy, and began to rebound near the 3300 line, and successfully touched the long TP 3333. At present, I am executing short trades again according to the trading strategy and holding short orders.
Although gold has only retreated to around 3330, I am not worried about losses and failures in short trades. As I wrote in today's post, the daily K-line chart has a head and shoulders top pattern. As long as the bulls fail to recover 3360, it is still a short trend. Therefore, in the short term, I still think that the rebound is a good opportunity for us to go short.
At present, the short-term bullish momentum of gold has been consumed and the downward trend continues. Therefore, I still insist on holding short orders in the short term.
In addition to investment, life also includes poetry, distant places, and Allen. Facing the market is actually facing yourself, correcting your shortcomings, facing your mistakes, and being strict with yourself. I share free trading strategies and analysis ideas every day for reference by brothers. I hope my analysis can help you.
FXOPEN:XAUUSD PEPPERSTONE:XAUUSD FOREXCOM:XAUUSD FX:XAUUSD FXOPEN:XAUUSD OANDA:XAUUSD TVC:GOLD
The short position is losing money. What should we do?Gold hit the intraday low of around 3296 and then began to rebound. We can see that the rebound of gold is not strong, but it is relatively sustained, so gold has rebounded to around 3335. To be honest, I did short gold according to my plan and still hold a short position.
Although gold has rebounded to around 3330, I don’t think my short gold trade has failed. As I said in the previous point of view, gold is facing technical suppression of the head and shoulders in the short term, which will suppress the rebound limit within the 3335-3340 area. So before gold stabilizes at 3340, I think the gold shorts still have the upper hand. So as long as gold stays below 3340, I think the gold rebound is a good opportunity to short gold.
At present, gold is facing the resistance area of 3335-3340 and begins to show signs of stagflation. After consuming a certain amount of bullish momentum, the gold shorts may counterattack strongly again and stimulate gold to fall rapidly. Therefore, before gold breaks upward through the 3335-3345 area, we can still consider shorting gold, or continue to hold a short position in gold!
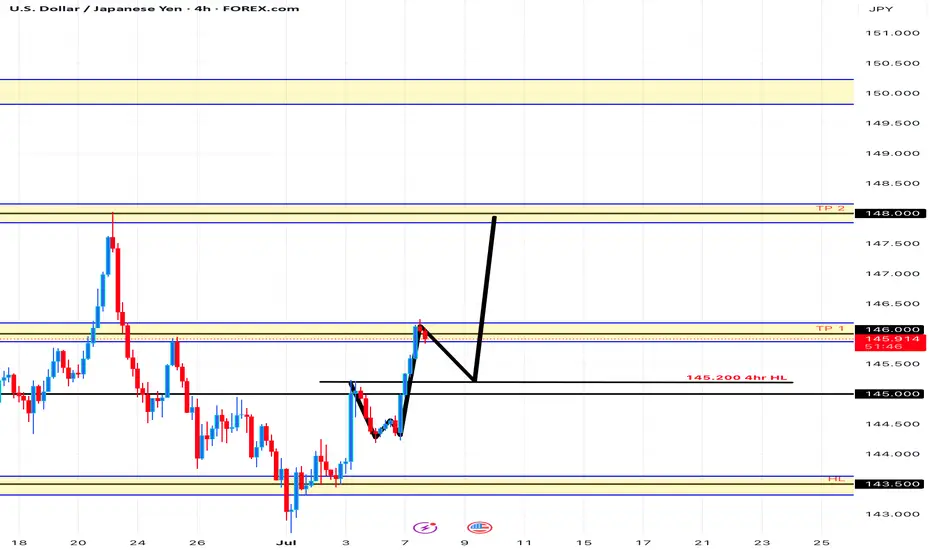
USD/JPY Uptrend On the 4hr We can still see price making Higher Lows and Higher Highs.
Price will retrace to 145.200-145.000 before going back up to 148.000.
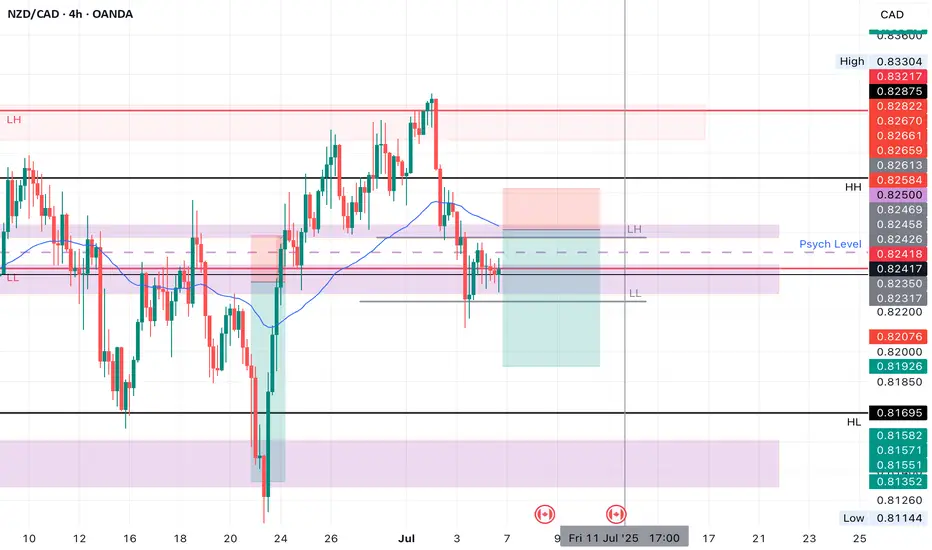
NZDCAD SHORT Market structure bearish on HTFs DH
Entry at both Daily and Weekly AOi
Weekly Rejection at AOi
Daily Rejection at AOi
Previous Structure point Daily
Around Psychological Level 0.82500
H4 EMA retest
H4 Candlestick rejection
Rejection from Previous structure
Levels 3.29
Entry 100%
REMEMBER : Trading is a Game Of Probability
: Manage Your Risk
: Be Patient
: Every Moment Is Unique
: Rinse, Wash, Repeat!
: Christ is King.
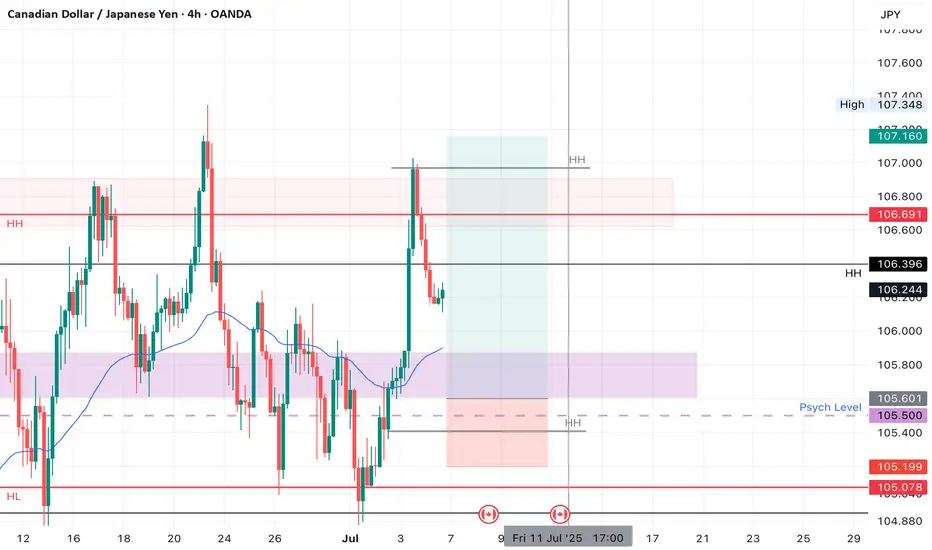
CADJPY LONGMarket structure bullish on HTFs 3
Entry at both Daily and Weekly AOI
Weekly rejection at AOi
Daily Rejection at AOi
Previous Structure point Daily
Daily EMA retest
Around Psychological Level 105.500
H4 Candlestick rejection
Rejection from Previous structure
Levels 3.88
Entry 110%
REMEMBER : Trading is a Game Of Probability
: Manage Your Risk
: Be Patient
: Every Moment Is Unique
: Rinse, Wash, Repeat!
: Christ is King.
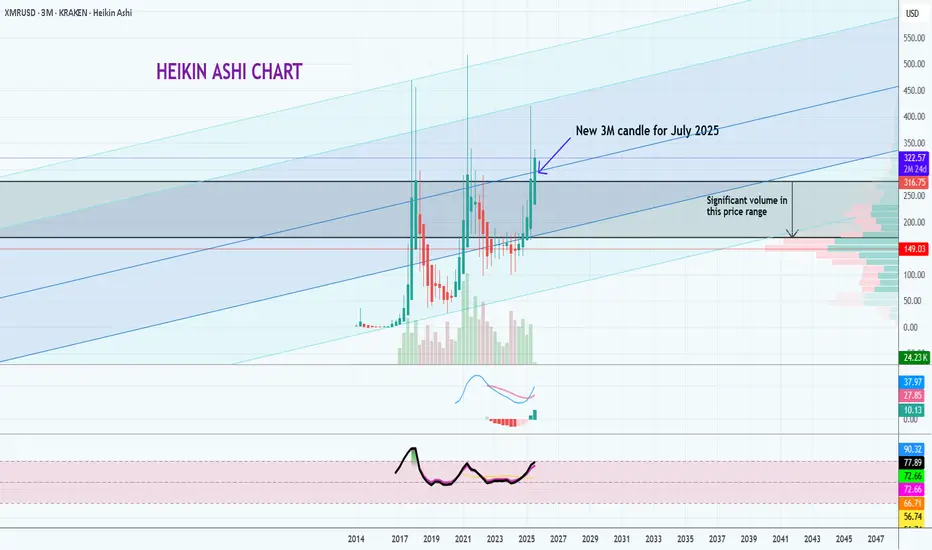
XMR 3 Month Heikin Ashi Trend ChartWe have here a trend outlook chart for Monero on a 3 monthly timeframe (Heikin Ashi candlestick chart). XMR is one of a handful of high market cap coins which have showed signs of strength on a variety of indicators (despite high volatility with various other high market cap coins), including the positive MACD and RSI indicators as shown in this chart.
In addition, there has been significant buy volume in the 170 - 277 price range, as can be seen in the Price-Volume indicator to the right of the chart, keeping the price up.
Monero has withstood the political and economic turmoil in recent months making it a strong contender against some of the largest market cap coins. With the current price sitting at approximately USD$315, there is potential for further upside in the long-term.
_____________
This publication and the information contained in it are for educational purposes only, and is not meant to be nor does it constitute financial, investment, trading or other types of advice or recommendations.
90-day tariffs expire, how to position gold next week📰 News information:
1. 90-day tariffs are about to expire
📈 Technical Analysis:
With the Trump administration's massive tax cut and spending bill officially implemented, the U.S. Treasury may start a "supply flood" of short-term Treasury bonds to make up for the trillions of dollars in fiscal deficits in the future. Concerns about the oversupply of short-term Treasury bonds have been directly reflected in prices. The yield of 1-month short-term Treasury bonds has risen significantly since Monday this week. Slowing wage growth, falling total work hours, stagnant wage income growth and concerns about consumer spending are all signs that support gold.
From a technical perspective, Friday's closing long shadow small candle body, the price closed at a high of 3345 and a low of 3224. The overall idea for next week is to follow the trend and rely on the first short-term support of 3323 below to participate in long positions. Secondly, 3315-3305 is given below. If the support point is lost, then 3300 below is also in danger, and there is no need to overly insist on continuing to do more at low levels in the short-term rhythm. The key pressure above is 3340-3350, and the limit is the pressure of 3360 above.
🎯 Trading Points:
BUY 3325-3323
TP 3333-3340-3350
BUY 3315-3305
TP 3325-3333-3340
In addition to investment, life also includes poetry, distant places, and Allen. Facing the market is actually facing yourself, correcting your shortcomings, confronting your mistakes, and strictly disciplining yourself. I hope my analysis can help you🌐.
FXOPEN:XAUUSD PEPPERSTONE:XAUUSD FOREXCOM:XAUUSD FX:XAUUSD OANDA:XAUUSD TVC:GOLD
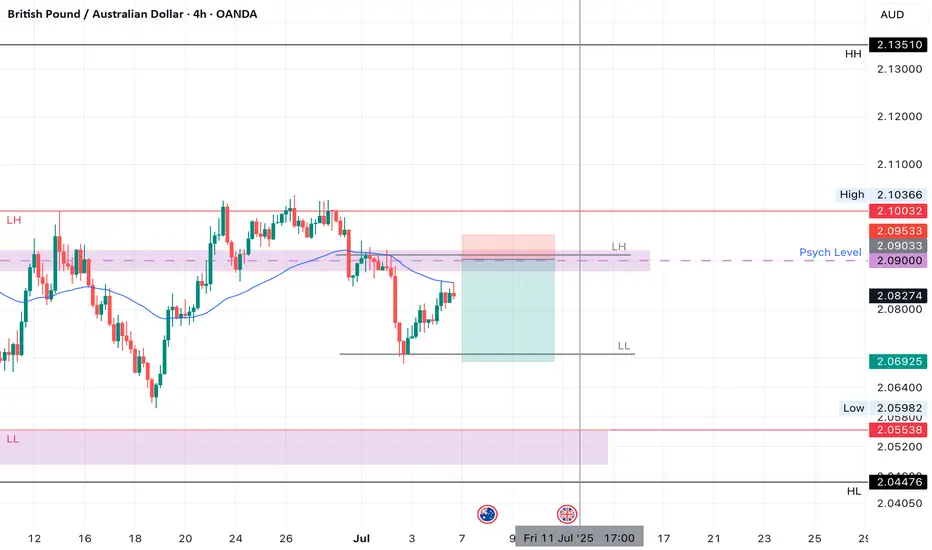
GBPAUD SHORTMarket structure bearish on HTFs DH
Entry at both Daily and Weekly Rejection
Weekly Rejection at AOi
Daily Rejection At AOi
Previous Structure point Daily
Around Psychological Level 2.09000
H4 Candlestick rejection
Rejection from Previous structure
Levels 4.22
Entry 95%
REMEMBER : Trading is a Game Of Probability
: Manage Your Risk
: Be Patient
: Every Moment Is Unique
: Rinse, Wash, Repeat!
: Christ is King.
Gold fluctuates, beware of rebound caused by new tariffs📊 Gold Day Trading Strategy (Recommendation index ⭐️⭐️⭐️⭐️⭐️)
📰 News information:
1. 90-day tariffs are about to expire
2. New unilateral tariffs
3. Geopolitical situation
📈 Technical Analysis:
As I said this morning, shorting gold is divided into two times, the first time is near 3324, and the second time is at 3340 or 3345. If there is a short-term retracement after breaking through 24, you can follow up with a long order to look at 3335-3340. If gold is in a very weak state, you can consider shorting near 3315 and look at 3300. Because during the European session, 3300 has strong support, and the European session repeatedly tests this support. If it falls below 3300, we will go to 3295-3285, or even 3250. But at the same time, we need to pay attention to the rebound of gold that may be caused by tariff policies and geopolitical situations.
🎯 Trading Points:
SELL 3315-3325-3335
TP 3305-3295-3285
BUY 3290-3285
TP 3300-3310-3320
In addition to investment, life also includes poetry, distant places, and Allen. Facing the market is actually facing yourself, correcting your shortcomings, facing your mistakes, and being strict with yourself. I share free trading strategies and analysis ideas every day for reference by brothers. I hope my analysis can help you.
TVC:GOLD OANDA:XAUUSD FX:XAUUSD FOREXCOM:XAUUSD PEPPERSTONE:XAUUSD FXOPEN:XAUUSD