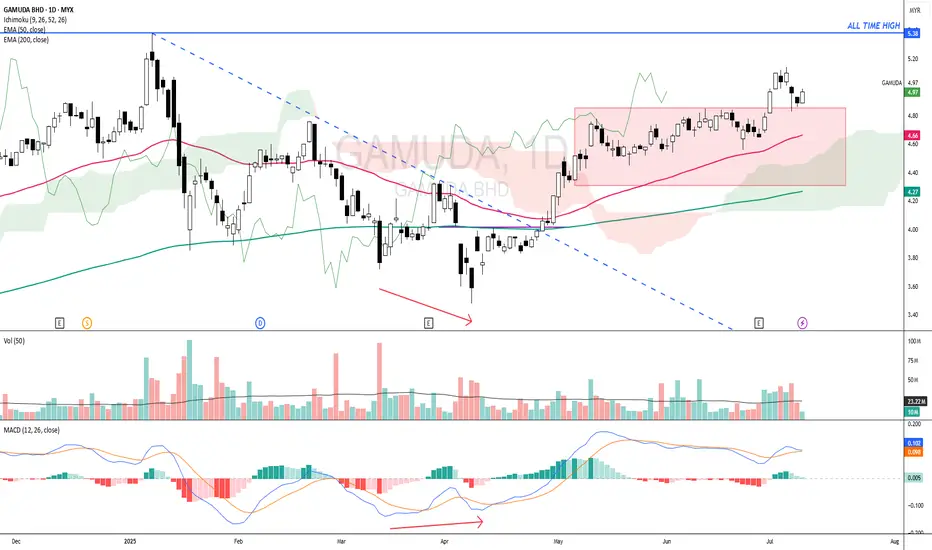
GAMUDA - Leading stock in CONSTRUCTION SECTORGAMUDA - CURRENT PRICE : RM4.97
Based on Japanese Candlestick , 30 April 2025 candle was a LONG CLOSING BOZU WHITE CANDLE . At that particular moment, it changed the trend from BEARISH to BULLISH because :
1) Price already above EMA 200 and closed on that day above EMA 50
2) Price closed into ICHIMOKU CLOUD
3) CHIKOU SPAN starts moving above CANDLESTICK
4) MACD also bullish
At current moment, after two days of selling pressure the share price turns positive today and closed higher than previous day's high. This may consider as potential buy on dips for those didn't have position yet. Supported by rising EMAs, the share price may move up to test the all time high level.
ENTRY PRICE : RM4.94 - RM4.98
TARGET : RM5.36 and RM5.57
SUPPORT : Below EMA 50 on closing basis
Candlestick Analysis
Doge is a LaggerHello I am the Cafe Trader.
Today we are looking at DOGE.
Normally I refuse to look at "Meme Coins" but with a 33 Billion Dollar Market cap, I don't think it falls into it's own category.
Doge, like many Crypto, have come alive. If this is one you are looking at, here are the Keys:
Short Term
A new seller did prevail as of July 23rd. It's important to note that they are still not in control of this rally. We need to see a key buyer get taken out first. This leads us to the scenario I have drawn.
Green Machine
Big buyers move markets... A lot. They can't buy what they want to buy on the open market without a reaction, so what do they do? Simple
Buy... then wait... then buy again near where they bought before.
So your "Strong buyer" is that area.
You have passive buyers looking to get a good price at 19.223 This would offer the greatest position for a reversal and a continuation.
Long
Entry - .19.250
Stop - .17.050
1st TP .24.050
2nd TP .28.600
Final TP .38.250
This should take at least a month. Be prepared to not look at it everyday.
Long Term
These prices should reflect your sentiment on DOGE.
Aggressive = .20.650
Good Price = .18.900 - 19.250
STEAL = 13.950 - 14.550
Thanks for reading, Don't forget to Boost and Follow !
Happy Trading
@thecafetrader

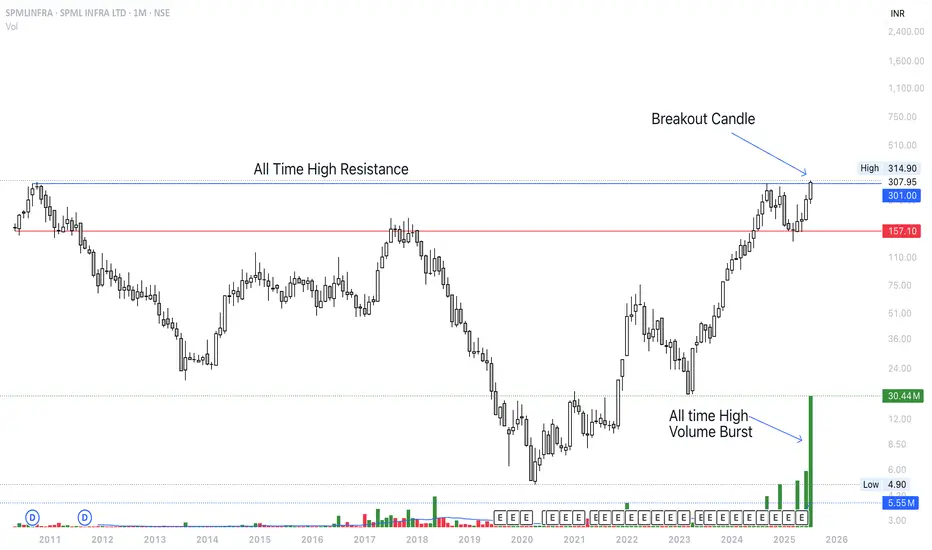
Breakout Soon <> SPMLINFRAStock is pushing above All time High resistance level. Keeping on radar. It would have been solid breakout if the Monthly closing was above 310 level. Volume also supporting the level. Recently realty sector rally also supporting.
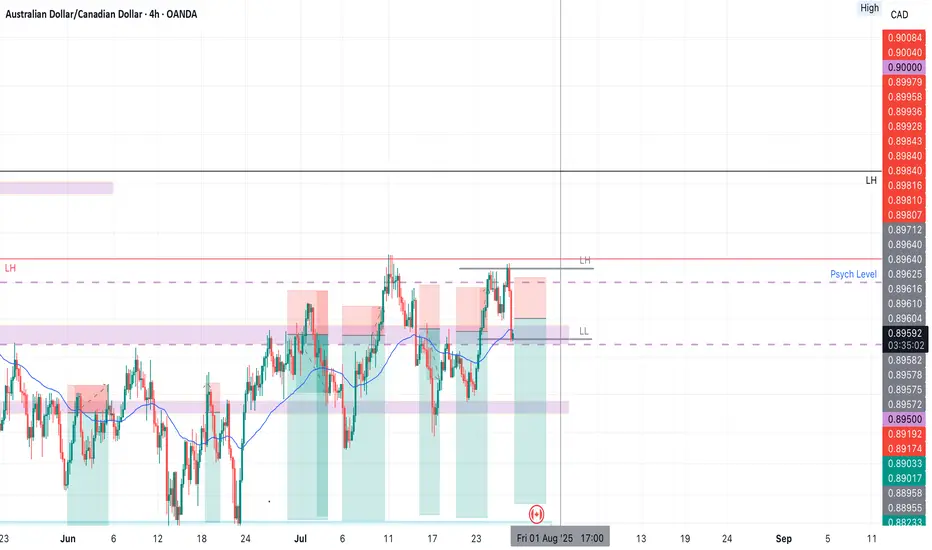
AUDCAD SHORT Market structure bearish on HTFs 3
Entry at both Daily and Weekly AOi
Weekly Rejection at AOi
Previous Weekly Structure Point
Daily Rejection at AOi
Previous Structure point Daily
Around Psych Level 0.90000
H4 EMA retest
H4 Candlestick rejection
Rejection from Previous structure
Levels 4.51
Entry 120%
REMEMBER : Trading is a Game Of Probability
: Manage Your Risk
: Be Patient
: Every Moment Is Unique
: Rinse, Wash, Repeat!
: Christ is King.
Three White Soldiers & Three Black CrowsHello, Traders! 😎
In technical analysis, not all candlestick patterns are created equal. While some merely hint at indecision or short-term corrections, others shout with conviction: "Trend reversal is coming…" Two of the most powerful momentum candlestick formations are the Three White Soldiers and the Three Black Crows. When they appear, traders PAY ATTENTION. In this article, we’ll dive deep into: What do these patterns look like? Why do they form? What do they tell us about market psychology? How to trade them?+ Their limitations 👇🏻
What Are Three White Soldiers and Three Black Crows?
These Are Multi-Candle Reversal Patterns That Suggest A Strong Shift In Market Sentiment:
Three White Soldiers. A 🐂bullish reversal pattern that occurs after a downtrend. It consists of three consecutive long-bodied green (or white) candles, each closing higher than the last, and ideally opening within the previous candle’s real body.
Three Black Crows. A 🐻bearish reversal pattern that shows up after an uptrend. It’s made of three consecutive long-bodied red (or black) candles, each closing lower than the last and opening within the previous candle’s real body. They signal not just a change in price, but a shift in power, from sellers to buyers (or vice versa).
Candles With a Message
Unlike most one-candle signals or minor patterns, these sequences tell a real story. They show that one side has taken clear control over the market — not for an hour, not for a single day, but for multiple sessions. And that kind of shift, especially on higher timeframes like daily or weekly charts, is something seasoned traders pay close attention to.
Let’s get into the psychology for a second. Imagine you’re a trader who just watched BTC drop for two weeks. Then out of nowhere, three strong green candles appear, each more bullish than the last. You’re seeing buyers push through resistance levels like they don’t even exist. That’s not just a bounce, that’s confidence. That’s the kind of thing that makes people FOMO back in, or finally close out their shorts. Same with the Black Crows. If the price has been climbing and suddenly sellers start hammering it for three days straight? That’s not retail panic. That’s big money exiting.
Now, How do Traders Trade Them?
Well, a lot of people jump in right after the third candle closes. If you’re going long on the Three White Soldiers, you’re betting that the breakout has legs. Same for shorting the Black Crows.
But, and here’s the trap, not all of these patterns play out. Sometimes, that third candle is the climax, not the beginning. So confirmation matters. Volume should increase. The move should break a recent key level. Indicators like RSI or MACD should support the shift. Otherwise, you might just be catching the end of a move, not the start of one.
Another mistake? Ignoring context. These patterns mean nothing if they’re forming in the middle of chop or during low-volume holiday trading. They work best when they signal the end of exhaustion.
And let’s be honest. Even if the pattern is clean, you still need a plan. Stops should go below the first green candle (for bullish setups) or above the first red one (for bearish setups). If price moves against you, it means momentum never really shifted. That’s your cue to get out fast.
Final Thoughts
Three White Soldiers and Three Black Crows are powerful tools in the hands of a patient trader. Of course, these patterns aren’t perfect. They don’t account for time, so a 3-day move might seem powerful, but if it happens slowly over 12-hour candles, it’s not as strong as the same pattern on a daily chart with volume.
The takeaway? These are patterns worth knowing, not because they’re magic, but because they reflect a real shift in market behavior. When Three White Soldiers or Three Black Crows show up in the right place, at the right time, with the right confirmation… that’s when charts stop being random and start making sense. But remember. They are indicators, not guarantees. The best traders use them in conjunction with other tools and a clear trading plan.

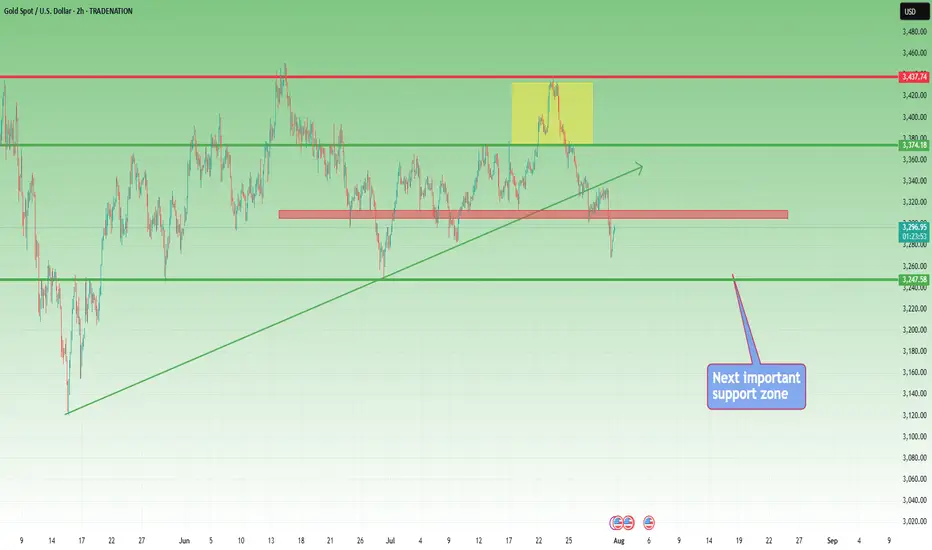
XAUUSD Update – Down Continuation to 3250?1. What Happened Yesterday
After an anemic correction that formed a bearish flag, Gold finally broke below 3300 and even dipped under the 3280 support zone — which was my primary downside target. While the move during the day didn’t have enough momentum to reach my second sell limit, I was already in a low-volume short position, so I didn’t miss the move entirely.
2. The Key Question
Has the drop ended, or are we looking at further downside?
3. Why I Expect More Downside
• The overall structure remains bearish.
• The newly formed resistance (previous support) is now the new sell zone.
• If the price drops towards 3280 again, continuation to 3250 becomes very probable.
4. Trading Plan
Selling rallies remains the preferred strategy, especially on spikes into resistance. As long as the price stays below 3335-3340 zone, the bearish outlook remains intact.
5. Conclusion
Sell the rallies. The technical picture still favors downside continuation — no need to overcomplicate it. 🚀
Disclosure: I am part of TradeNation's Influencer program and receive a monthly fee for using their TradingView charts in my analyses and educational articles.
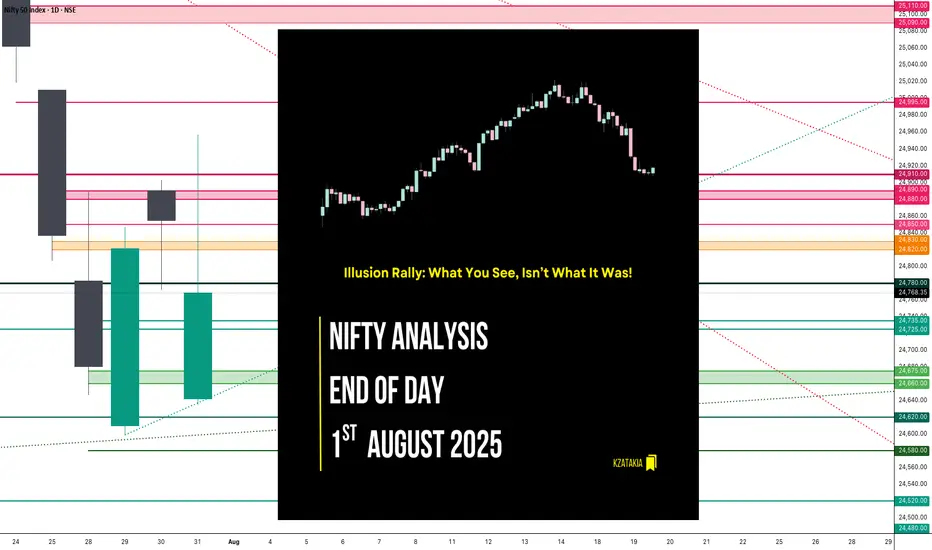
Nifty Analysis EOD – August 1, 2025 – Thursday🟢 Nifty Analysis EOD – August 1, 2025 – Thursday 🔴
🎢 Illusion Rally: What You See, Isn’t What It Was!
🧾 Nifty Summary
As we all expected, a negative gap-down opening occurred due to external news. Nifty opened 183 points lower, tested the 24,660–24,675 support zone, then rebounded sharply after a symmetrical triangle + VWAP breakout. The rally pierced through all key levels like a hot knife through butter, topping at 24,950, only to reverse with equal intensity. Closed at 24,765.
📌 Despite the technical structure, today’s move had no clear technical reasoning — more likely triggered by a mix of tariff news, confidence in Modi, weekly + monthly expiry, and manipulation.
📌 in spite of a bullish candle, strong upper rejection from 24,950 hints weakness. Candle appears bullish on colour, but bears dominated intraday close — forming a bearish Moboroshi Candle (illusion of strength).
📌 Bearish Moboroshi Candle Structure : close > open and close < Previous Close
🔍 Intraday Walk
📉 Gap down of 183 pts
🟢 Support held at 24,660–24,675
🔺 Symmetrical triangle + VWAP breakout
🚀 Sharp upmove to 24,950 zone
🔁 Reversal with same intensity
📉 Closed at 24,765 — below prior close
🖼 5 Min Time Frame Chart with Intraday Levels
📉 Daily Time Frame Chart with Intraday Levels
🕯 Daily Candle Breakdown
Open: 24,642.25
High: 24,956.50
Low: 24,635.00
Close: 24,768.35
Change: −86.70 (−0.35%)
Candle Structure:
✅ Green Candle (Close > Open) → +126.10 pts real body
⬆️ Upper Wick → 188.15 pts (Very Long)
⬇️ Lower Wick → 7.25 pts (Tiny)
Interpretation:
Opened near yesterday's low
Intraday sharp rally towards 24,950+
Faced strong selling at highs
Closed above open, but way below high — signals clear rejection
Candle Type:
📌 Bearish Moboroshi Candle — Appears bullish but hides weakness
🧠 Buyers strong initially, but sellers took control at the top
Key Insight:
Bulls need decisive close above 24,880–24,910
Else, expect drift back toward 24,660–24,675
🛡 5 Min Intraday Chart
⚔️ Gladiator Strategy Update
ATR: 208.29
IB Range: 93.95 → Medium
Market Structure: Unbalanced
Trades Triggered:
✅ 10:40 AM – Long Entry → Trailing Target Hit (R:R – 1:6.25)
📌 Trade Summary: Big R:R win today on breakout with trailing logic execution!
🧱 Support & Resistance Levels
🔺 Resistance Zones:
24,820 ~ 24,830
24,850
24,880 ~ 24,890
24,910
🔻 Support Zones:
24,780
24,725 ~ 24,715
24,660 ~ 24,650
24,620 ~ 24,600
💭 Final Thoughts
"When the move can’t be explained, the best position is caution."
Today's market behavior reinforces the idea that not all moves are technical. Keep your tools sharp, but don’t ignore contextual chaos.
✏️ Disclaimer
This is just my personal viewpoint. Always consult your financial advisor before taking any action.
BTC vs ETH: Lil Bro not waiting on nobody?!As BTC is stuck trying to convince everyone to stay long, ETH is using its bullish orderblocks really well...shorts are showing signs of letting go in these ranges.
Would like to hear your take!

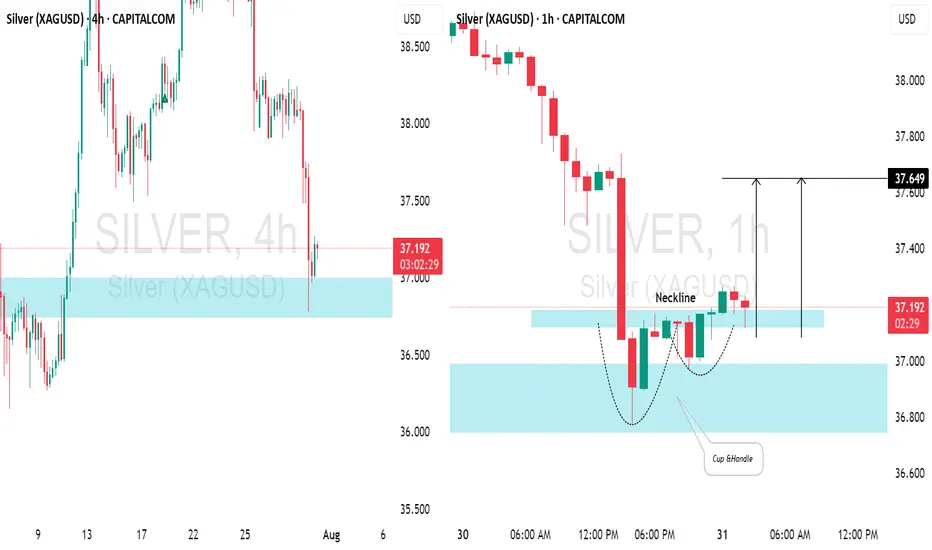
SILVER (XAGUSD): Time for Pullback📈SILVER appears to be oversold following yesterday's decline.
After testing a significant daily / intraday support level, there's a noticeable bullish reversal.
The price formed a cup & handle pattern on the hourly chart and has broken above its neckline. We can expect a pullback to at least 37.64.
XAUUSD (Gold) Analysis – 1H Chart | July 31, 20251. Fakeout & Rejection from Supply
Price faced sharp rejection near the 3,332 resistance. The strong red candle indicates aggressive selling and liquidity grab.
2. Retest of Broken Demand Zone
Gold is now retesting the **3,298–3,305** yellow zone, which previously acted as demand but may now flip to resistance (supply).
3. Bearish Market Structure
The price formed a **lower high and lower low** pattern — a clear sign of downtrend resumption. Current bounce looks corrective.
4. Projection: Potential Drop Ahead
As per the drawn path, if price fails to reclaim above 3,305, a likely drop toward 3,282, then 3,268 is expected.
5. Key Levels to Watch
Resistance: 3,305 → 3,332
Support: 3,282 → 3,268 → 3,246
Bearish bias remains valid below 3,305.

Short Breakdown of Cardano (ADAUSDT) weekly/daily technicalsLooked over this for a friend. Rowland I would love your feedback in the comments 🫡
I will see my biggest expectation is for this to make it's way into the weekly imbalance range below the weekly Mother Candle we are existing within. The entire crypto market seems to want to revisit some key lows to correct some inefficiently delivered rally ranges (meaning too many pending orders left behind due to price not coming back to grab them, happens when HUGE money places--attempts to place/fill--bulk orders).
We are getting what I think is a temporary bullish correction due to taking of profits at key lows. It is my belief/observation that after correcting the newly minted bearish range (grabbing pending shorts above daily highs--turtle soup I think they call it), we will be able to drive down into the bullish imbalance weekly candle's range.
Let's see how we go! 😈

GOLD (XAUUSD): Massive BreakoutGOLD has fallen significantly and closed below an important support level.
The broken structure has now become a strong resistance.
I anticipate further downward movement, with the next support level at 3262.

EURJPY 300+ PIP DROPFrom the beginning of the week i have called out shorts on EJ into 170.000 in the video we can see price hit that support and hitting target for a few positions and entry i called out during the week and also some key points for your personal trading

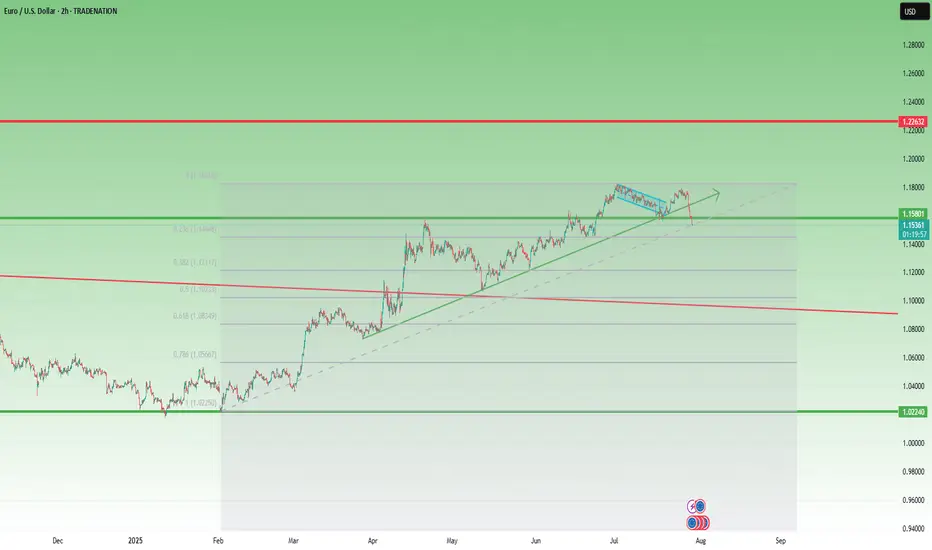
Closed Longs, Now Selling Rallies on EURUSD ReversalAs mentioned in my previous posts, I’m been bullish on EURUSD in the medium term, targeting 1.20 and even beyond.
But no pair—especially not EURUSD, which tends to move more steadily and rationally—goes up in a straight line.
________________________________________
🔹 Last week, the pair stalled just below 1.18, and I decided to close my long trade with a +150 pip gain. That proved to be a wise call, as price dropped hard shortly after.
________________________________________
📉 What’s happening now?
• EURUSD has broken below the rising trendline
• More importantly, it’s broken below the neckline of a double top pattern
• Now trading around 1.1535
This opens the door for a deeper correction, and I expect we could see a test of the 1.1150–1.1100 zone by the end of summer.
________________________________________
📌 Trading Plan:
• I’m now in sell-the-rally mode
• Ideal short entry: around 1.1650, where we also get a favorable 1:3+ risk-reward
• Watch also for interim support around 1.1400
________________________________________
Conclusion:
The bigger picture remains bullish— but this correction looks healthy and isn’t done yet.
Selling rallies makes more sense now, until the structure tells us otherwise.
Disclosure: I am part of TradeNation's Influencer program and receive a monthly fee for using their TradingView charts in my analyses and educational articles.
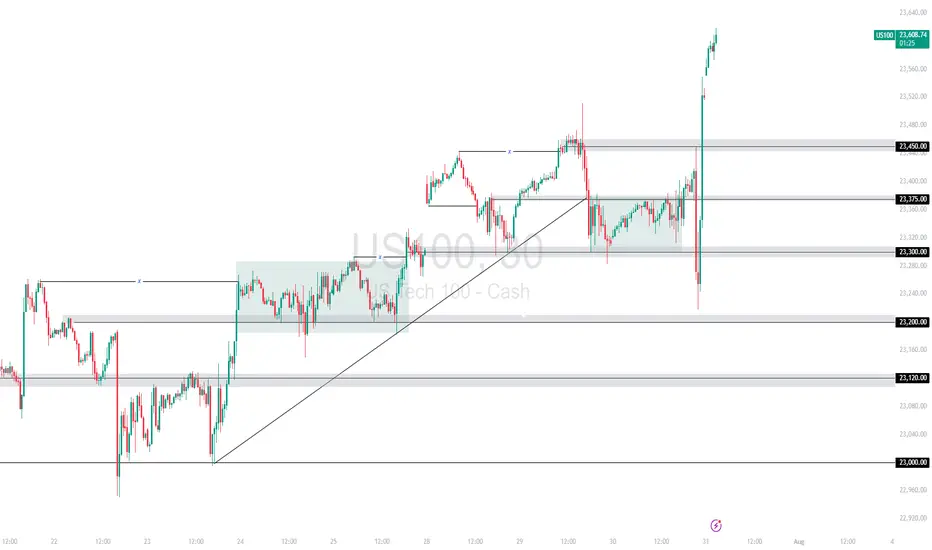
US100 Surges on Strong Fed Data and Trump Trade Deals A combination of upbeat economic data from the Fed and renewed optimism from Trump’s trade announcements fueled a powerful bullish rally on the US100. Price broke above the 23,450 🔼 resistance after reclaiming the 23,300 🔽 zone, leaving behind a strong V-shaped recovery from 23,200 🔽.
Support Levels: 23,450 🔽, 23,375 🔽, 23,300 🔽
Resistance Levels: None locally – price is printing new highs
Bias:
🔼 Bullish: Holding above 23,450 could support further upside. A clean retest may offer continuation entries.
🔽 Bearish: A drop back below 23,450 would weaken the rally and may open the path to 23,375 or 23,300.
📛 Disclaimer: This is not financial advice. Trade at your own risk.
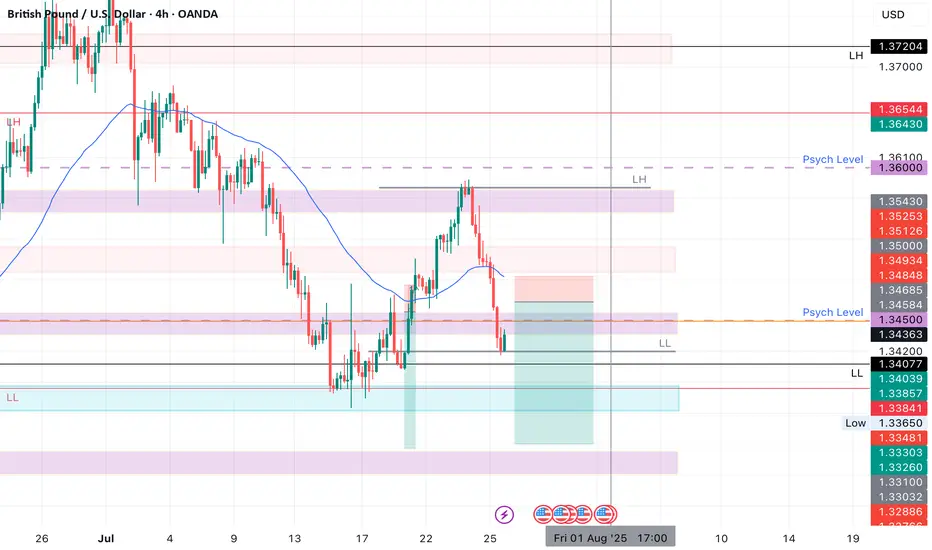
GBPUSD SHORTsMarket structure bearish on HTFs 3
Entry at both Weekly and Daily AOi
Weekly rejection at AOi
Previous Weekly Structure Point
Daily Rejection At AOi
Daily EMA retest
Around Psychological Level 1.34500
H4 EMA retest
H4 Candlestick rejection
Levels 5.55
Entry 105%
REMEMBER : Trading is a Game Of Probability
: Manage Your Risk
: Be Patient
: Every Moment Is Unique
: Rinse, Wash, Repeat!
: Christ is King.
Be cautious with the numerous news and short sell on rebound#XAUUSD
The market is fluctuating sideways, and whether it can achieve a V-shaped reversal still needs to wait for information such as ADP and the Federal Reserve's decision.🗞 Invest lightly today and avoid letting emotions dictate your thinking.⚖️
⚠️Although the market currently predicts that the news information is bullish for gold, and most of the trading voices are centered around bulls, we still need to be wary of the resistance area above 3345-3350.
📉Judging from the daily chart, I have clearly stated in the figure before that the current trend is a converging triangle. If the price hits the triangle boundary, coupled with the interference of external news, it may trigger panic selling, killing a wave of long buyers first🐂, and then trigger an upward trend when it retreats to near the 3300 support level, and may even test the support level of 3285. 🩳
The 4H chart shows that although the rebound momentum is still continuing📈, the gold price is still below the short-term moving average and has only recovered the lower support level. It is necessary to wait for a second retracement confirmation to determine whether a true trend reversal has been achieved. 📈
In addition, the price on the hourly chart continues to run in a downward channel. Combined with the previous trend pattern, after the rebound correction at the 4H level is completed, it is highly likely that the downward trend will continue to return to the lower support level of the daily level.🐻
If resistance is encountered at 3345-3350 for the first time today, consider shorting.💡
If the price currently retreats to around 3320-3315, consider a short-term long position. Long positions held yesterday can be manually closed at around 3330.💡
🚀 SELL 3340-3350
🚀 TP 3330-3320-3300
🚀 BUY 3320-3315
🚀 TP 3330-3340

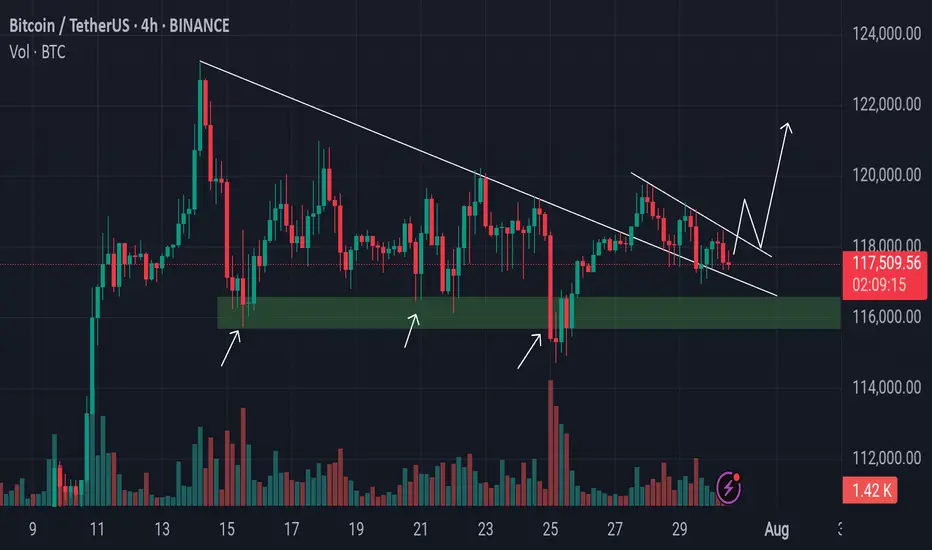
Bitcoin Retests Broken Trendline Minor Resistance in Focus!Bitcoin has recently taken support from the lower levels and moved upward, successfully breaking above a key trendline resistance. Currently, the market appears to be forming another minor trendline resistance on the short-term chart. Interestingly, the previous trendline that was broken is now acting as a support zone, indicating a potential shift in market structure.
If the price manages to break this newly developing minor trendline resistance, we may expect a possible retest of that level. Should the retest hold, it could provide a strong bullish signal, allowing Bitcoin to continue its upward movement toward higher liquidity zones or resistance levels.
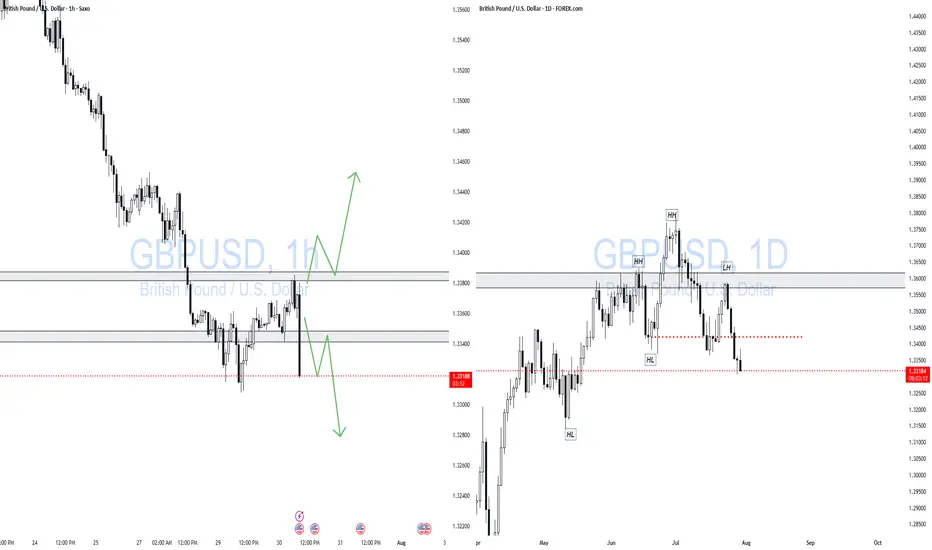
GBPUSD 1H / 1DWait for the price leave the consolidation zone.
If it comes out in Long, wait for the retest in the support and look to enter in Long.
If it goes short, wait for the Retest at resistance and look to go short.
Nifty Analysis EOD – July 30, 2025 – Wednesday🟢 Nifty Analysis EOD – July 30, 2025 – Wednesday 🔴
Trapped in Illusion – A Day of Decoy Moves
Nifty moved 130 points today, falling short of the 2-week average range of 196 points. It formed its IB by 11:40 AM, marking the day's high and low early. For the rest of the session, it hovered between the IB high and the previous day high, eventually closing near the mean.
Despite a close below the open, Nifty managed a green close vs. the previous day—making it a classic "moboroshi candle" day, where visuals deceive sentiment.
📉 Intraday 5 Min Time Frame Chart
🪜 Intraday Walk
IB formed by 11:40 AM
False breakout on both sides trapped traders badly
Nifty stayed stuck between IB high and PDH
Closed slightly above the previous close, but below open
Eyes on breakout of 24,910 for targets of 24,995 and 25,090–25,110
🔄 Trend & Zone Update
📈 Resistance Zone Shifted To: 25,110 ~ 25,090
📉 Support Zone Shifted To: 24,520 ~ 24,480
🕯 Daily Time Frame Chart with Intraday Levels
🕯️ Daily Candle Breakdown
Candle Type: Small Red Hammer‑Like Candle (Decoy / Moboroshi)
Today’s OHLC:
🟢 Open: 24,890.40
🔺 High: 24,902.30
🔻 Low: 24,771.95
🔴 Close: 24,855.05
📈 Change: +33.95 (+0.14%)
📌 Candle Structure:
Real Body: 35.35 pts (Small bearish body)
Upper Wick: 11.90 pts (Very small)
Lower Wick: 83.10 pts (Long)
📌 Key Observations:
Buyers stepped in near 24,770 zone
Closed near open but slightly lower → mild net selling
Long lower wick indicates dip buying support
📌 Implication:
Buyers defended 24,770–24,780 zone
A reclaim of 24,900–24,920 may resume bullish move
A close below 24,770 weakens support
🛡 5 Min Intraday Chart
🛡️ Gladiator Strategy Update
ATR: 195.72
IB Range: 78.15 → Medium
Market Structure: Balanced
💥 Trades Triggered:
🕙 10:25 AM – Short Entry → SL Hit
📌 Trade Summary:
False IB breakouts on both sides led to a stop loss hit—typical trap in a tight consolidation phase.
📌 Support & Resistance Levels
📈 Resistance Zones:
24,880 ~ 24,890
24,910
24,995
25,090 ~ 25,110
📉 Support Zones:
24,830 ~ 24,820
24,780
24,725 ~ 24,715
24,660 ~ 24,650
🔮 What’s Next? / Bias Direction
Awaiting breakout above 24,910 for potential targets of 24,995 and 25,090–25,110. Consolidation may reward patient breakout players in upcoming sessions.
🧠 Final Thoughts
“Structure is key. When levels work, respect them. When they break, adapt.”
Today's range was narrow, but traps show signs of buildup. Be ready when the market unwinds.
✏️ Disclaimer
This is just my personal viewpoint. Always consult your financial advisor before taking any action.

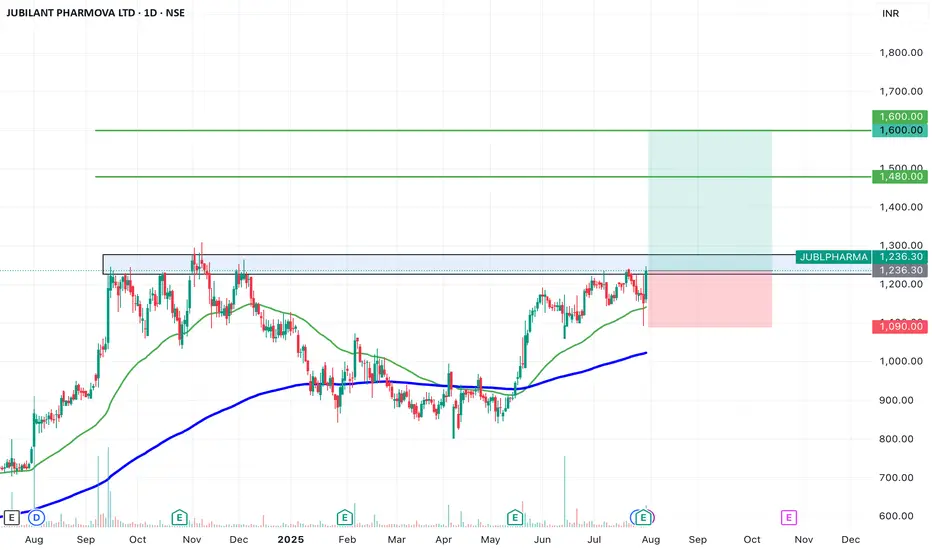
SWING IDEA - JUBILANT PHARMOVAJubilant Pharmova , a diversified pharmaceutical company focused on CRAMS and specialty pharma, is presenting a strong swing opportunity backed by a major pattern breakout and volume confirmation.
Reasons are listed below :
Breakout from an Inverted Head & Shoulders pattern after over a year of consolidation
Attempting breakout above 1250, a key resistance zone with multiple rejections in the past
Strong marubozu candle on the daily chart with a notable volume spike, signaling conviction
Trading near all-time highs, and comfortably above key EMAs, reinforcing trend strength
Target : 1480 // 1600
Stoploss : weekly close below 1090
DISCLAIMER -
Decisions to buy, sell, hold or trade in securities, commodities and other investments involve risk and are best made based on the advice of qualified financial professionals. Any trading in securities or other investments involves a risk of substantial losses. The practice of "Day Trading" involves particularly high risks and can cause you to lose substantial sums of money. Before undertaking any trading program, you should consult a qualified financial professional. Please consider carefully whether such trading is suitable for you in light of your financial condition and ability to bear financial risks. Under no circumstances shall we be liable for any loss or damage you or anyone else incurs as a result of any trading or investment activity that you or anyone else engages in based on any information or material you receive through TradingView or our services.
@visionary.growth.insights
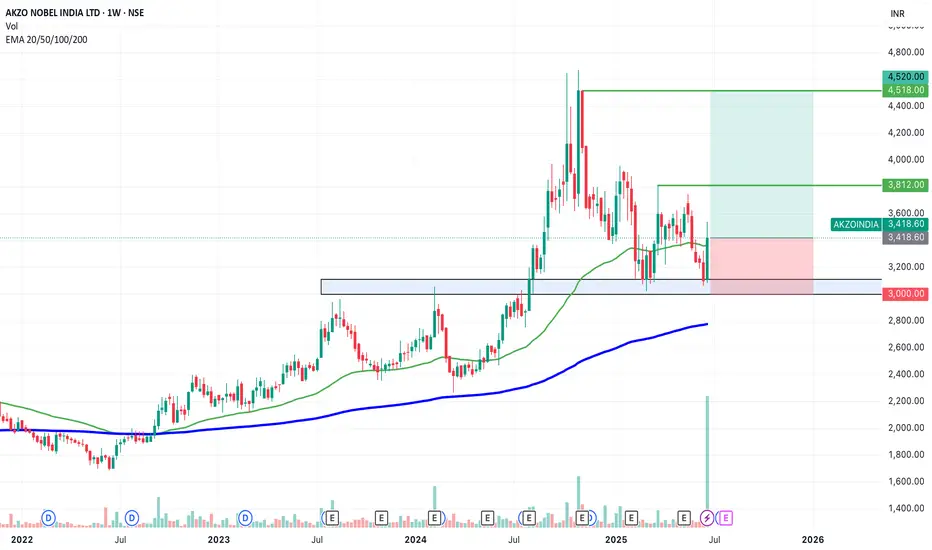
SWING IDEA - AKZO NOBEL INDIA Akzo Nobel India , a subsidiary of the global paints and coatings giant AkzoNobel N.V., is a leading player in India’s decorative and industrial paints market. Known for its premium brand Dulux , the company has strong brand recall, a wide distribution network, and consistent profitability.A strong brand, steady margins, and a bullish chart make this a candidate to watch for a short- to medium-term swing trade.
Reasons are listed below :
Bullish engulfing candle spotted on the weekly timeframe, signaling a potential trend reversal.
Accompanied by the highest-ever volume spike, adding strong conviction to the move.
Price is bouncing off the golden Fibonacci support (0.618), a classic retracement zone where strong reversals often occur.
The level of 3100 acted as a solid support.
The stock is trading above its 50 & 200 EMA on the weekly chart — a sign of long-term strength.
Target - 3812 // 4520
Stoploss - weekly close below 3000
DISCLAIMER -
Decisions to buy, sell, hold or trade in securities, commodities and other investments involve risk and are best made based on the advice of qualified financial professionals. Any trading in securities or other investments involves a risk of substantial losses. The practice of "Day Trading" involves particularly high risks and can cause you to lose substantial sums of money. Before undertaking any trading program, you should consult a qualified financial professional. Please consider carefully whether such trading is suitable for you in light of your financial condition and ability to bear financial risks. Under no circumstances shall we be liable for any loss or damage you or anyone else incurs as a result of any trading or investment activity that you or anyone else engages in based on any information or material you receive through TradingView or our services.
@visionary.growth.insights
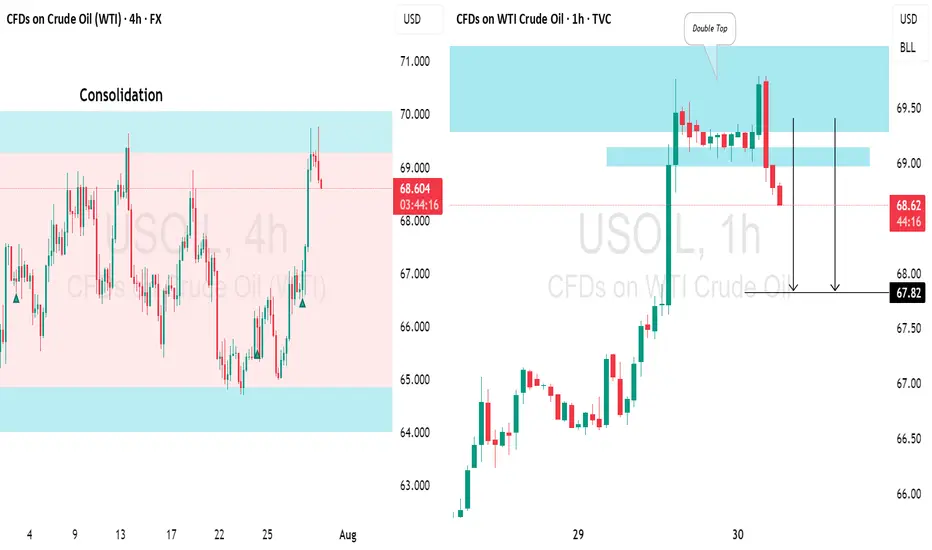
US CRUDE OIL(WTI): Consolidation ContinuesUSOIL is currently consolidating within a horizontal channel and has shown a bearish response at resistance,
The price formed a small double top pattern before declining.
There's a strong likelihood that the price will soon reach the 67.83 level.