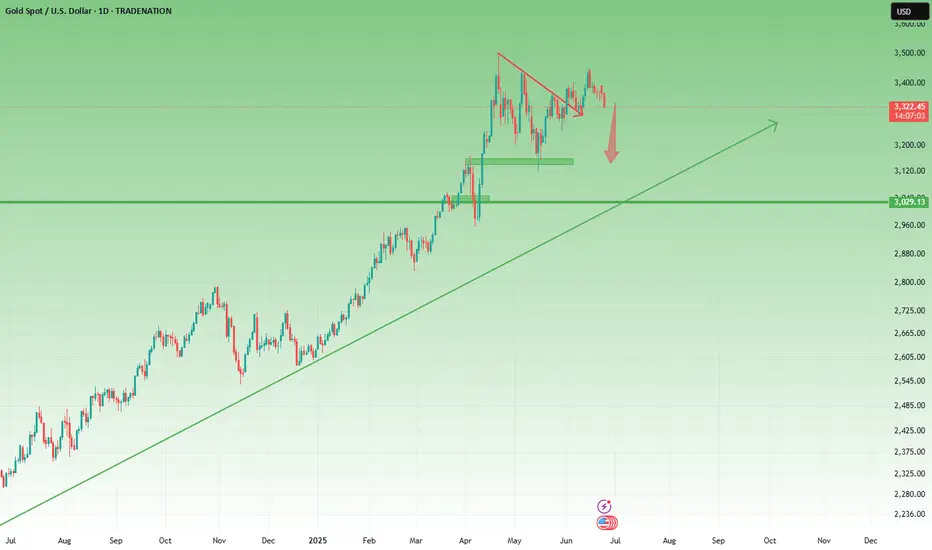
XAUUSD SHORT SETUPExpecting a possible bearish reversal from Gold back to sweep the liquidity below.
Candlestick Analysis
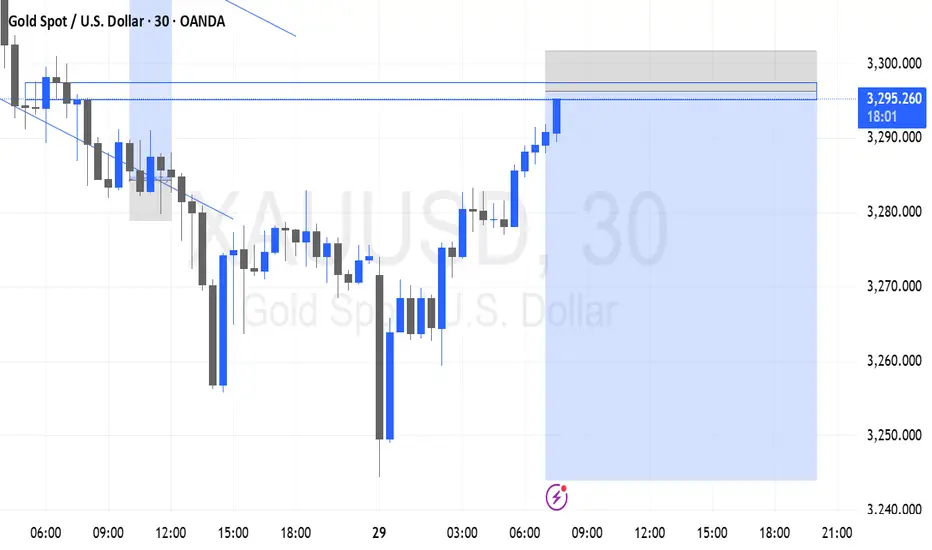
EU trade breakdown 24th June 2x entryBreaking down two of my positions from Tuesday.
First entry was a very aggressive momentum entry on the flip of a M3 imbalance.
Second entry was fantastic and even though it lost - it was a good trade to take. We had HTF alignment as well as a strong London Low to trade away from.

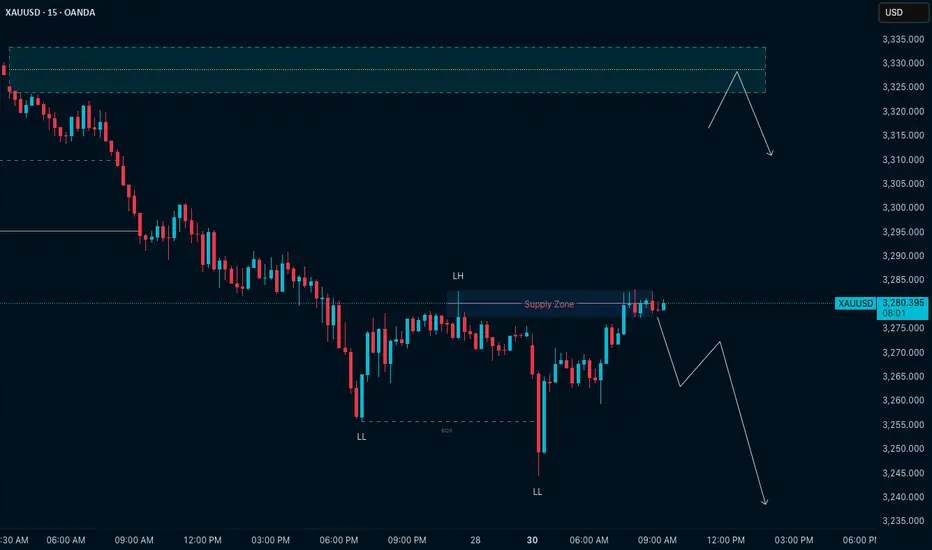
Gold M15 Structure Plan – 3283 is the Mirror (June 30)🟡 Gold – M15 Analysis | June 30
Reflecting live market structure using principles from Chapter 9: H4–M15 Synchrony — from The Chart Is The Mirror
🔻 Setup Overview:
Gold is now trading at a M15 lower high supply zone — a short-term decision point.
Structure offers two clear possibilities :
🔸 Plan A – Short Setup
If price respects the 3283 zone and:
– M1 gives an internal structure shift
– Followed by a clean micro BOS
➡️ I’ll consider a short entry.
🔸 Plan B – Bullish Shift
If the M15 lower high breaks , it becomes a CHoCH .
Then I’ll wait for a proper BOS to confirm bullish intent.
📌 No BOS = No Trade
🧭 H4 Context Reminder:
The 4H structure still suggests price may reach the 3225 POI
before any major bullish continuation resumes.
Patience is key — let structure lead.
📖 From the Mirror Philosophy:
“Trade what the chart reflects — not what you expect.”
The market doesn’t care about bias.
It reflects your patience, discipline, and presence.
📘 Shared by @ChartIsMirror
Author of The Chart Is The Mirror — a structure-first, mindset-driven book for serious traders.
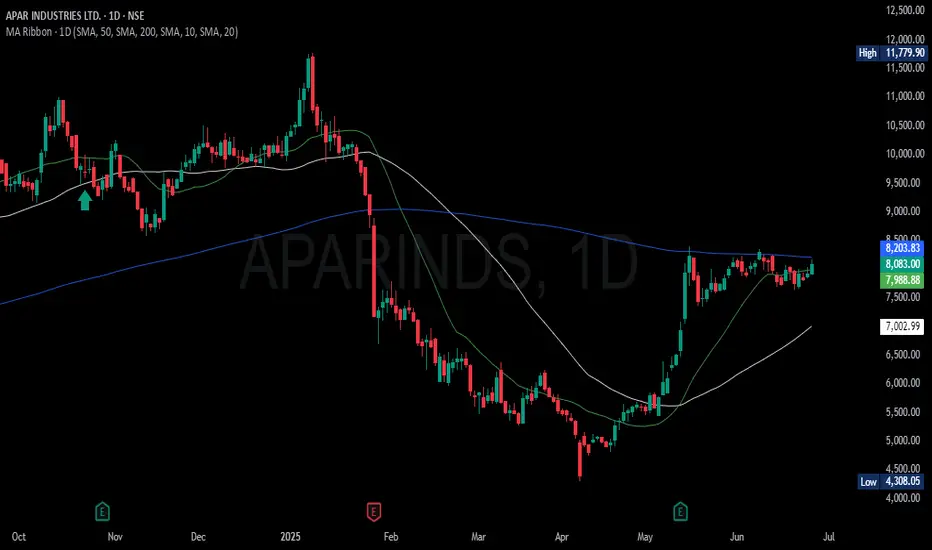
APARINDS Trade for TomorrowApar Industries nicely moving in a tight range for more than a month, Looks like now ready to move up!
$XAUTUSDt 300625 TRADE SETUPWaiting for Price to show its hand, then I'll take a Trade.
Overall 🔺BULLISH; anticipating the PWL to be souped where I will start hunting Entries to LONG.
For Entertainment. Not a Financial/Investment Advice.
What's your view❓

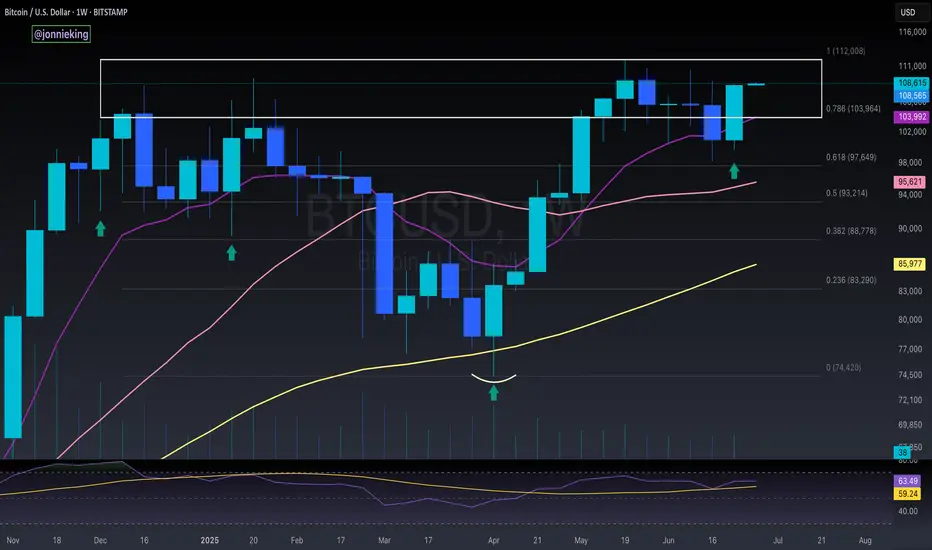
$BTC Bullish Engulfing Weekly CloseCRYPTOCAP:BTC closes the Week with a Big Bullish Engulfing candle back within the POI.
Should retest ATH soon.
Stock Index Futures - ES, NQ, YM - Weekly AnalysisS&P 500 / ESU2025
Key drivers:
Rebounding from April’s tariff-induced lows, boosted by optimism around U.S.–China trade, easing geopolitical tensions, and Fed rate‑cut expectations
Market breadth strengthened as sectors beyond mega-cap tech—especially financials and industrials—joined the rally
Nasdaq / NQU2025
Catalysts:
Continued leadership from AI/digital giants like Nvidia (which rose ~4% on Friday and regained its title as the world’s most valuable company) alongside broader tech momentum
Dow Jones / YMU2025
Highlights:
Strongest weekly performance since early April.
Corporate earnings (e.g., Nike’s better-than-expected report) provided sector-specific tailwinds.
Cross‑asset momentum: Equities rebounded strongly from April’s slump, logging back-to-back months of double-digit gains—fuelled by tariff ease, geopolitical calm, and dovish Fed signals.
Vigilance required: While sentiment is strong, potential catalysts include the July 9 deadline on tariff pauses, upcoming jobs data, Fed commentary, and the tax/spending package.
------------------------------------
I will be approaching the markets differently from now on.
Based on the feedback from past analysis, I will be compiling all related pairs into one video, giving you guys the ability to see how one asset affects the other.
This is called inter-market relationship and it's something i've been doing for years.
It gives you confidence on what pairs are 'Hot Picks' and the ones that have a high chance of not delivering the way you want.

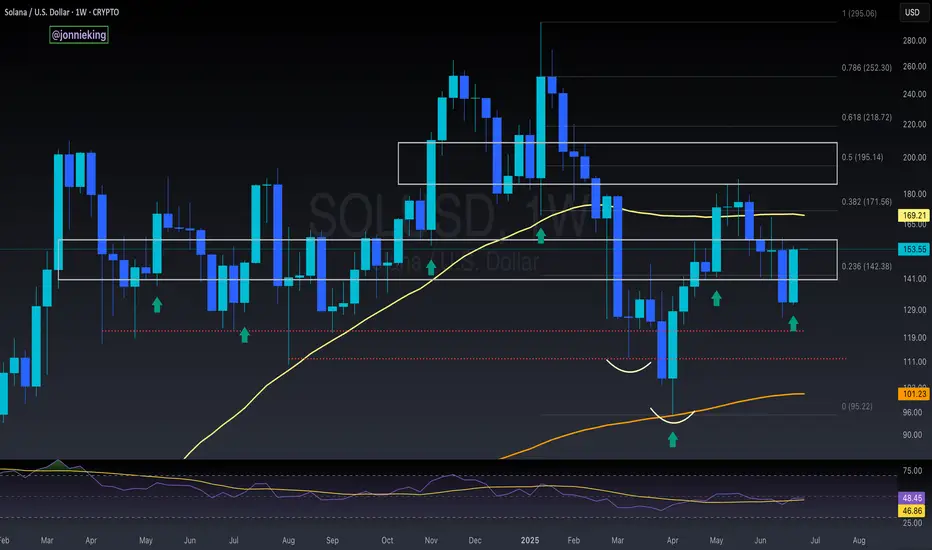
$SOL Bullish Engulfing On WeeklyCRYPTOCAP:SOL closes the week with a Bullish Engulfing candle.
50WMA at $170 next target to smash.
EURJPY ANALYSISAfter seeing the previous weekly candle close bullish confirming buying strength and it could continue into weekly highs and confluences on the daily and the 4hr suggest that too

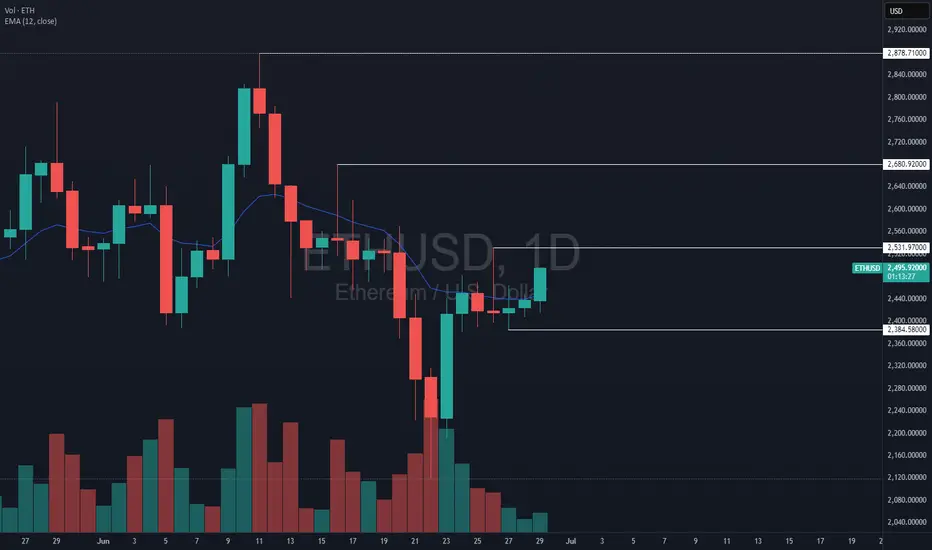
Can Ethereum start a daily uptrend?This daily uptrend might fail because btc dominance is strong but eth bulls are watching
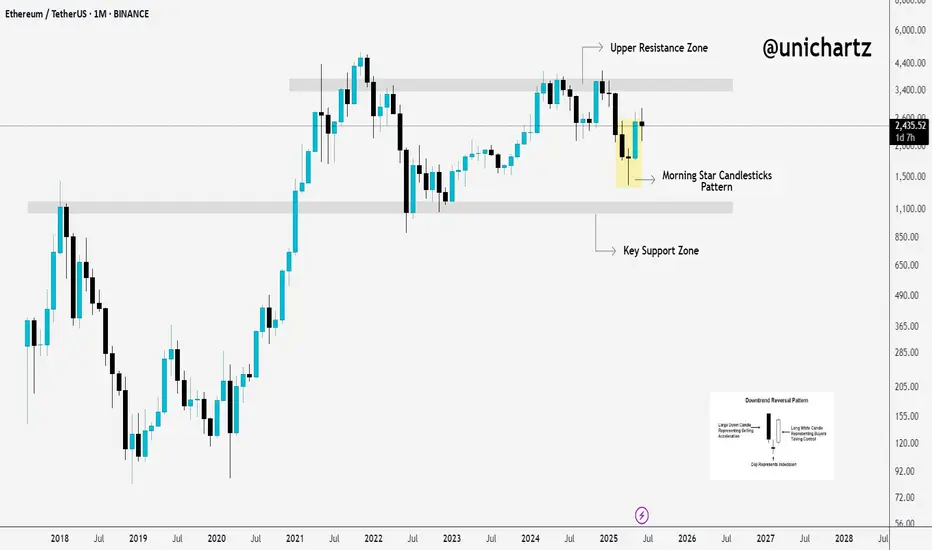
Ethereum Rebounds from Strong Base – ATH in Sight?Hello traders, here’s the CRYPTOCAP:ETH Monthly Outlook
Ethereum is flashing early signs of a bullish reversal, with a clean Morning Star candlestick pattern forming right above the $1,050–$1,200 support zone, a historically strong base.
After bouncing hard from this level, ETH is now approaching the major resistance area at $3,400–$3,800, the same zone that previously rejected upward moves.
If ETH can break and close above this resistance, we could see the start of a fresh bullish leg. But until then, this zone remains a major hurdle.
Keep an eye on the monthly close, it could confirm a shift in long-term momentum.
DYOR, NFA
Thanks for following along — stay tuned for more updates!
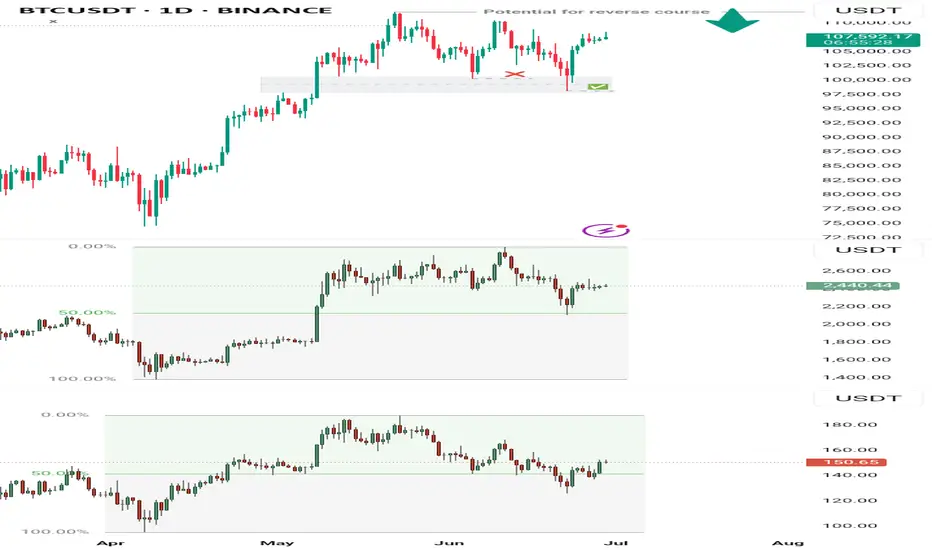
BTCUSDT Market Outlook (Daily Chart)BTC’s failure to rally into a new all-time high (ATH) from the June 5th low can be attributed to the fact that price wasn't coming from a true discount zone. Similarly, key correlated assets like ETH and SOL also hadn’t reached their respective discount levels at that point. This misalignment created an unbalanced market structure, which necessitated a corrective move to realign broader market pricing.
Now that both ETH and SOL have tapped into their discount zones and shown signs of recovery, the conditions are more technically sound to project a potential ATH for BTC in the coming weeks or month. However, on a broader scale, this current rally could serve as a liquidity trap — drawing buyers into a high before distribution.
As for now, any sudden price drop should be seen as a potential buying opportunity into the anticipated new ATH. But caution remains key — any strong sell signal or reversal confirmation near the ATH zone could trigger a significant selloff as sellers regain control.
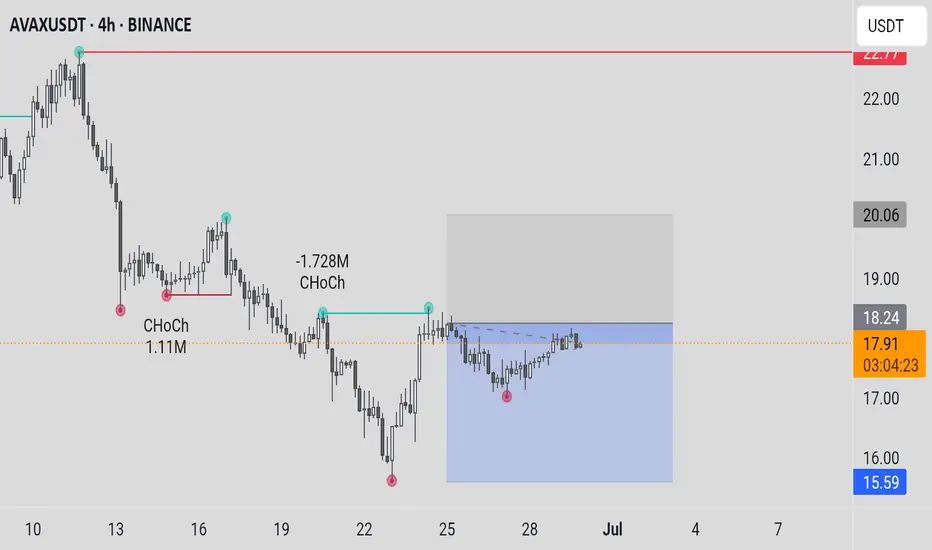
AVAXUSDTCryptocurrency Futures Market Disclaimer 🚨🚨🚨
Trading cryptocurrency futures involves high risks and is not suitable for all investors.
Cryptocurrency prices are highly volatile, which can lead to significant gains or losses in a short period.
Before engaging in crypto futures trading, consider your risk tolerance, experience, and financial situation.
Risk of Loss: You may lose more than your initial capital due to the leveraged nature of futures. You are fully responsible for any losses incurred.
Market Volatility: Crypto prices can fluctuate significantly due to factors such as market sentiment, regulations, or unforeseen events.
Leverage Risk: The use of leverage can amplify profits but also increases the risk of total loss.
Regulatory Uncertainty: Regulations related to cryptocurrencies vary by jurisdiction and may change, affecting the value or legality of trading.
Technical Risks: Platform disruptions, hacking, or technical issues may result in losses.
This information is not financial, investment, or trading advice. Consult a professional financial advisor before making decisions. We are not liable for any losses or damages arising from cryptocurrency futures trading.
Note: Ensure compliance with local regulations regarding cryptocurrency trading in your region.
thanks for like and follow @ydnldn
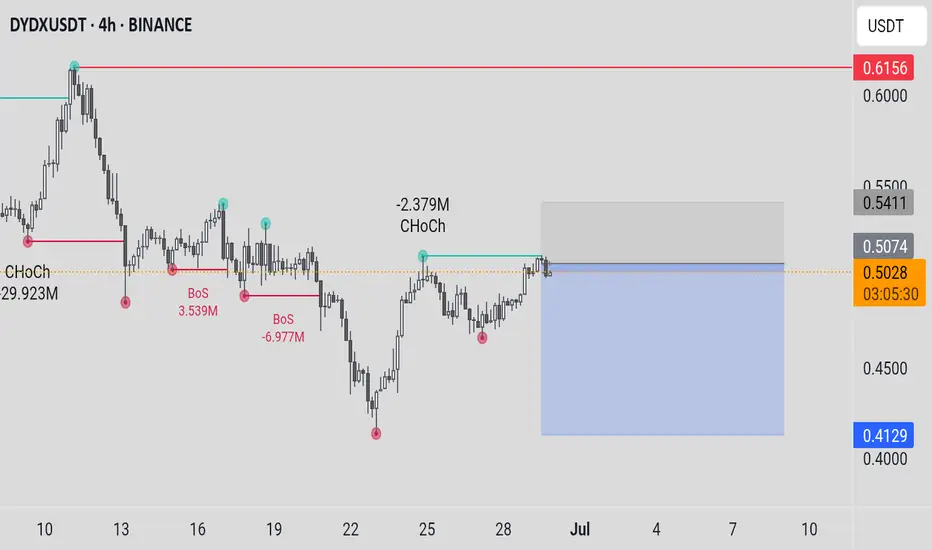
DYDXUSDTCryptocurrency Futures Market Disclaimer 🚨🚨🚨
Trading cryptocurrency futures involves high risks and is not suitable for all investors.
Cryptocurrency prices are highly volatile, which can lead to significant gains or losses in a short period.
Before engaging in crypto futures trading, consider your risk tolerance, experience, and financial situation.
Risk of Loss: You may lose more than your initial capital due to the leveraged nature of futures. You are fully responsible for any losses incurred.
Market Volatility: Crypto prices can fluctuate significantly due to factors such as market sentiment, regulations, or unforeseen events.
Leverage Risk: The use of leverage can amplify profits but also increases the risk of total loss.
Regulatory Uncertainty: Regulations related to cryptocurrencies vary by jurisdiction and may change, affecting the value or legality of trading.
Technical Risks: Platform disruptions, hacking, or technical issues may result in losses.
This information is not financial, investment, or trading advice. Consult a professional financial advisor before making decisions. We are not liable for any losses or damages arising from cryptocurrency futures trading.
Note: Ensure compliance with local regulations regarding cryptocurrency trading in your region.
thanks for like and follow @ydnldn
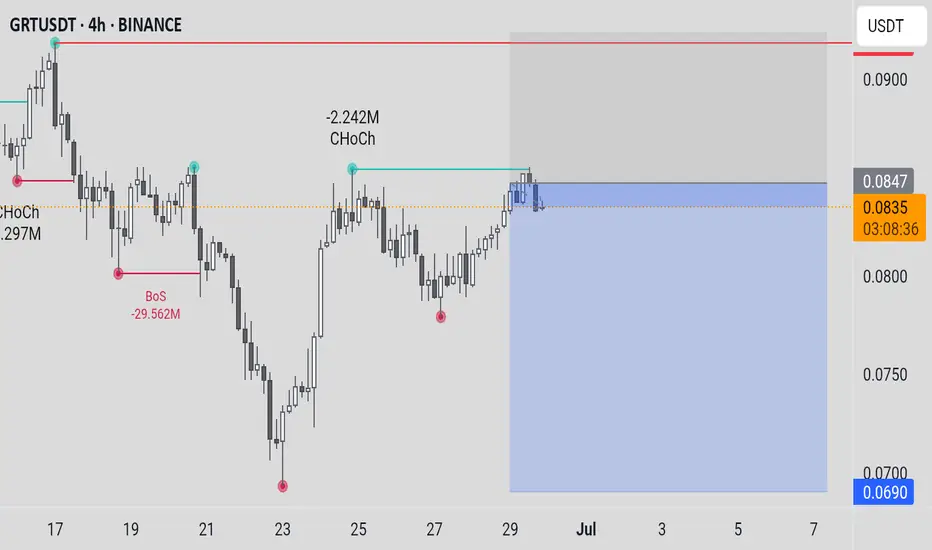
GRTUSDTCryptocurrency Futures Market Disclaimer 🚨🚨🚨
Trading cryptocurrency futures involves high risks and is not suitable for all investors.
Cryptocurrency prices are highly volatile, which can lead to significant gains or losses in a short period.
Before engaging in crypto futures trading, consider your risk tolerance, experience, and financial situation.
Risk of Loss: You may lose more than your initial capital due to the leveraged nature of futures. You are fully responsible for any losses incurred.
Market Volatility: Crypto prices can fluctuate significantly due to factors such as market sentiment, regulations, or unforeseen events.
Leverage Risk: The use of leverage can amplify profits but also increases the risk of total loss.
Regulatory Uncertainty: Regulations related to cryptocurrencies vary by jurisdiction and may change, affecting the value or legality of trading.
Technical Risks: Platform disruptions, hacking, or technical issues may result in losses.
This information is not financial, investment, or trading advice. Consult a professional financial advisor before making decisions. We are not liable for any losses or damages arising from cryptocurrency futures trading.
Note: Ensure compliance with local regulations regarding cryptocurrency trading in your region.
thanks for like and follow @ydnldn
GOLD (XAUUSD): Your Trading Plan for Monday
Gold went strongly rejected from a key daily support on Friday.
Your confirmation signal for a pullback trade from that will
be a bullish breakout and an hourly candle close above
3283 intraday resistance.
After that the price will likely reach 3292 level.
❤️Please, support my work with like, thank you!❤️
I am part of Trade Nation's Influencer program and receive a monthly fee for using their TradingView charts in my analysis.

Last week of June EU outlookWeekly forecast for EU. We have seen a very bullish June so far. We approached a weekly POI before starting to consolidate.
We are now entering the last week of the month where the monthly candle's upper wick needs to be formed.
In this video I have identified a potential area where we could see the pullback take place.

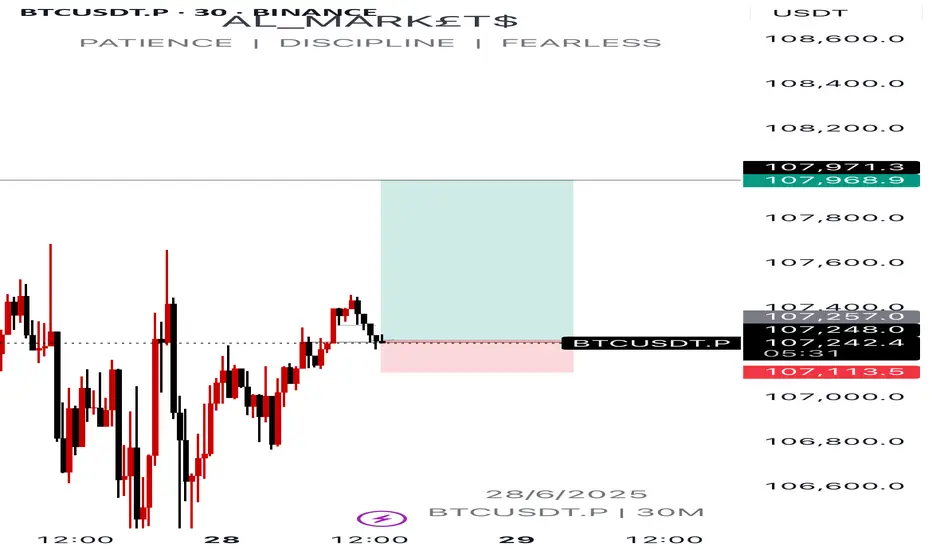
BTCUSDT.P potential short term buysCurrent price action is pointing out to potential short term buys on btc.
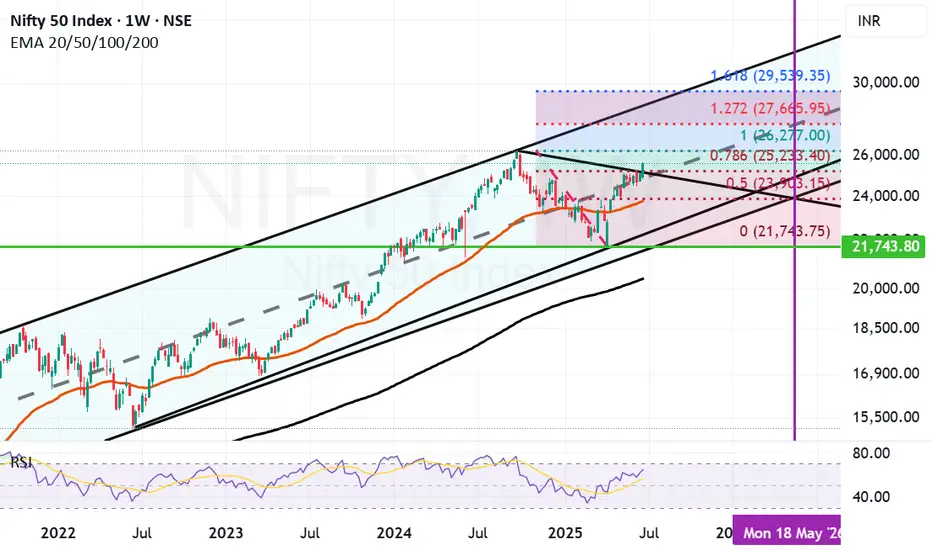
Medium to long term targets for Nifty. We have used parallel channel and Fibonacci retracement on Nifty weekly chart to gauge medium to long term targets for Nifty.
The Fibonacci retracement points out that the support for Nifty will remain at 25233(Fibonacci Support and mid channel support), 23903 (Important Fibonacci support), 23774 (Important Mother line support or 50 weeks EMA, channel bottom support). Nifty can go below these levels only in situation of another major global event or some major local event. If we get a closing below 23774 the Bear will be in commanding situation and will have the power to take Nifty further down towards 21743 which was the recent low we reached during Indo-Pak conflict.
The resistances for Nifty now are at 26277 (Major Resistance, Previous All Time high of Nifty), The next leap of faith for Nifty can be towards 27665 after we get a closing above 26277. (This will be a major hurdle and in next 1 year or so it is highly unlikely that we will cross this level unless we hit a euphoria zone.) This zone is also the current channel top zone. In very unlikely circumstance of Nifty crossing 27665 the next target for Nifty will be at 29539. (This looks possible in 18 to 24 months). We will be very lucky to reach this zone earlier. You never say never in the market.
As of now the local factors remain optimistic but there is a concern by experts related to valuation of market. As the Nifty PE currently is around 23. The results in the next couple of quarters will determine if Bull market stays active.
Disclaimer: The above information is provided for educational purpose, analysis and paper trading only. Please don't treat this as a buy or sell recommendation for the stock or index. The Techno-Funda analysis is based on data that is more than 3 months old. Supports and Resistances are determined by historic past peaks and Valley in the chart. Many other indicators and patterns like EMA, RSI, MACD, Volumes, Fibonacci, parallel channel etc. use historic data which is 3 months or older cyclical points. There is no guarantee they will work in future as markets are highly volatile and swings in prices are also due to macro and micro factors based on actions taken by the company as well as region and global events. Equity investment is subject to risks. I or my clients or family members might have positions in the stocks that we mention in our educational posts. We will not be responsible for any Profit or loss that may occur due to any financial decision taken based on any data provided in this message. Do consult your investment advisor before taking any financial decisions. Stop losses should be an important part of any investment in equity.
Gold – Can It Recover From 3 Week LowsGold is back in focus this morning after it fell to a 3 week low at 3287 in early European trading.
Part of the reason for the fall may have been the on-going ceasefire agreement holding between Israel and Iran, which can reduce the need for Gold as a safe haven, or prices may have been influenced by comments from US Commerce Secretary Lutnick made to Bloomberg TV overnight which suggested that the Trump administration have plans to reach agreements with a set of 10 major trading partners ahead of the July 9th pause deadline to reinstate higher tariffs.
Of course, these potential Gold negatives need to be balanced against the potential positives of increased optimism in recent days that the Federal Reserve may cut interest rates by more than expected into the end of 2025 as the US economy stalls, and the US dollar printing a fresh 3 year low yesterday.
Looking forward, the release of the Fed’s preferred inflation gauge, the PCE Index at 1330 BST later today could hold the key to whether Gold falls below support to even lower levels (see technical section below) or moves back higher again into Friday’s close.
Whatever the outcome, its setting up for an interesting end of the week for Gold.
Technical Update:
With selling pressure developing in Gold again so far this morning, traders might well be searching for next support levels that may be successful in limiting current price declines, or if broken, could in turn lead to a more extended phase of weakness.
Much will depend on future price trends and market sentiment, but as the chart above shows, latest price activity is this morning posting new 3-week lows for Gold. This suggests traders might now be focused on 3245, equal to the last correction low in price posted on May 29th as the next possible support level.
While not a guarantee of further declines if broken, 3245 closing breaks could lead to further price weakness towards 3120, the May 15th downside extreme.
Of course, it is possible this 3245 low does continue to act as support to price weakness and may turn activity higher again. However, if this is to lead to a more sustained period of price strength, resistance might now stand at 3356.
Equal to the Bollinger mid-average, closing breaks might be required to suggest possibilities to resume price strength back towards the 3435/3452 May 6th and June 16th price failure highs.
The material provided here has not been prepared accordance with legal requirements designed to promote the independence of investment research and as such is considered to be a marketing communication. Whilst it is not subject to any prohibition on dealing ahead of the dissemination of investment research, we will not seek to take any advantage before providing it to our clients.
Pepperstone doesn’t represent that the material provided here is accurate, current or complete, and therefore shouldn’t be relied upon as such. The information, whether from a third party or not, isn’t to be considered as a recommendation; or an offer to buy or sell; or the solicitation of an offer to buy or sell any security, financial product or instrument; or to participate in any particular trading strategy. It does not take into account readers’ financial situation or investment objectives. We advise any readers of this content to seek their own advice. Without the approval of Pepperstone, reproduction or redistribution of this information isn’t permitted.
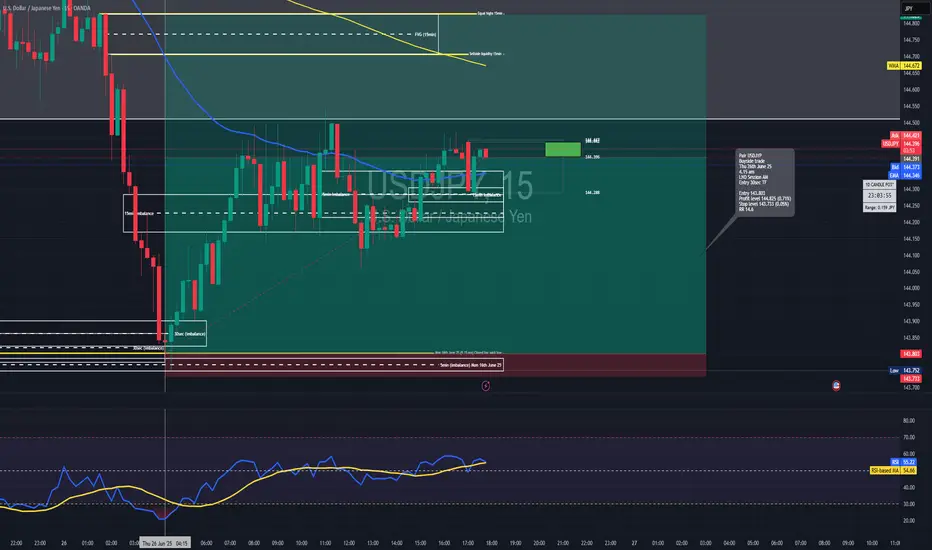
Long trade
30sec TF entry
📍 Pair: USDJPY
📅 Date: Thursday, June 26, 2025
🕒 Time: 4:15 AM (London Session AM)
⏱ Time Frame: 15min
📈 Direction: Buyside
📊 Trade Breakdown:
Metric Value
Entry Price 143.803
Profit Level 144.825 (+0.71%)
Stop Loss 143.733 (−0.05%)
Risk-Reward
Ratio 14.6 : 1
🧠 Context / Trade Notes
🔄 15 Minute Structure Support:
The trade was based on a reactive low from the 5-minute TF, aligning with a buy-side imbalance zone formed on the 5-minute chart (Monday, 16th June, 10:00 AM).
📉 RSI in Low Region:
RSI was observed in an oversold condition on LTFs, providing additional confluence for a short-term reversal setup.
30sec TF entry overview
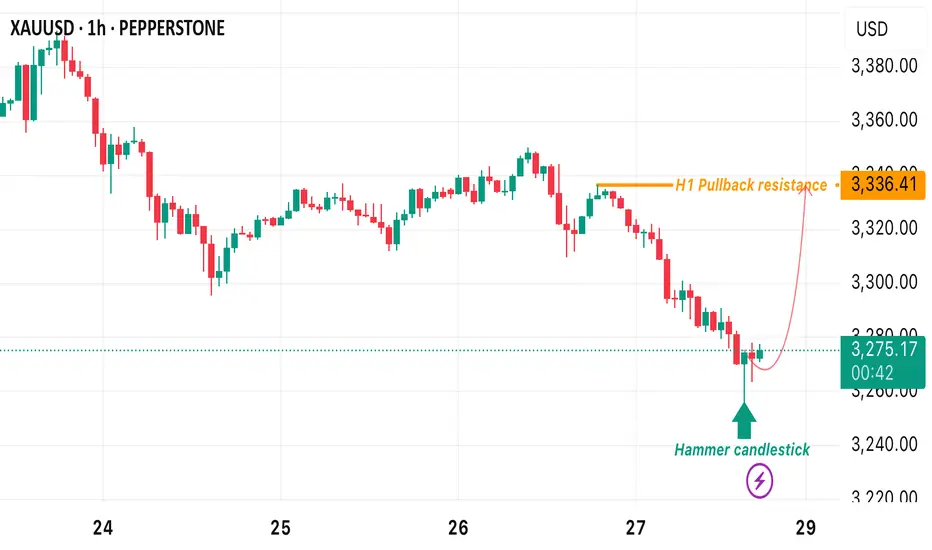
XAUUSD BUY OPPORTUNITY!!Price just formed a reversal Candlestick in H1 after making a new low recently.
From the technical standpoint, i anticipate price to retrace back to the pullback resistance of 3336.41 from the current market price.
Gold Fails to Hold the Fear – Ceasefire Triggers 500+ Pip DropIn yesterday’s analysis, I pointed out that despite the weekend escalation in the middle-east, which triggered a gap up in Gold, the price action didn’t confirm the fear narrative. Gold failed to hold its gains – a clear sign of weakness.
📌 What happened next?
Throughout the day, Gold attempted multiple pushes toward 3400 – but each effort was met with strong selling pressure.
Then came the ceasefire announcement… and Gold dropped hard, now trading around 3320, locking in over 500 pips of profit from my short setup.
________________________________________
❓ More importantly, what’s next for Gold?
More important than the short-term noise is what the charts are now telling us:
📉 Weekly chart? Bearish.
🕯️ Daily chart? Also turned bearish after last week’s indecisive price action.
________________________________________
📌 Strategy remains the same:
I continue to sell rallies, and I’m now watching the 3280 support zone for a possible test in the coming hours.
Patience. Discipline. Let the market come to you. 🚀
Disclosure: I am part of TradeNation's Influencer program and receive a monthly fee for using their TradingView charts in my analyses and educational articles.