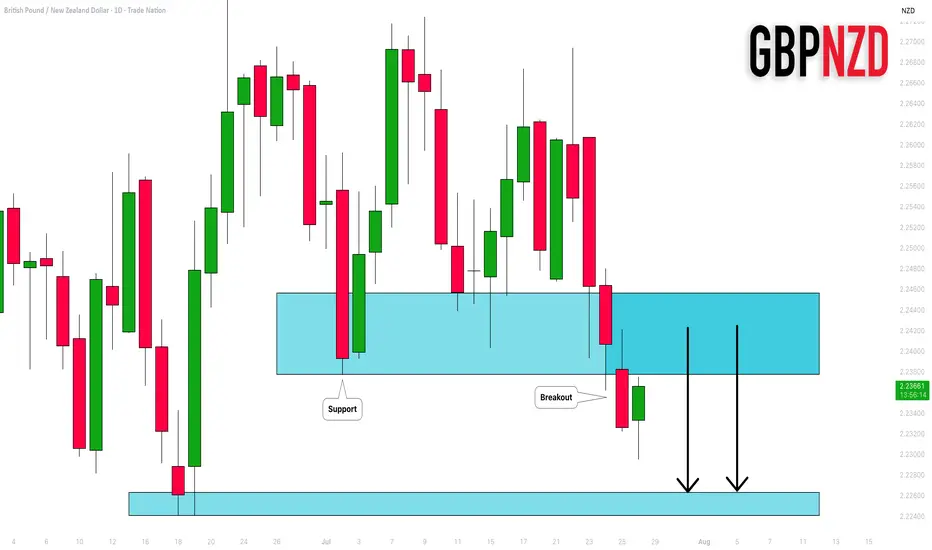
GBPNZD: Important Breakout 🇬🇧🇳🇿
GBPNZD broke and closed below a significant support cluster on a daily.
The broken structure turned into a strong resistance.
I will expect a bearish move from that.
Next support - 2.2264
❤️Please, support my work with like, thank you!❤️
I am part of Trade Nation's Influencer program and receive a monthly fee for using their TradingView charts in my analysis.
Candlestick Analysis
EURCHF: Classic Gap Trade 🇪🇺🇨🇭
There is a huge gap up opening on EURCHF.
The price tested a key intraday resistance with that and formed
a strong bearish imbalance candle then.
Probabilities will be high that the market will fill the gap today.
Goal - 0.9338
❤️Please, support my work with like, thank you!❤️

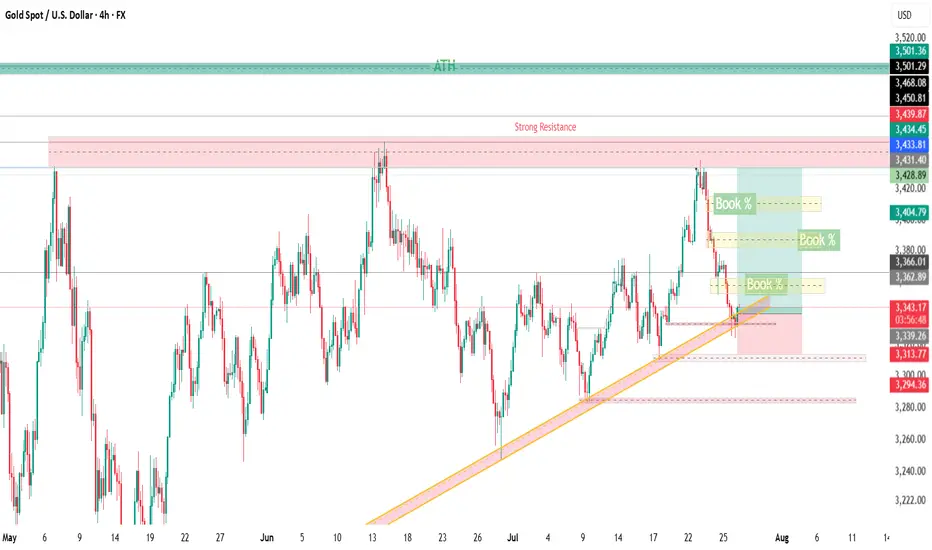
XAUUSD📈 XAUUSD (Gold) – Buy Setup | 4H Timeframe
Market Context:
After continuous selling, price is now testing a strong 4H and Daily support zone.
A clear bullish candle has formed, signaling potential reversal.
— proper SL is essential.
🔔 Trade Plan: Buy Gold
Entry: Stop Loss: TP mentioned in charts
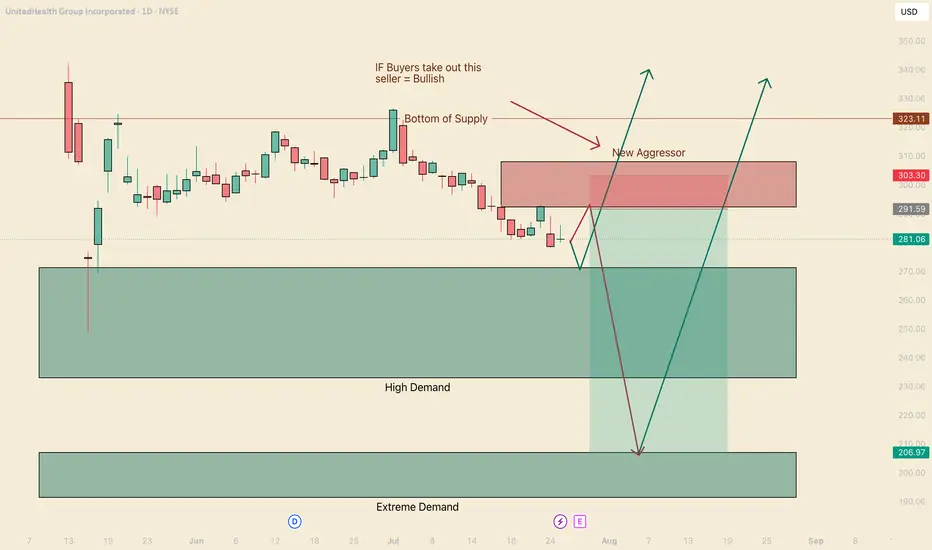
Bears are still in controlHello I am the Cafe Trader.
Today we are going to be taking a look at UNH. No doubt this has to have come across your feed or in the news recently. Why is every so Bullish? People are so bullish, that it spooks me... Everyone is pumping this emphatically, I feel like they are getting paid to pump it. This is a bold statement, but It's a gut feeling.
Tin Foil
If people get paid to pump, The huge seller isn't done selling, and needs you to keep buying to sell into you. Yes this should make you hesitant and weary. Does this mean you shouldn't buy? Not necessarily. Here are two scenarios to help you squeeze some juice out of this rock.
Bears are still in Control
A fresh new aggressive seller stepped in at $292.44. This is going to put some pressure on the high demand zone. May 25th, we sunk deep into the zone before recovering. This was an extremely hot reaction with passive buyers sitting at 271.30
11th of June aggressive buyers stepped in, but got crushed.
27th of June aggressive buyers stepped in, but as soon as they hit the real liquidity from the big seller (Tues jul 1st), you saw a huge follow through and more aggressive selling. This tells us that bears are still in control and I foresee two scenarios.
Green Scenario
Test off the liquidity at $271. Get a hot reaction from the buyers, putting tons of pressure on the new seller, ripping their faces and blasting off into never land.
Long
Entry 271
Stop 260
Partial TP 323
Final TP 425
Red Scenario
We test the New aggresor before the high demand Liquidity, get sold into heavily, and put so much pressure on buyers it blows pass the high demand and gets to the most probable bounce location at top of Extreme Demand $207.
Short
Entry 292
Stop 302.50
Partial TP 271
Final TP 207
Bonus Scenario
That 207 Area should attract massive buyers, even with the seller as heavy as he is. I think if there is going to be any big bounce strait off the cuff, this will be the spot.
Entry 207
Stop 185
TP 425 (play the long long game here)
Long Term
If you did your DD and you want a good price. The following will be measured by your personal sentiment.
Aggressive = 271
Fair price = 240
"Steal" = 191 - 207
That's all for UNH, Remember to follow/Boost.
Stay tuned for more market analysis. Happy Trading!
@thecafetrader
A Legends Continuation. BTCHello I am the Cafe Trader.
Today we are going to look at a trade inspired by the Legendary Trader and Scalper Al Brooks.
If you are not familiar with him I recommend having a strong foundation with price action before giving him a look.
It's no secret that BTC is at levels many thought it would never reach, and yet many others are convinced of 5 - 10x more from this run alone. It can be crushing to feel like you missed out on the move, so instead of getting FOMO, I've detailed a guide to help you in the short or the long term.
Long Term
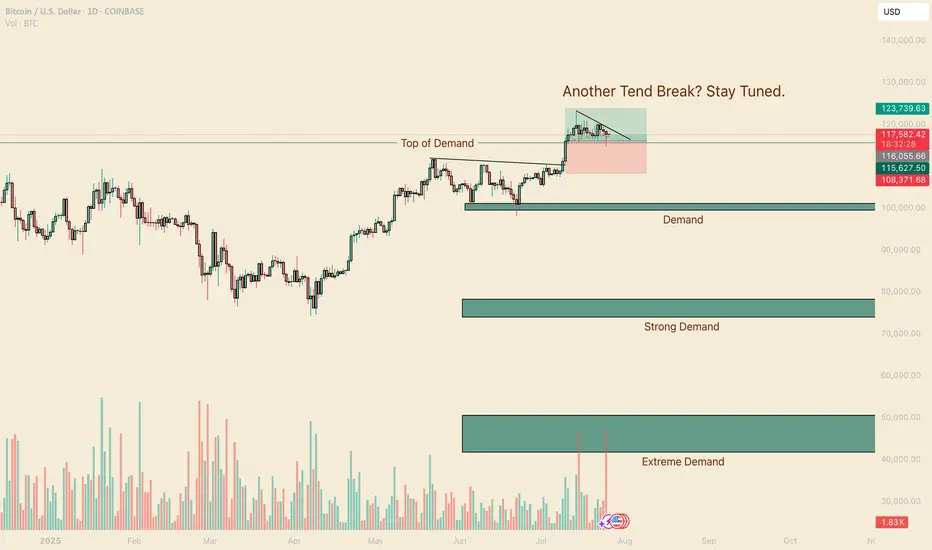
As of right now you are looking at 4 different levels of demand. It is up to you to measure your conviction, understanding why you want to invest, and how much you are willing to risk. Recognize that Many Big hedge funds have been hesitant with accumulating hoards of Crypto do to its volatile nature, considering it too risky.
So with this in mind, I have given you 4 levels to add BTC to your long term depending on your personal conviction.
Hyper Aggressive = Top of Demand $115,500 (willing to risk 50%)
Aggressive = Demand $99,500-101,250 (willing to risk 40%)
Fair Price = Strong Demand $74,000 - 78,000 (willing to risk 25%)
Steal = Extreme Demand $42,000 - 50,800 (willing to risk 10%)
Thinking about how much you are willing to risk will help you level out your Fear of missing this move, and get pricing that meets your personal demand.
Short Term
My fellow traders, this is a nugget (inspired) from Al Brooks. The "Two Bar Trend Break" .
In a strong trend (not in a range), When you get a trend break (I like to go top of wick to top of wick for this trade), if the second bar doesn't have a huge topping tail, but closes near the top, you can enter this trade.
Here is a trade that happened this month That hasn't filled yet (it got close).
Entry At the close of the second green candle $116,000.
Measure the bottom of the First candle that broke (called the Signal candle) to the top of the second bar that broke (called the Entery Candle). If you take that measurement, and add it to your take profit, you will have a 1R Scalp (1 measure of risk to 1 measure of reward).
This isn't a true scalp, typically they should be in the same bar or next bar, but this follows similar principles.
That's all for BTC, stay tuned for more analysis as we go over Ethereum, XRP, and one more of your choosing.
Happy Trading!
@thecafetrader
Google Buyers Entered Seller Territory.Hello, I am the Cafe Trader.
To finish off our series of the MAG 7 we have GOOGL up next.
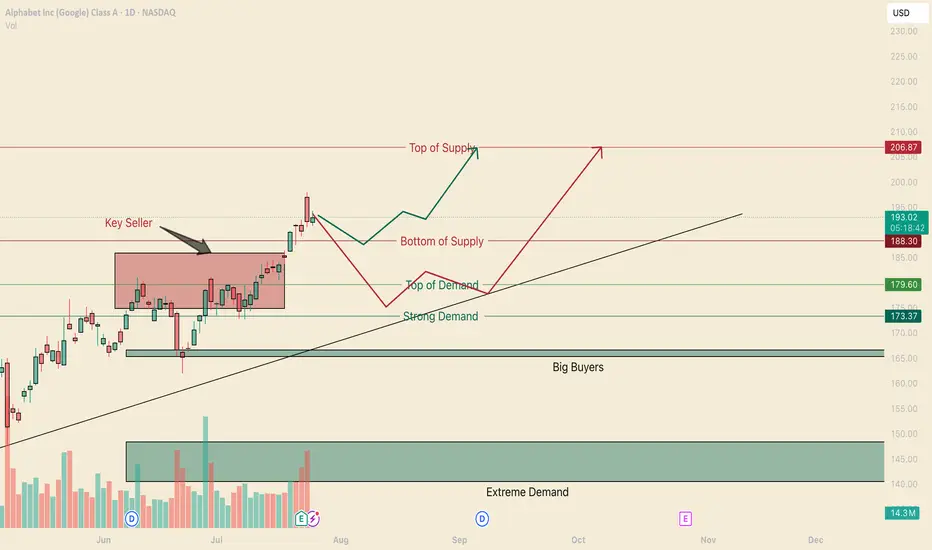
If you have been keeping up, I will offer insight into Long term and short term interest. Google has taken out a key sellers on July 21st, and also closed inside the supply zone. This is very bullish, bulls have not got much pushback from the bears, suggesting this could test the highs again, and prime itself for a breakout.
Long term price guide helps you align a buy area with your conviction. I will update the price as of friday's close (today)
Long Term
Aggressive: $179 - If we close today above the bottom of supply line, then I would suggest this aggressive price adjust to 187.50
Fair Sentiment $166 - 173 - Between the big buyers and the strong demand. Also having the trend to support adds a 3rd strength.
Extreme Deal $140-148 - If you can catch a deal here, best to snatch it up. Alot of Big money wil be doing the same.
Short Term
weakness in the supply area is suggesting a run to the top. Trying ot get in here can be tricky. Since today is friday, the close is extremely important to see how our next week will be framed. So here I have 2 Bullish scenarios to help you find opportunity for GOOGL.
Green Scenario
Yes its possible it will run strait up into the top of supply, as a trader, you don't want to be that buyer just yet. I wouldn't personally feel great about trading the green line scenario without seeing a real buyer step into the market. So if we can Find a real buyer, we will play off of them and rirde to the top.
No entry or price targets on this one yet.
Red Scenario
This scenario has a real buyer, and personally I think is a safer trade to take (as of right now). With this squeeze that's happening, there is a good chance at some point there will be buyers getting exhausted and shorts getting a grip on this. This is why I would not buy "top of demand" but would look to get close as I could to the strong demand. and then a ride back to the "Top of Supply"
Entry: 175
Stop: 170
Partial Profit: (when the sellers step in, thats our first TP)
Target: 206
That's a wrap on our MAG 7 series, Happy Trading and we will see you next time.
Next week we are going to chart out Crypto, if you have any specific suggestions you want to see me chart, comment below.
@thecafetrader
Gold Breakout Failed – Bearish Reversal in Play?Last week was both interesting and revealing for Gold.
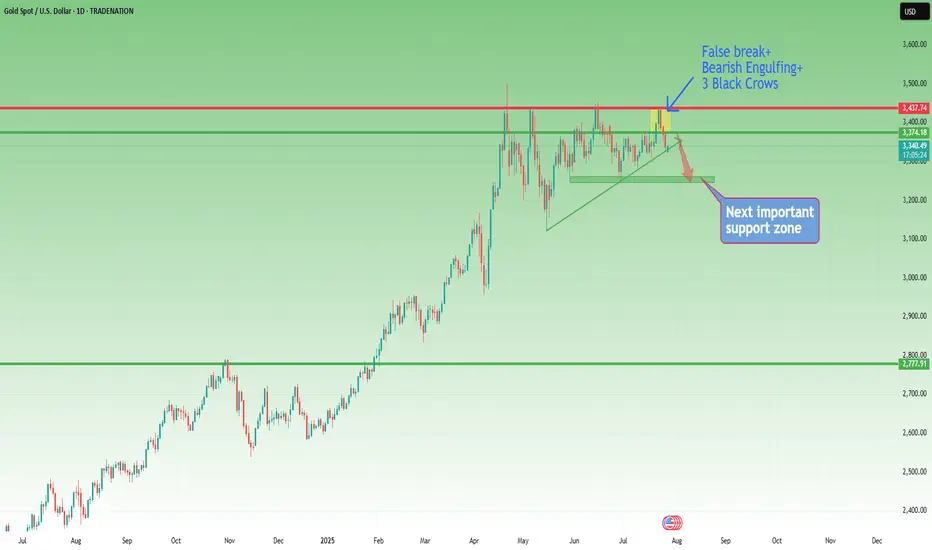
After breaking above the key $3375 resistance—which also marked the upper boundary of a large triangle—price quickly accelerated higher, reaching the $3440 resistance zone.
However, instead of a bullish continuation, we witnessed a false breakout and sharp reversal. What initially looked like a healthy pullback turned into a full bearish rejection by week’s end.
________________________________________
📉 Current Technical Picture:
• On the daily chart, we now see a clear Three Black Crows formation
• On the weekly chart, a strong bearish Pin Bar confirms rejection
• And if we add the failed breakout above 3375, the bias tilts decisively bearish
________________________________________
📌 Key Zones and Trading Plan:
• Gold is currently bouncing from the ascending trendline zone, which is natural after dropping more than 1,000 pips in just 3 days
• The $3375–3380 area has regained importance as a key resistance zone, and that’s where I’ll be looking to sell rallies
• A bullish invalidation would only come if price manages to stabilize above $3400
Until then, this remains a bear-dominated market, and a drop below $3300 is on the table.
________________________________________
🧭 Support levels to watch:
• First support: $3280
• Major support: $3250 zone
________________________________________
📉 Conclusion:
The failed breakout, bearish candle formations, and current price structure all point to a market that's shifting in favor of sellers.
I’m looking to sell spikes into resistance, with a clear invalidation above $3400.
Disclosure: I am part of TradeNation's Influencer program and receive a monthly fee for using their TradingView charts in my analyses and educational articles.
USD/JPY(20250728)Today's AnalysisMarket news:
Trump announced that the US and Europe reached a trade agreement: 15% tariffs on the EU, $600 billion in investment in the US, zero tariffs on the US by EU countries, the EU will purchase US military equipment, and will purchase US energy products worth $750 billion. However, the US and Europe have different opinions on whether the 15% tariff agreement covers medicines and steel and aluminum. Von der Leyen: 15% tariff rate is the best result that the European Commission can achieve.
US Secretary of Commerce: The deadline for tariff increase on August 1 will not be extended. The United States will determine the tariff policy on chips within two weeks.
Technical analysis:
Today's buying and selling boundaries:
147.47
Support and resistance levels:
148.58
148.17
147.90
147.04
146.77
146.35
Trading strategy:
If the price breaks through 147.90, consider buying, the first target price is 148.17
If the price breaks through 147.47, consider selling, the first target price is 147.04

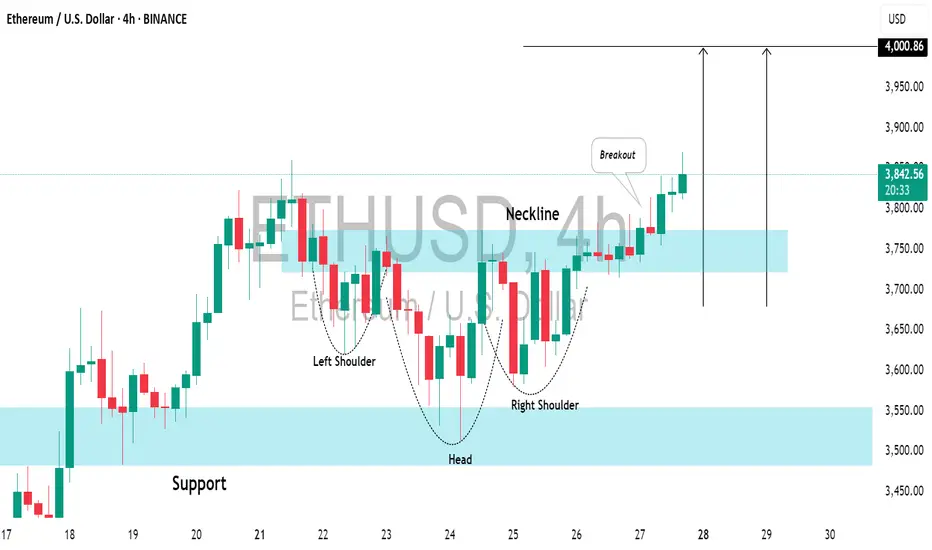
ETHEREUM (ETHUSD): Bullish Move After BreakoutIt looks like Ethereum has completed its bearish correctional movement.
Analyzing the price movement on a 4H timeframe, the market formed an inverted head and shoulders pattern on a retest of a horizontal support.
The neckline of this pattern is broken, which suggests a strong likelihood of a bullish trend resuming, with the price expected to reach the psychological level of 4000 soon.
GER40 | Consolidation Range 24,600 – 24,000 With Breakout TargetGER40 is consolidating within a clear range between 24,600 resistance and 24,000 support. The lower boundary (24,000) aligns with the 61.8% Fibonacci retracement from the 23,050 → 24,600 impulse leg. A confirmed breakout above the range projects a measured move target of 25,197.2, which is derived from the 600-point height of the range between 24,000 and 24,600.
Support at: 24,000.00 / 23,678.5 / 23,050.00 🔽
Resistance at: 24,600.00 🔼
Range Target: 25,197.2 🎯
🔎 Bias:
🔼 Bullish: Clean break and hold above 24,600 confirms range breakout with target at 25,197.2.
🔽 Bearish: Break below 24,000 brings 23,678.5 and 23,050 into view.
📛 Disclaimer: This is not financial advice. Trade at your own risk.

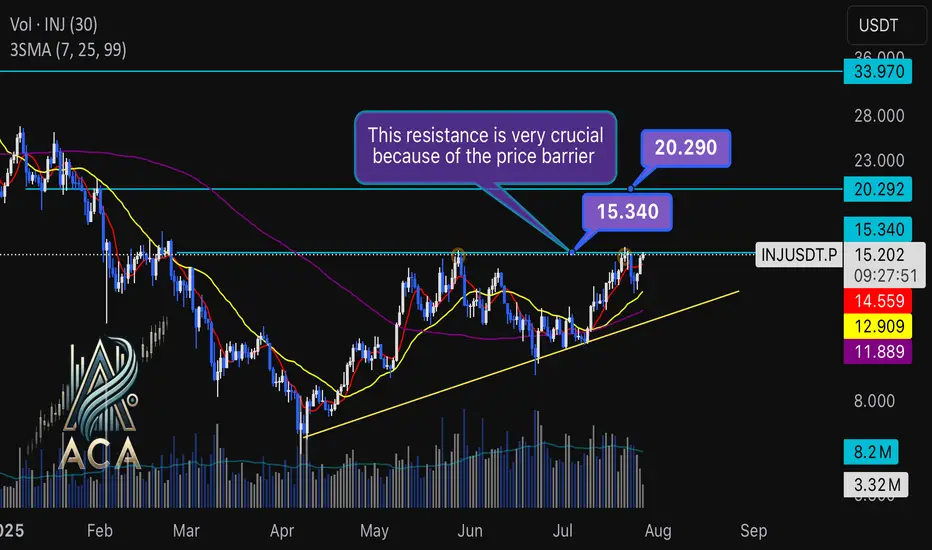
INJUSDT Daily Chart Analysis | Uptrend Brewing at Crucial LevelINJUSDT Daily Chart Analysis | Uptrend Brewing at Crucial Resistance
🔍 Let’s break down the INJ/USDT setup, examining its technical structure and mapping out key opportunities as it gears up for a decisive move.
⏳ Daily Overview
The INJUSDT pair is forming a solid bullish structure, supported by a clear ascending triangle pattern on the daily timeframe. Notably, the 3SMA (7, 25, 99) are crossing to the upside, signaling the early stage of a potential upward trend. This momentum is reinforced by the ascending triangle’s rising trendline, showing steady accumulation and higher lows.
🔺 Bullish Scenario:
Price is consolidating just below the critical resistance at $15.340—a key zone highlighted by multiple rejections in recent months. A confirmed breakout above this level, especially if backed by a surge in volume, would not only trigger a triangle breakout but also complete the weekly candle formation as a bullish hammer, strengthening the bullish case.
If this breakout sustains, short-term targets line up at $20.290, with the long-term roadmap pointing toward $33.970.
📊 Key Highlights:
- 3SMA (7, 25, 99) MA cross signals the beginning of an upward trend.
- Daily ascending triangle points to persistent bullish pressure.
- $15.340 remains a crucial resistance; price has tested and failed here twice before.
- Breakout confirmation (with volume) could ignite a rapid move to $20.290.
- Failure to break may result in another retest of the triangle’s trendline support.
🚨 Conclusion:
All eyes are on the $15.340 resistance. Wait for clear daily close and volume confirmation before entering. A successful breakout aligns with a bullish weekly hammer and could trigger the next phase higher. Beware of fakeouts, as rejection at resistance could send INJUSDT to retest lower trendline zones.
Stay sharp and plan your entries wisely!
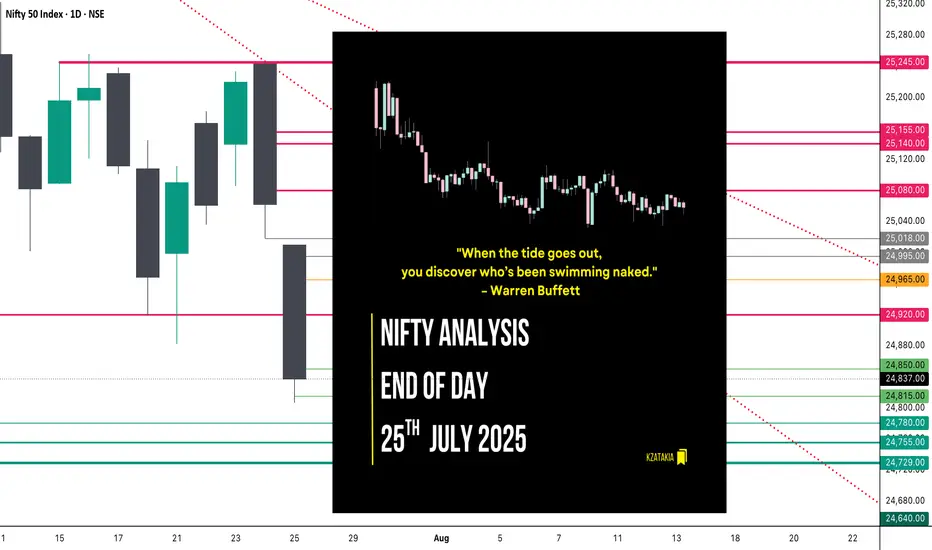
Nifty Analysis EOD – July 25, 2025 – Friday🟢 Nifty Analysis EOD – July 25, 2025 – Friday 🔴
"When the tide goes out, you discover who’s been swimming naked." – Warren Buffett
Nifty GapDowns Below Key Support and Slips Further
The market opened with a sharp GapDown, breaching the previous day's low and instantly shedding 150 points within the first hour. Nifty attempted to find footing near the crucial 21st July low zone of 24,850–24,880, but the support gave way, slipping an additional 50 points.
The day mostly drifted around these lower levels with bearish dominance. Though bulls made an effort to recover late in the session, it lacked strength. The index finally settled at 24,837, decisively closing below the 21st July low — signalling a deeper structural breakdown.
📉 Trend & Zone Update
Resistance Zone Shifted To: 25,144 ~ 25,155
Support Zone Shifted To: 24,729 ~ 24,755
📊 What If Plans – 28th July Outlook
🅰️ Plan A (Contra Long Setup)
If market opens inside the previous day range and finds support at 24,815 ~ 24,850
Then potential targets are 24,920, 24,965, and 25,020
🅱️ Plan B (Trend is Friend – Short Continuation)
If market opens inside range and faces resistance around 24,965 ~ 24,995
Then aim for 24,850, 24,815, 24,780, and 24,730
⏸️ On-the-Go Plan
If market Gaps Up/Down outside previous day’s range
Then wait for the Initial Balance (IB) to form and act based on structure and S/R levels.
🕯 Daily Time Frame Chart with Intraday Levels
🕯 Daily Candle Breakdown
Open: 25,010.35
High: 25,010.35
Low: 24,806.35
Close: 24,837.00
Candle Structure
Body: Strong red candle (−173.35 pts)
Upper Wick: None (open = high)
Lower Wick: 30.65 pts
Interpretation:
A textbook bearish Marubozu — shows sellers had control throughout.
Bears stepped in immediately from open, preventing any bullish response.
Minimal lower wick implies limited buyer defense even at the session low.
Key Insight:
Bears are in command; bulls must reclaim 25,000+ quickly to prevent further downside.
If 24,800–24,820 breaks, eyes shift to 24,700–24,750 zone next.
🛡 5 Min Intraday Chart
⚔️ Gladiator Strategy Update
ATR: 192.95
IB Range: 87.4 → Medium
Market Structure: Imbalanced
Trades Triggered:
🕙 10:10 AM – Short Entry → 🎯 Target Hit (1:2.4 R:R)
🧭 Support & Resistance Levels
Resistance Zones
24,920
24,965
24,995 ~ 25,018
25,080
25,140 ~ 25,155
Support Zones
24,780
24,755 ~ 24,729
24,640
📌 Final Thoughts
When strong candles appear back-to-back with no meaningful recovery in between, it’s not just a correction — it’s a statement. In this market phase, reacting to price structure rather than assumptions will keep you on the right side. Stay nimble, stay prepared.
✏️ Disclaimer
This is just my personal viewpoint. Always consult your financial advisor before taking any action.
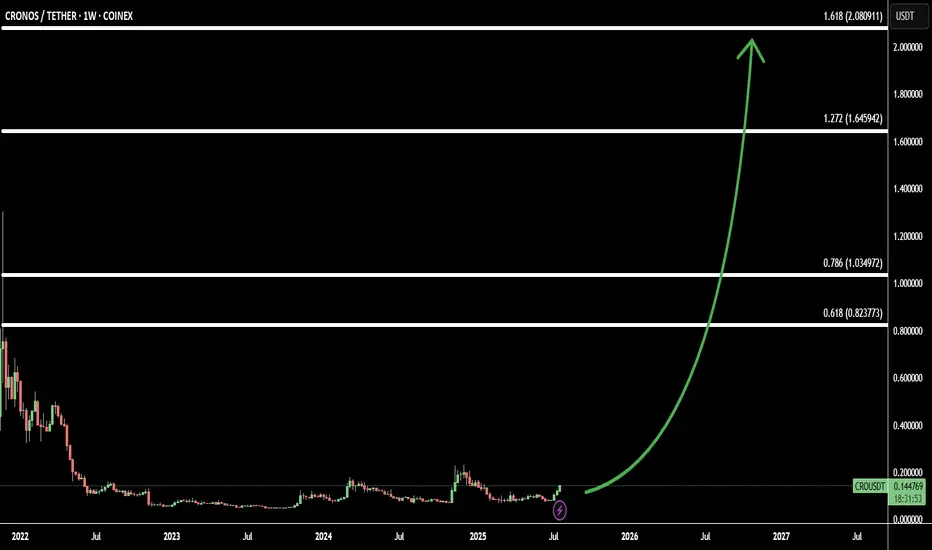
CRO Signals Big Move: 3 Soldiers Pattern + 4 Fibonacci Target(CRO/USDT) is showing a strong bullish reversal on the chart, forming the classic Three White Soldiers pattern — a powerful signal of trend reversal and sustained momentum.
This move comes after a prolonged consolidation phase, making CRO an ideal low-capital investment with the potential for a high reward.
Using Fibonacci extensions, I’ve identified 4 bullish targets:
Target 1: 0.618 Fib – 0.82 - confirmation of trend shift
Target 2: 0.786 Fib – 1.03 - key resistance zone
Target 3: 1.272 Fib – 1.64 - major breakout level
Target 4: 1.618 Fib – 2.08 - full bullish potential zone
With technicals and sentiment aligning, CRO may be gearing up for a big move, and current prices offer one of the best risk-reward opportunities in the market.
SEI Breakout Setup: Buy the Dip Before the Next Leg UpAfter the low around 0.13 in April, SEI started to recover, and although the first attempt to reclaim the 0.25–0.26 zone failed in mid-May, that key area—a former support from last year—was finally broken at the end of June.
Now, this previous resistance has turned into support, and even though gains have so far been capped by the falling trendline, price is consolidating above support – which could be a sign of bullish pressure building.
If we get a clean break above this descending trendline, momentum could accelerate, opening the way for a push toward the 0.75 resistance.
This is exactly the scenario I’m working with.
I'm looking to buy dips, with an ideal entry around 0.30, while keeping in mind that a move below 0.25 would invalidate the setup.
✅ Risk-reward? With a stop below 0.25, this setup offers a 1:4 R:R, and even a realistic chance at a 2x trade, which would be quite reasonable under current market conditions.

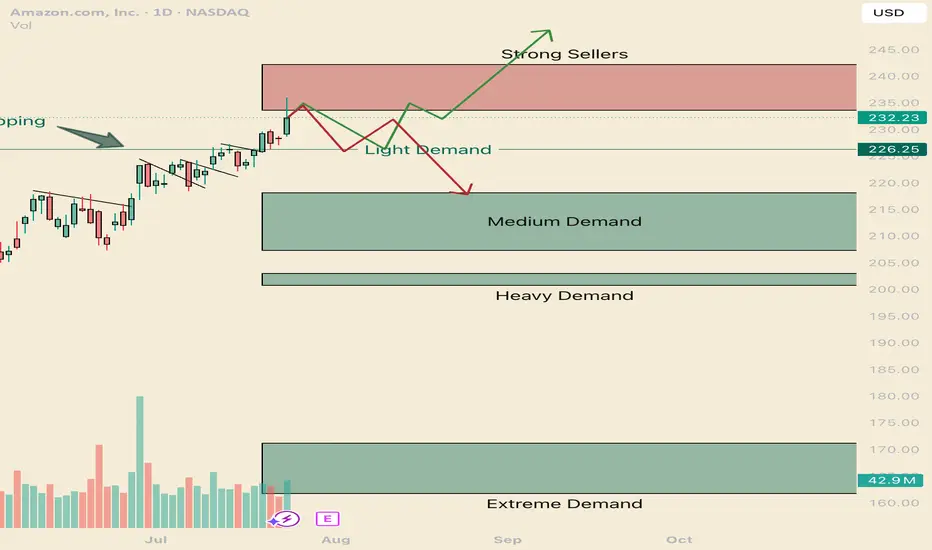
How to navigate the Amazonian Squeeze. AMZNHello I am the Cafe Trader.
This week has been a deep dive on the MAG 7 and today AMZN is up next.
We are going to look at long term and short term opportunities.
We are near the All Time Highs, with one final Seller to get through before making the break.
Today we tested to see if those sellers are there still (and indeed they are). Today was a key reaction, I'm going to give you the keys to profit.
Long Term
It's important to consider how aggressive you would like to be with pricing. This list of prices should align with your conviction with Amazon.
Aggressive: $226 is where the current aggressive players are sitting. They are going to look to buy again at this level, although they should be the weakest of the buyers.
Fair sentiment: 203-210 is where stronger buyers are sitting. I think this price is still realistic to get to.
Conservative: 161 - 171 Is a great price, buyers have shown to buy this with extreme demand. Amazon at this price is a fantastic purchase, if you are holding from here or lower, congradulations.
Short term
Testing the supply and rejecting tells us that sellers are still really active in this zone. We will see how tomorrow closes, if we do not close in the supply zone, there is a good chance that net week will have some bearish winds and a great chance of testing the light demand at 226. this brings us to the two trading ideas.
1 Green line
I think we will test those sellers by next week. and i think its very possible that we break trend and touch the light demand line. If its a slow drag down to the light demand, Shorts will have to cover as soon as any real demand shows up (Light Demand Line).
Entry 226.50
Stop 221.50
Partial TP 233, or you can hold for a test of the highs (242 would suffice)
2 Red Line
If we get a Hot reaction from the supply zone, or if we close below 233.50 tomorrow, Look for a retest and short entry off the supply zone. If the reaction starts to be slow (more than 5 days of red bars) it's likely this will turn into the green scenario.
Entry 233.5
Stop 237
Partial TP 226.5
Full TP 218
That's all for AMZN Follow for more!
Also comment if you would like me to chart a stock you are considering.
@thecafetrader
Real Sellers Vs Passive Sellers AMZNHello I am the Cafe Trader.
I was fortunate enough to get an editors pick, and I wanted to expound on how I came to those conclusions.
In this video we talk about passive sellers vs aggressive sellers and how we identify them. Also why it's important to identify these players in the market. This will help give you depth and help you get really good pricing in the markets.
Hope you enjoy the voiceover, Feel free to take a look at the previous article that this was pulled from on my profile.
Please share a boost if you enojoyed, and consider following for more.
Until next time! Happy Trading!!
@thecafetrader

Xauusd (GOLD)Price need to do some breakout resistance before it can go up. I still bias for long until price tell me that i need to against my analysis.
-4thur
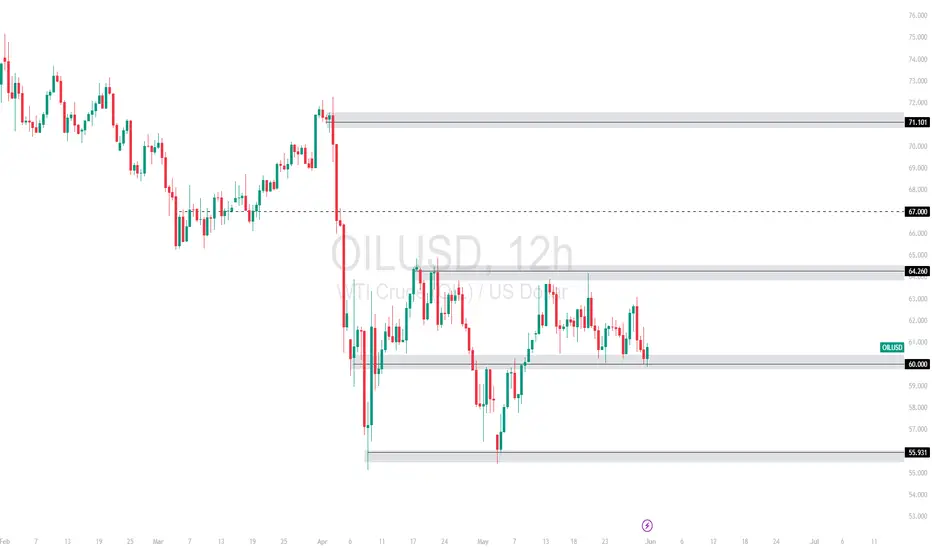
OILUSD Range Between 60–64.26 – Will Support Hold or Break?WTI Crude has been in a sideways range after the sharp drop in early April. Price recently tested resistance at 64.260 but failed to break higher, pulling back into the 60.000 support zone. This level has held multiple times, forming a key pivot.
Support at: 60.000 🔽, 55.931 🔽
Resistance at: 64.260 🔼, 67.000 🔼, 71.101 🔼
🔎 Bias:
🔼 Bullish: A strong rejection from the 60.000 zone followed by a breakout above 64.260.
🔽 Bearish: A daily/12H close below 60.000 opens the path to retest 55.931, and potentially lower.
📛 Disclaimer: This is not financial advice. Trade at your own risk.
Long trade tradingview.sweetlogin.com
🟢 Buyside Trade
Pair: LINKUSD
Date: Saturday, 5th July 2025
Time: 8:00 PM
Session: Tokyo Session PM
Time Frame: 4Hr TF Entry
🔢 Trade Metrics
Entry Price: 13.161
Take Profit (TP): 25.814 (+96.14%)
Stop Loss (SL): 12.984 (−1.34%)
Risk-Reward Ratio: 70.32: 1
📈 Chart Analysis
Structure: Price broke the previous consolidation zone and retested key support levels near the 13.16 area before launching upward.
Indicators:
200 WMA (Yellow) & 50 EMA (Blue) both support continuation.
Break of market structure confirmed prior resistance as new support.

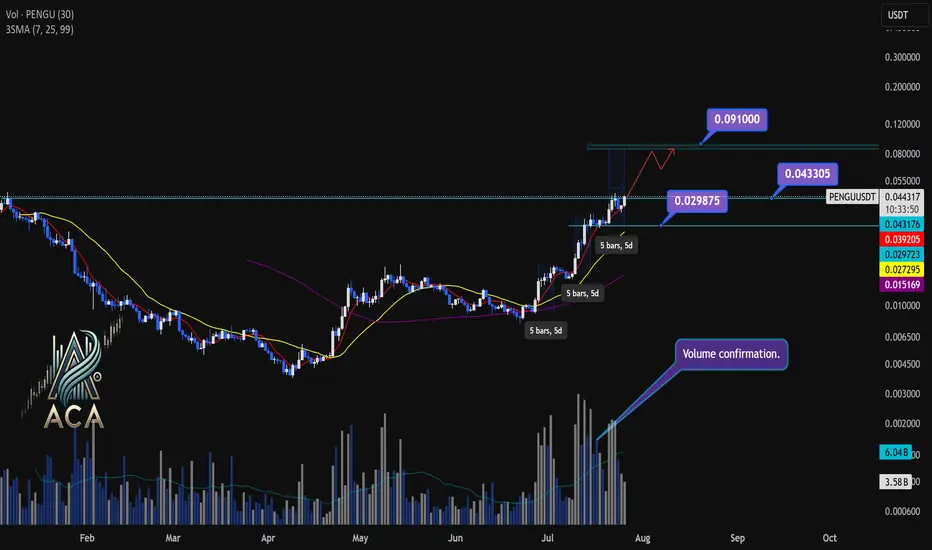
PENGUUSDT Daily Chart Analysis | Powerful Uptrend in PlayPENGUUSDT Daily Chart Analysis | Powerful Uptrend in Play
🔍 Let’s dissect the current PENGU/USDT daily chart, highlighting the unmistakable bullish structure and mapping potential targets as this trend matures.
⏳ Daily Overview
PENGUUSDT is riding a strong upward trend, with all three daily SMAs (7, 25, and 99) lined up in bullish sequence—clear confirmation of momentum. Recent rallies are also supported by textbook volume behavior: volume consistently surges during price climbs and tapers off during minor corrections, reflecting the classic signature of a robust uptrend.
🔺 Bullish Setup and Price Targets:
The next major upside target sits at $0.0910, almost 85% above the current level. For bulls, a daily candle closing above $0.043305 with convincing volume should act as a confirmation for fresh highs—though, as it’s Saturday, even moderate volume could suffice for a valid breakout.
📊 Key Highlights:
- All SMAs (7, 25, 99) confirming the uptrend on daily timeframe.
- Volume spikes on upward moves, fades on corrections—classic bullish confirmation.
- Historical trend velocity: Each time a new high (HH) is set, it’s preceded by around 5 days of advance; first leg was +83%, second +124%, the next (projected) is +160%, aligning with the $0.0910 target.
- Corrections: After each rally, pullbacks have measured about 15% and 20%. Should the first target be reached, expect a correction up to 25%—a healthy reset for further continuation.
🚨 Conclusion:
With all signals aligned—moving averages, volume dynamics, and historic price structure—the path remains bullish. A decisive close above $0.043305, especially with solid volume, could be the catalyst for the next major leg higher. As always, monitor for typical correction ranges post-breakout in line with the prior trend.
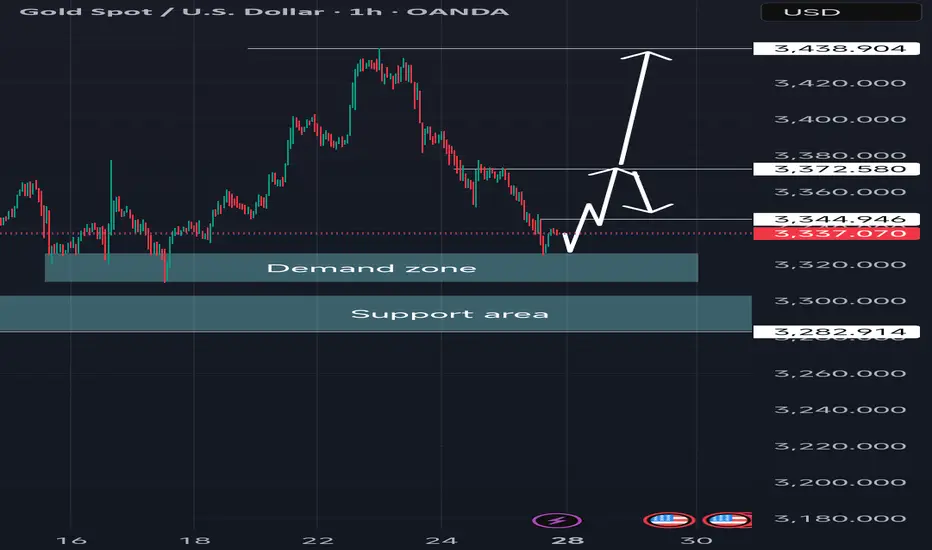
XAUUSD Weekly July 2025 28 July - 1 Aug🧭 MARKET STRUCTURE OVERVIEW – H4
1. Major Trend: Bullish
The overall trend remains bullish, with multiple Bullish Breaks of Structure (BOS) recorded during the upward move since early July.
A strong CHoCH followed by a solid Bullish BOS on H4 after the early July breakout confirms strong buyer intent.
---
2. Bearish BOS?
You're absolutely right — there are no significant Bearish BOS on H4 after the recent rally.
The current downward movement appears to be a retracement, not a structural break. No confirmation of bearish market structure yet.
---
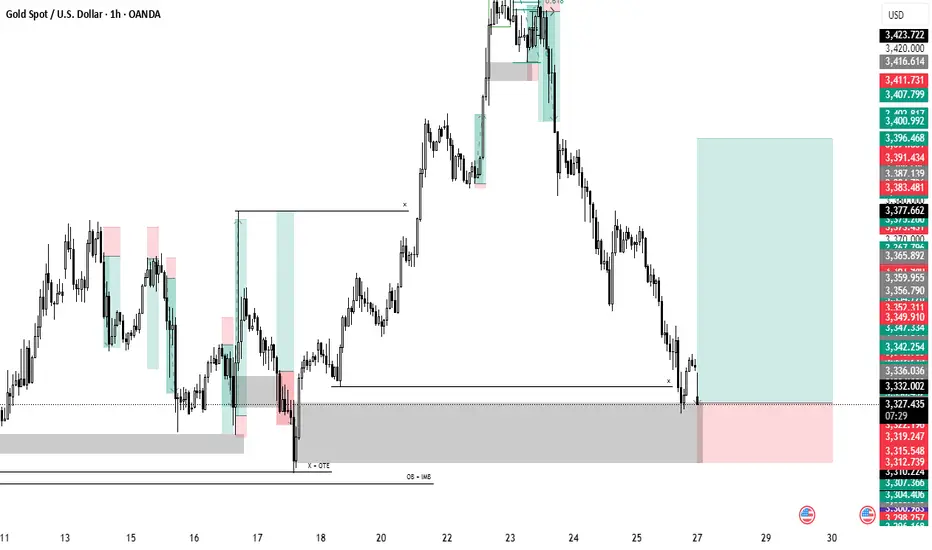
🔵 CURRENT ZONE: H4 OB BUY (Active POI)
Price is currently rejecting from the H4 OB BUY zone, which aligns with the ascending trendline confluence.
If the H4 candle closes with a strong rejection (e.g. bullish engulfing or pinbar), this would confirm a potential buy entry for the next bullish leg.
This OB BUY is the main POI for next week and represents a:
✅ Buy from Discount
✅ Entry in Uptrend Structure
✅ Confluence of OB + POI + Momentum
---
🟥 FVG & TP Structure
1. TP1 / Scaling Zone:
H4 Fair Value Gap (FVG) around 3368–3380 can serve as the first target.
2. Final TP / ATH Zone:
Upper FVG (3420+) near a previous POI could act as the final target or a potential ATH test zone if buyers push higher.
---
🚀 TRADING PLAN – NEXT WEEK (Still Valid)
✅ Structure is still bullish
✅ Current drop is a retracement to OB BUY
✅ No valid Bearish BOS detected
✅ Current POI + OB BUY zone = prime entry level
---
📌 ENTRY STRATEGY
Entry: Buy within the OB BUY H4 zone (around 3320–3340)
Confirmation: Wait for a strong H4 rejection candle
Stop Loss: Below OB H4 (~3310, or adjust to lower OB zone)
TP1: 3368–3380 (FVG zone)
TP2: 3420+ (Upper FVG / POI / ATH zone)
---
⚠️ Additional Notes
If price breaks below OB BUY H4 with a strong bearish candle, this setup becomes invalid.
Then, we shift focus to lower OB zones (3280 / 3250).
Be cautious of high-impact news (FOMC/NFP?) – price may spike before confirming direction.
---
🔥 FINAL VERDICT:
✅ Plan is highly valid
❌ No strong bearish structure in place
🔒 Current POI is a key sniper entry zone

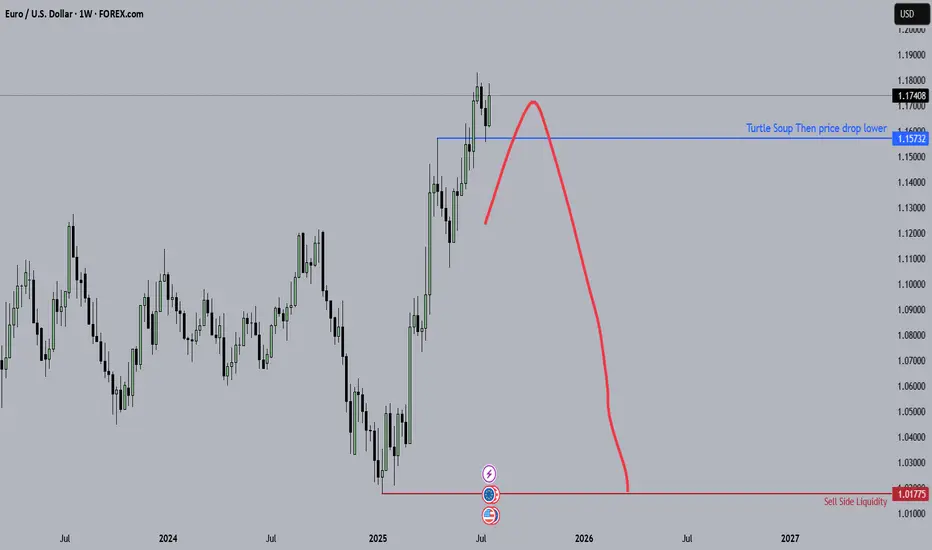
Fiber (EU) This is my Analysis for the Eurousd, Fiber has been in down trend for years now and comparing the US Central bank interest rates with the European Central bank it shows that the Dollar is Stronger compared to the Euro, Blending the Fundamentals with Technical Analysis.