Bitcoin AnalysisWe have an order block in 1Hour TF, price can retest this before bullish continuation. If it breaks below bearish momentum continues.
Candlestick Analysis
Wait for 3330 to buy the bottom and reduce unnecessary operation#XAUUSD
We have made good profits from short selling yesterday. Currently, gold has fallen to 3350📎. The 4HMACD death cross has increased in volume and is expected to continue to decline. Consider going long near 3330📈. I don’t think it is prudent to bottom out at 3340. Move forward steadily on Friday and reduce unnecessary operations⚖️.
🚀 BUY 3335-3330
🚀 TP 3345-3362
Be alert to new lows, pay attention to 3350 and go long at 3330📰 News information:
1. Tariff issues
2. Next week's NFP data
📈 Technical Analysis:
Last night, gold rebounded to only around 3377 before starting to fall back. Our judgment that the current rebound is weak is completely correct. 3350 is the support point of the bottoming out and rebounding to nearly $20 last night. Whether the European session can go down to 3350 will determine the trend of gold.
From the daily chart, the daily line has fallen for two consecutive days, suggesting that the price may continue to fall today. At present, we need to pay attention to this week's starting point of 3344-3345, and then the 3330 line below. The extreme decline is 3320-3310. At the same time, the narrowing of the daily Bollinger Bands is also paving the way for next week's NFP data.
From the 4H chart, the current MACD indicator crosses and increases in volume, and the middle track of the Bollinger Bands and SMA30 basically overlap near 3388. As for the hourly chart, the upper pressure is mainly concentrated near 3375-3377, which is also the high point of the rebound last night. If gold rebounds directly upward and encounters pressure and resistance at 3375-3385 for the first time, you can consider shorting and strictly implement stop loss.
Overall, if the current market falls to 3350-3345 for the first time and gets effective support, you can consider going long with a light position, defend 3340, and look to 3356-3362; if the decline is strong and continues to fall below 3350, the best stable long point for the day is 3330-3320, defend 3310, and earn $10-20 to leave the market.
🎯 Trading Points:
BUY 3350-3345
TP 3356-3362
BUY 3330-3320
TP 3345-3360
In addition to investment, life also includes poetry, distant places, and Allen. Facing the market is actually facing yourself, correcting your shortcomings, facing your mistakes, and exercising strict self-discipline. I share free trading strategies and analysis ideas every day for reference by brothers. I hope my analysis can help you.
TVC:GOLD PEPPERSTONE:XAUUSD FOREXCOM:XAUUSD FX:XAUUSD OANDA:XAUUSD FXOPEN:XAUUSD
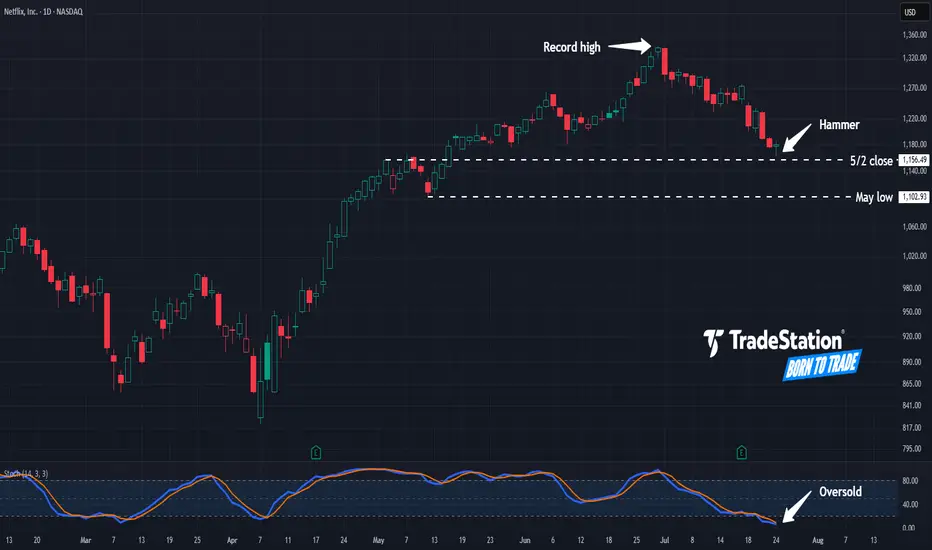
Hammer in NetflixNetflix has pulled back from record highs, and some traders may see potential opportunities in the streaming video giant.
The first pattern on today’s chart is the $1,156.49 level. It was a weekly close on May 2 and near the high the following week. NFLX is now showing signs of potential stabilization near that level. Is new support emerging?
Second, prices hit their lowest level in more than two months yesterday but rebounded. The resulting hammer candlestick pattern may be viewed as a bullish reversal pattern.
Third, stochastics have fallen to oversold territory.
Fourth, if the potential support at $1,156.49 breaks, traders may next eye the May low of $1,102.93.
TradeStation has, for decades, advanced the trading industry, providing access to stocks, options and futures. If you're born to trade, we could be for you. See our Overview for more.
Past performance, whether actual or indicated by historical tests of strategies, is no guarantee of future performance or success. There is a possibility that you may sustain a loss equal to or greater than your entire investment regardless of which asset class you trade (equities, options or futures); therefore, you should not invest or risk money that you cannot afford to lose. Online trading is not suitable for all investors. View the document titled Characteristics and Risks of Standardized Options at www.TradeStation.com . Before trading any asset class, customers must read the relevant risk disclosure statements on www.TradeStation.com . System access and trade placement and execution may be delayed or fail due to market volatility and volume, quote delays, system and software errors, Internet traffic, outages and other factors.
Securities and futures trading is offered to self-directed customers by TradeStation Securities, Inc., a broker-dealer registered with the Securities and Exchange Commission and a futures commission merchant licensed with the Commodity Futures Trading Commission). TradeStation Securities is a member of the Financial Industry Regulatory Authority, the National Futures Association, and a number of exchanges.
Options trading is not suitable for all investors. Your TradeStation Securities’ account application to trade options will be considered and approved or disapproved based on all relevant factors, including your trading experience. See www.TradeStation.com . Visit www.TradeStation.com for full details on the costs and fees associated with options.
Margin trading involves risks, and it is important that you fully understand those risks before trading on margin. The Margin Disclosure Statement outlines many of those risks, including that you can lose more funds than you deposit in your margin account; your brokerage firm can force the sale of securities in your account; your brokerage firm can sell your securities without contacting you; and you are not entitled to an extension of time on a margin call. Review the Margin Disclosure Statement at www.TradeStation.com .
TradeStation Securities, Inc. and TradeStation Technologies, Inc. are each wholly owned subsidiaries of TradeStation Group, Inc., both operating, and providing products and services, under the TradeStation brand and trademark. When applying for, or purchasing, accounts, subscriptions, products and services, it is important that you know which company you will be dealing with. Visit www.TradeStation.com for further important information explaining what this means.
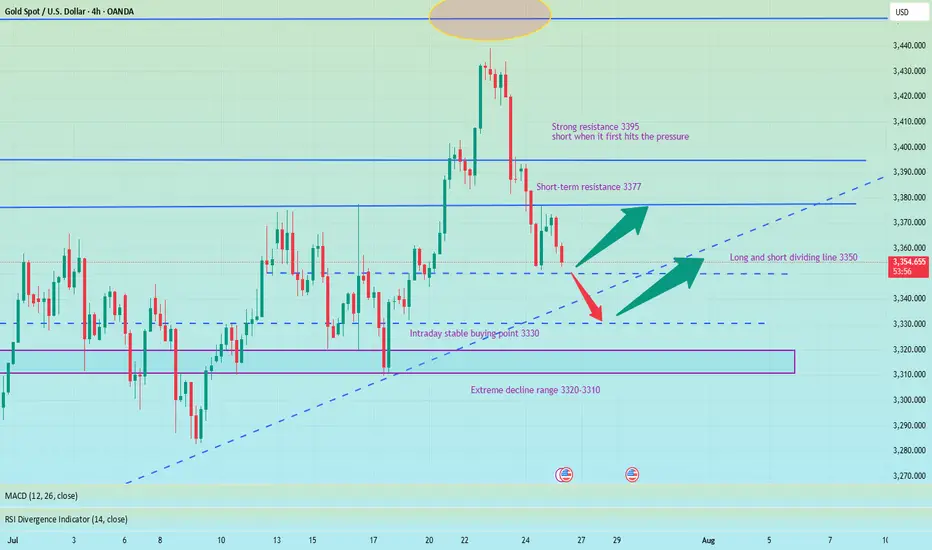
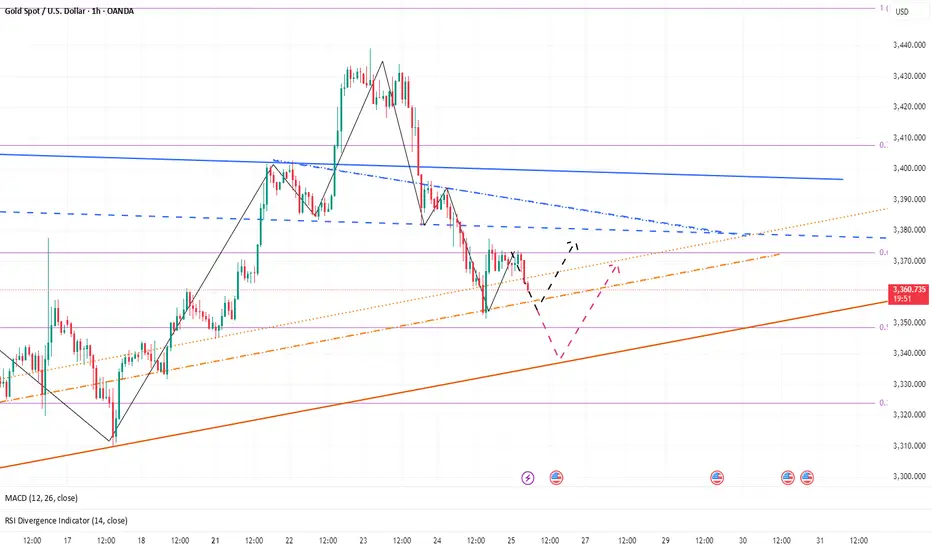
Gold Softens — Watching for a Tactical Long OpportunityYesterday, gold hit a low of around 3351 and then began to rebound. During the rebound, it hit a high of around 3377 and then retreated again. We can clearly see that below 3400, gold is still weak overall, and even failed to reach 3380 during the rebound. In the short term, the 3380-3390 area has become an obvious resistance area.
Yesterday, gold rebounded after dropping to around 3351. Whether the support near 3350 is effective has not been verified again, so from a technical perspective, gold still has the need to retreat again and test the support near 3350. Once gold falls below the area when testing the support near 3350, gold may continue to fall to the 3335-3325 area.
Therefore, in today's trading, the focus is still on shorting gold, supplemented by trying to go long on gold with the support.
1. Consider shorting gold in the 3380-3390 area, TP: 3365-3355;
2. Consider going long gold in the 3355-3345 area, TP: 3365-3375; strictly set SL
3. If the 3355-3345 area is broken, try to go long gold again in 3335-3325, TP: 3360-3370
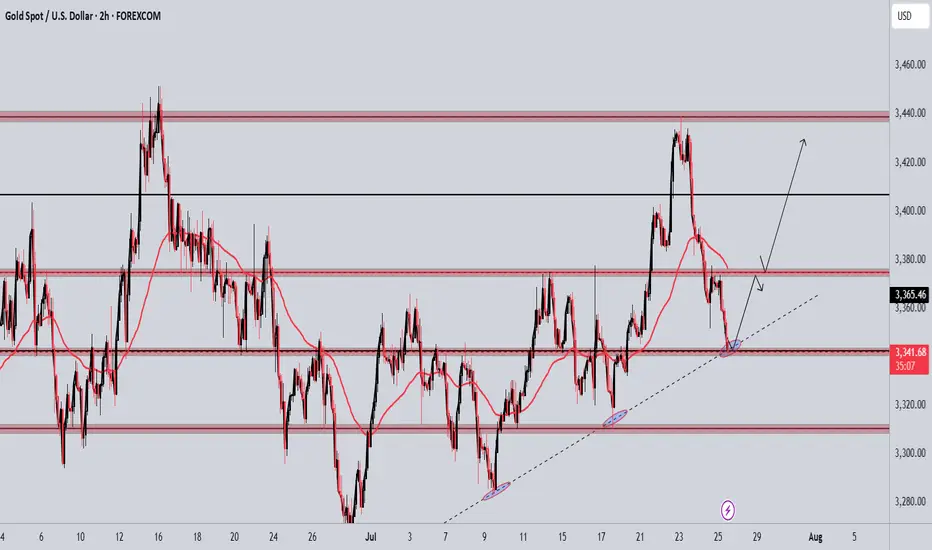
XAU/USD Buy Setup – Trendline + Support ConfluenceReasons for Possible Buy:
Price is sitting on a rising trendline acting as dynamic support.
Strong horizontal support zone previously acted as demand.
Signs of a potential bullish reaction or bounce after extended downside.
Trade Plan:
Looking for bullish confirmation (candle structure or momentum shift) around this level.
If confirmed, potential targets:
First target: $3,365–$3,380
Second target: $3,431
🔹 Invalidation: Clean break below $3,320 zone or trendline support would invalidate the setup.
This is a high-reward area if buyers step in again like they did previously. Patience for confirmation is key before executing.
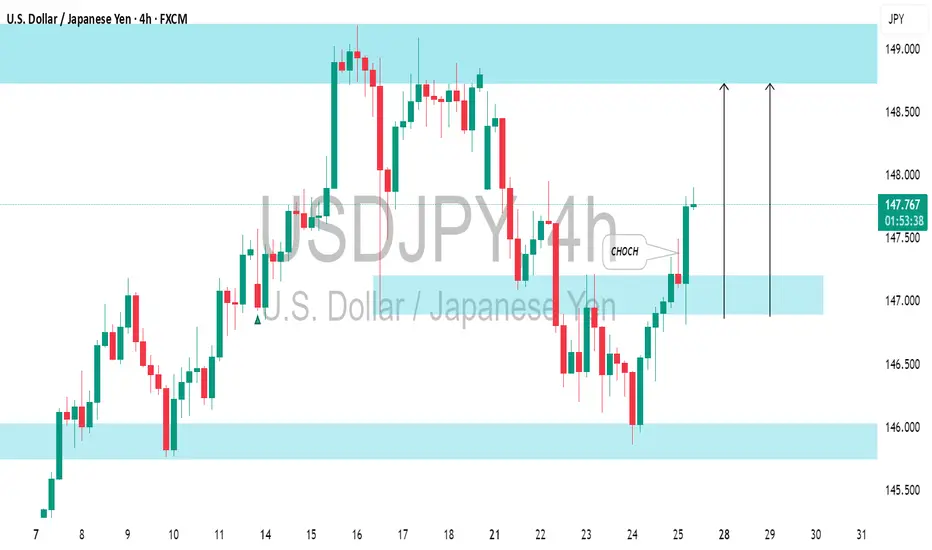
USDJPY: Confirmed CHoCH & Bullish OutlookI spotted a confirmed Change of Character on 📈USDJPY on 4-hour timeframe.
The market, currently in a global bullish trend, has effectively broken through a minor bearish trend and surpassed a key horizontal resistance level.
It is likely to continue rising, with the next resistance at 149.00.
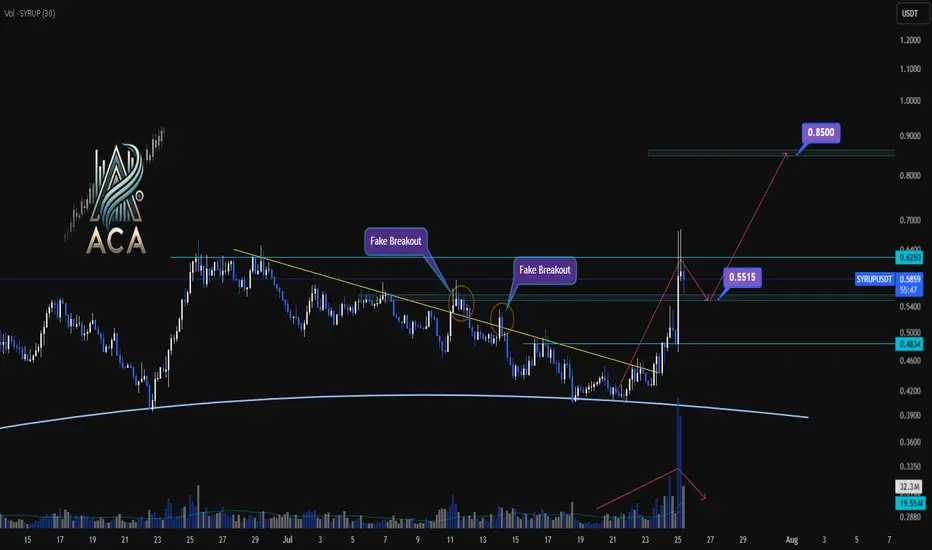
SYRUPUSDT 4H Chart Analysis | Trendline Breakout & Next MovesSYRUPUSDT 4H Chart Analysis | Trendline Breakout & Next Moves
🔍 Let’s break down the latest action on the SYRUP/USDT 4H chart and pinpoint what comes next as trend and momentum cues line up for traders.
⏳ 4-Hour Overview
- The recent breakout above the key trendline was backed by a surge in volume, providing clear momentum confirmation and pushing price toward resistance.
- Price has already reached 1.5R of the initial breakout target, a strong sign the trend is in motion.
- Upon touching the $0.6250 resistance, momentum cooled, with volatility decreasing — a classic consolidation phase after a high-energy move.
🔻 Correction & Structure
- With volume subsiding and momentum slowing post-$0.6250, we’re now expecting a corrective move down toward $0.5515.
- This retracement zone will be critical to watch for higher low formation – a bullish structural signal if supported by volume confirmation.
🔺 Long Setup:
- Should SYRUP reclaim and break above $0.6250 after setting a higher low at $0.5515, and with renewed volume, we could see another strong leg higher.
- The next major resistance sits around $0.85 — this aligns as a logical upside target based on the range extension.
📊 Key Highlights:
- Trendline breakout with sharp volume spike = momentum confirmation.
- 1.5R reached before first deep pullback; structure remains bullish above $0.5515.
- Watch for a higher low and subsequent break of $0.6250 with volume to confirm the next move to $0.85.
🚨 Conclusion:
SYRUP’s chart is at a pivotal juncture: a constructive pullback to $0.5515 could set up the next wave higher if supported by volume. A confirmed breakout above $0.6250 targets $0.85 — stay patient and wait for volume signals at key levels.
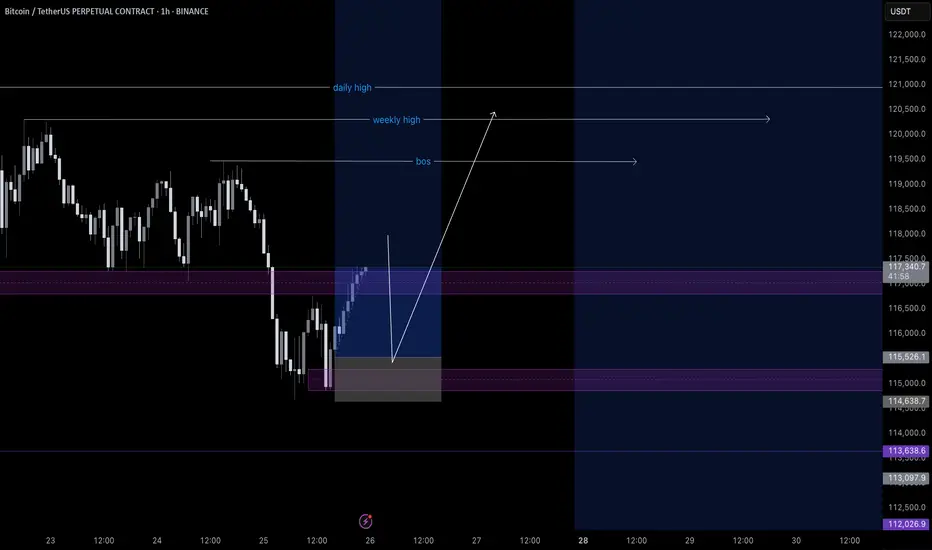
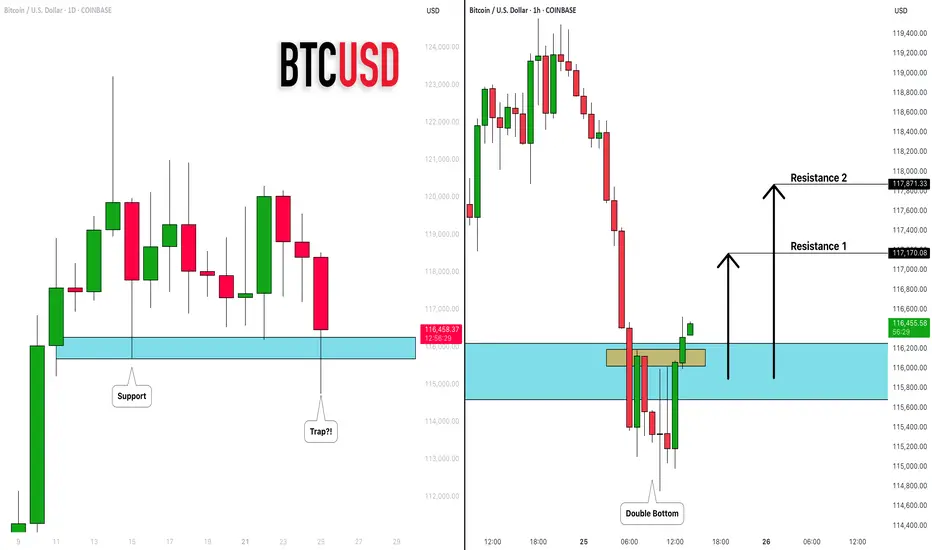
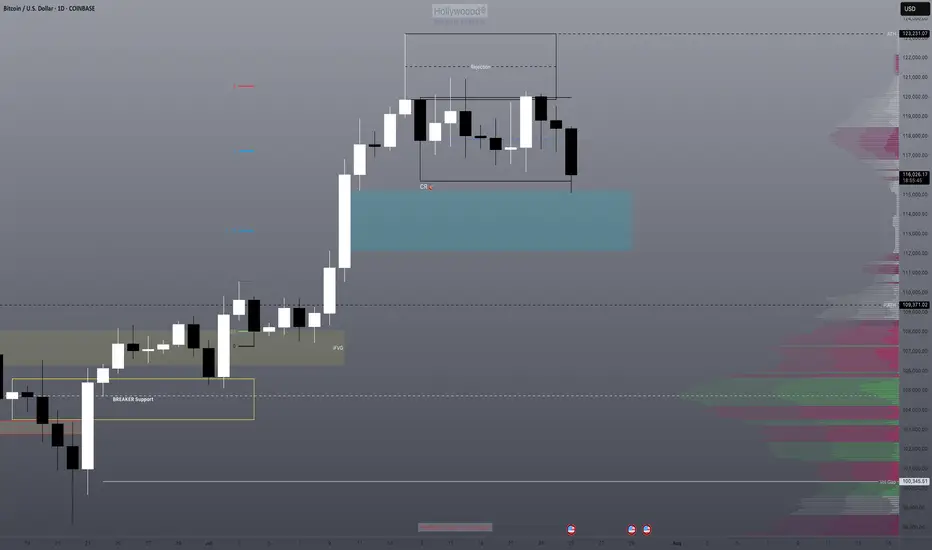
BITCOIN (BTCUSD): Recovery Starts
Bitcoin is going to rise from a key daily support.
After a liquidity grab, the market shows a clear strength,
forming a double bottom on an hourly time frame.
I expect a bullish movement at least to 117100
❤️Please, support my work with like, thank you!❤️
I am part of Trade Nation's Influencer program and receive a monthly fee for using their TradingView charts in my analysis.
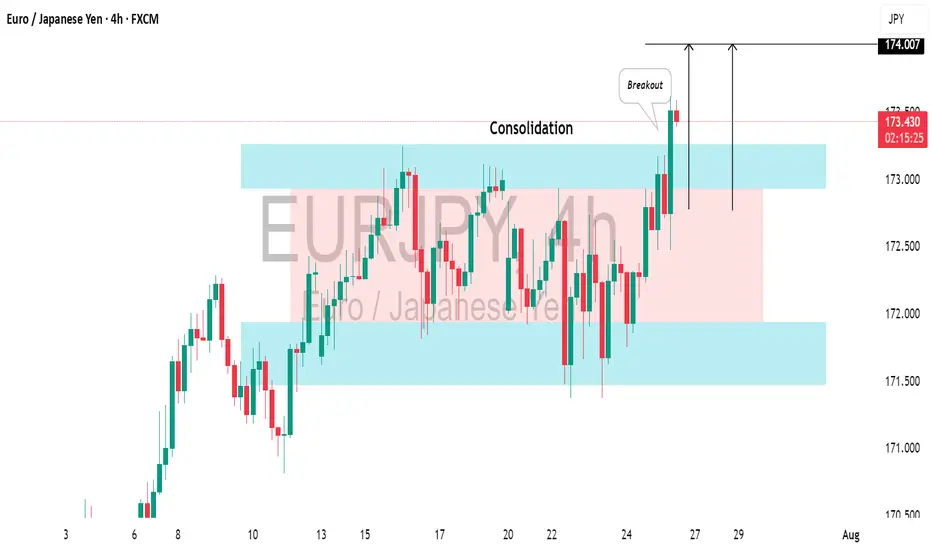
EURJPY: Correction is Over?!It seems like 📈EURJPY has finished consolidating within a broad horizontal channel on the 4H chart.
The formation of a new higher high today suggests potential upward movement.
Since it's Friday, I recommend considering trend-following buys starting Monday.
We should wait for the market to close above the highlighted resistance to establish a Higher Close on the daily chart.
Look to buy after a pullback, targeting 174.00 as the initial goal.
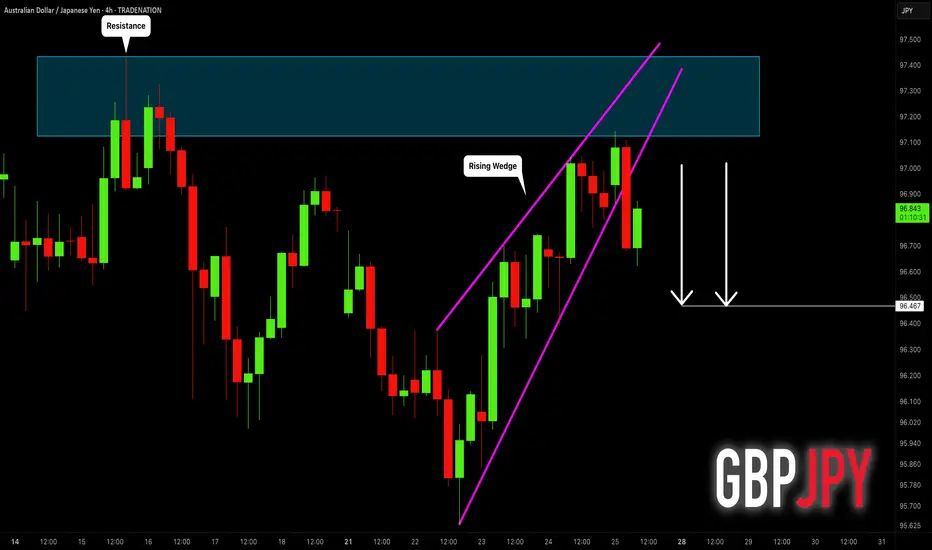
AUDJPY: Strong Bearish Signal?! 🇦🇺🇯🇵
AUDJPY may retrace from a key daily resistance.
As a confirmation, I see a bearish breakout of a support line of a rising
wedge pattern with a high momentum bearish candle.
Goal - 96.47
❤️Please, support my work with like, thank you!❤️
I am part of Trade Nation's Influencer program and receive a monthly fee for using their TradingView charts in my analysis.
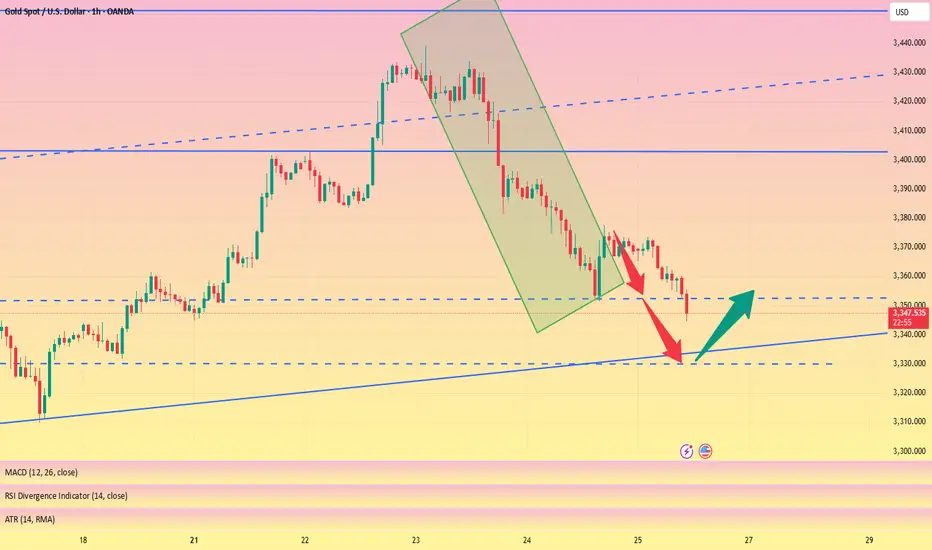
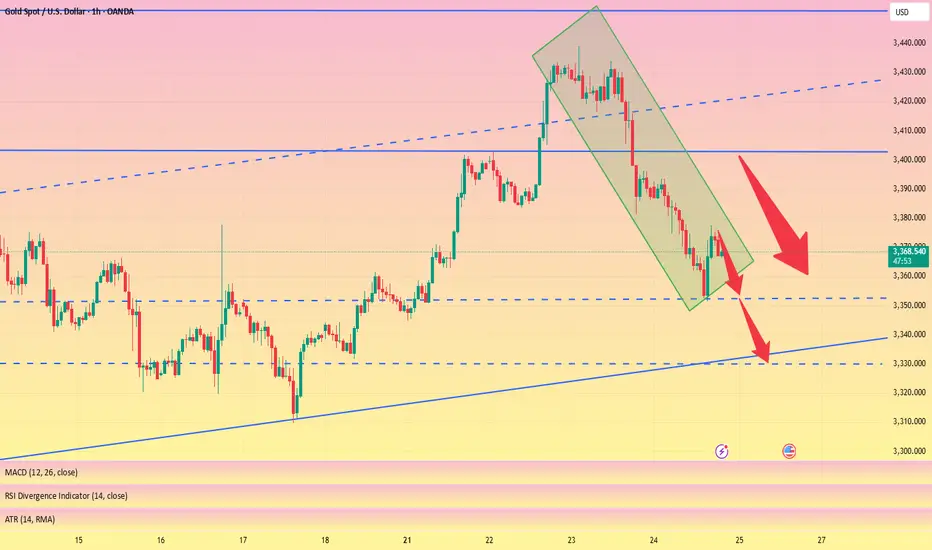
Trend corrected, long funds reduced, sellers returned#XAUUSD
The current moving average is still spreading downward, and the 4-hour chart closed with a large negative line. The market has not yet given a clear feedback on the current trend. However, after a large amount of buying funds intervened, the gold price hit a high of around 3377 and then stagnated. The short-term bullish momentum has weakened, and there is a certain risk of a correction and decline. Sellers are beginning to return📉.
Currently, you can consider participating in short selling at 3370-3377💡. If it rebounds directly to 3400-3405, you can still short if it does not break🔍. The target is 3360 below, and 3350 or even 3330 if it breaks🎯.
🚀 SELL 3370-3377
🚀 TP 3360-3350
Will the low of this BTC zone be used as a buy point?We have an imbalance high being tested. We know that this also represents the consolidation range low where both TPs and long entries will be triggered.
Will this be enough to send us back bullish or will be need further correction of the imbalance? I think there's a high probability of this with DXY also running into it's daily bearish imbalance range.
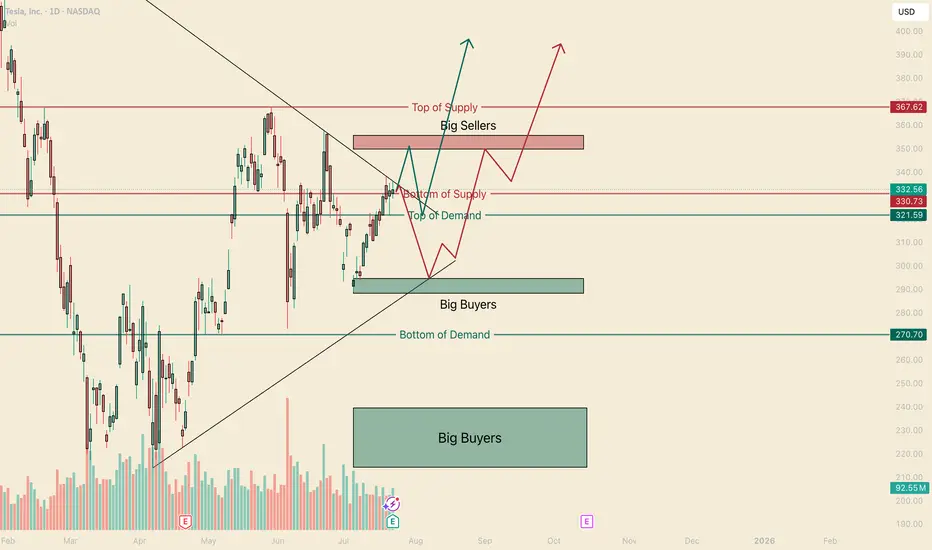
Two Trades to go Bullish on TSLAHello, I’m The Cafe Trader.
We’ve been tracking the MAG 7, and Tesla is the next focus for our short-term options or swing trade strategy.
I’m looking at two scenarios that are likely to play out with TSLA over the next few weeks.
For fundamental and long-term analysis, check my other article on TradingView.
⸻
Even though we’re sitting near the middle, bulls have just pushed into a bearish liquidity level (marked “Bottom of Supply”). We don’t know how much supply is left here, but the fact that bulls are pressing in suggests the bears are losing steam. This doesn’t mean price won’t pull back—it just means bearish follow-through may be weaker.
With that in mind, here are the two main scenarios:
⸻
1. Green Arrow — Bullish Test of Sellers
– Stock
If bulls keep the pressure on, we may see a test of the “Big Sellers” zone. The reaction there will tell us a lot.
If we see a sharp rejection (a quick tag followed by a flush) or a fake breakout that reverses, I’d approach longs more cautiously.
However, an aggressive entry long around the “Top of Demand” (around $321) could make sense, especially considering how buyers have been stepping in. This setup is primed to retest highs.
– Options
Pricing will be key here—especially post-earnings (EOD).
I’d look 2 weeks out. If you can snag a 335C for $5.00–$7.00, that’s solid.
Target profit would be into the Big Sellers zone. If we get a strong move before then that nets 3R–5R, I’d take it.
⸻
2. Red Arrow — Bearish Reaction + Big Buyer Support
– Stock
If earnings disappoint, we could see a shift in momentum. That said, big buyers should step in around $295.
This is actually the more likely scenario in my view.
From there, I’d look for a swing back up into the 330–350 range.
We’ll need to see how sellers handle the drop—are they aggressive, or is it just a lack of buyer interest?
Either way, this could align well with long-term buy zones.
– Options
On a flush to $295, I’d look for 3–5 day expiration calls around the 305 strike. @ a price between $1.50–$1.70 (look for 2-3R)
After the bounce, I’d expect a pause or retest of the uptrend line.
Then I’d look 2–3 weeks out for the 325C or 330C, ideally between $3.00–$5.00.
I’ll keep an eye on option pricing and update if we reach that level.
⸻
That’s all for short-term TSLA.
Follow for more charting and trade ideas.
📲 @thecafetrader
Is the DOLLAR bullish? Look at the weekly support zone levelsI am trying to figure out what the recent bullish days mean within the overall range.
Please let me know what you think 🙏🏾

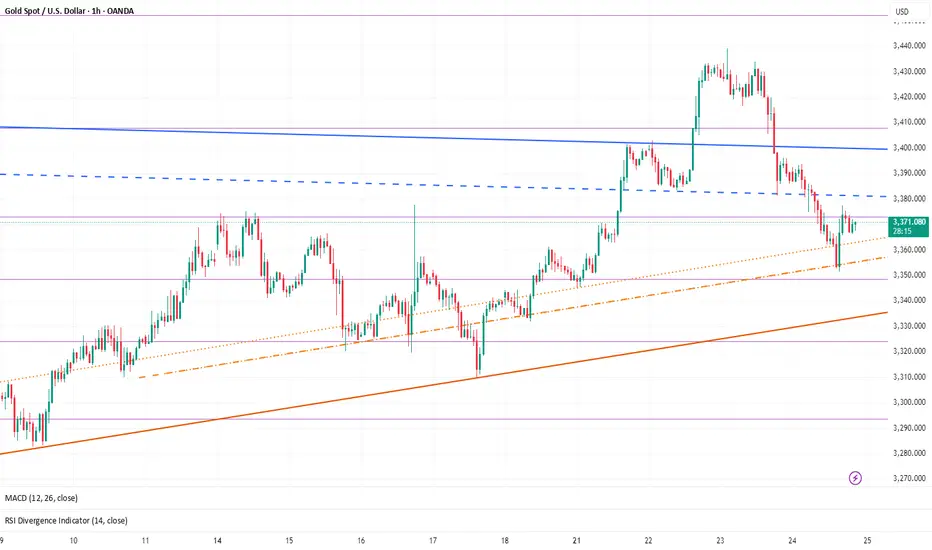
350pips Secured — Focus Shifts to Dip-Buying StrategyToday's trading was very successful, and the grasp of the long and short rhythm was very accurate. Today's trading situation is as follows:
1. Close the short position with an overnight entry price of around 3386 near 3380, with a loss of 60 pips, and the loss amount exceeded $6K;
2. Directly short gold near 3380, manually close the position near 3366, profit 130pips, profit amount exceeded $12K;
3. Long gold near 3356, hit TP: 3372 and end the transaction, profit 160pips, profit amount exceeded $8K;
4. Long gold near 3362, hit TP; 3375 and end the transaction, profit 120pips, profit amount exceeded $6K.
Intraday trading summary: Today, the long and short sides completed a total of 4 transactions, one of which suffered a loss, but the net profit was 350pips, and the profit amount exceeded $20K. For short-term trading, I think I can submit a satisfactory answer to myself today!
How to execute the transaction next? Gold started to pull back from around 3438 and has now reached a low of around 3351, with a retracement of more than 870pips. The retracement space is not small. However, gold has stabilized above 3350 and has started a technical rebound repair, and the upward force is not weak, so gold may have completed the retracement. Under the support of these two technical conditions, gold may regain its upward momentum and hit 3400 again.
At present, the short-term resistance is obvious, located in the area near 3380. Once gold breaks through 3380, gold will inevitably continue to rise and hit 3400 again; but I think as long as gold stabilizes above 3350, it is not difficult to break through the short-term resistance of 3380, so gold will inevitably test the 3400 mark again; and the short-term support below is in the 3365-3355 area. Gold may still retreat to this area first during the rise in order to increase liquidity and accumulate momentum, helping gold to break through 3380 more easily.
So for the next short-term trading, I think it is feasible to go long on gold in the 3365-3355 area, first looking at the target area of 3380-3390, and then 3400.
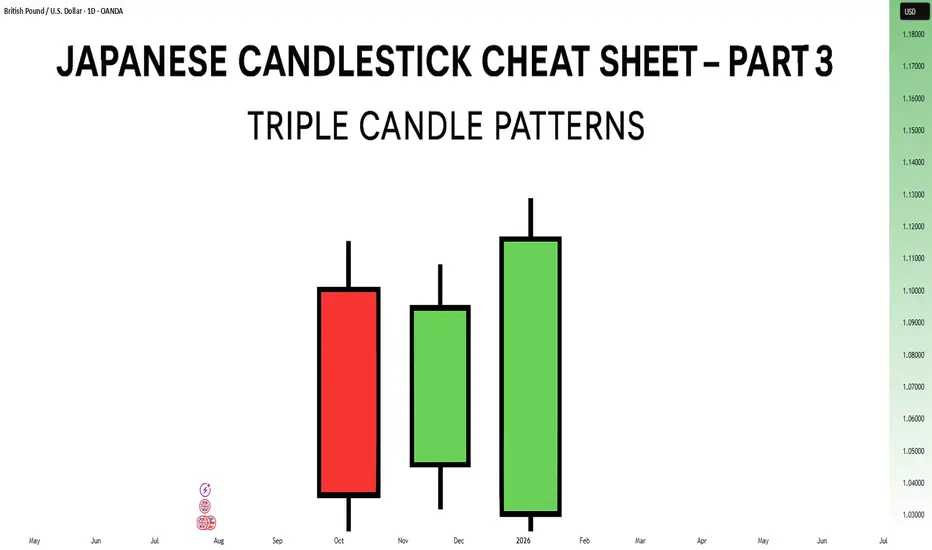
Japanese Candlestick Cheat Sheet – Part Three- 3 candle patternsSo far in this series, we've broken down single candle formations ( Part 1 ) and explored double candle signals ( Part 2 ) — the kind of patterns that give you quick, often powerful hints about the market’s mood.
But now it’s time to go a step further.
👉 In Part 3, we dive into triple candlestick formations — patterns that take more time to form, but often offer stronger confirmation and a more reliable narrative.
They’re like reading three full sentences from the market instead of just one or two words.
If you’re ready to spot momentum shifts (not noise), this lesson is for you.
Let’s decode the story behind formations like Morning Star, Three White Soldiers, and so on.
MORNING STAR
Bias: Bullish
What is the Morning Star pattern?
The Morning Star pattern consists of a bearish candle, a small-bodied middle candle, and a bullish candle, forming at the end of a downtrend to signal potential reversal. This pattern reflects a shift from seller dominance to buyer strength, as the middle candle marks a pause before a reversal. The Morning Star is a reliable signal that buyer interest is reemerging.
Understanding Morning Stars helps traders anticipate shifts in momentum, providing valuable entry points for new uptrends.
Meaning:
Found in downtrends; signals potential bullish reversal as buyers gain control, with strength confirmed by the third candle closing above the first.
BULLISH ABANDONED BABY
Bias: Bullish
What is the Bullish Abandoned Baby pattern?
The Bullish Abandoned Baby is a rare but powerful reversal pattern that consists of a bearish candle, a gapped doji, and a bullish candle. The middle doji reflects indecision, while the third bullish candle confirms the reversal. This pattern highlights a dramatic shift in sentiment, showing that buyers are prepared to take control.
Recognizing the Bullish Abandoned Baby can offer traders insights into pivotal market shifts.
Meaning:
Appears in downtrends; suggests a strong bullish reversal, as the middle doji shows indecision, with confirmation by a strong bullish move.
THREE WHITE SOLDIERS
What is the Three White Soldiers pattern?
The Three White Soldiers pattern consists of three consecutive bullish candles, each closing higher than the last, often appearing in downtrends to signal a potential bullish reversal. This pattern reflects sustained buying pressure, indicating that buyer sentiment is strong. Psychologically, it shows that buyers are steadily gaining confidence, pushing prices upward.
For traders, Three White Soldiers provide a clear signal of momentum, ideal for capturing emerging trends.
Meaning:
Found in downtrends; signals potential trend reversal, showing sustained buying strength, often signaling the start of a bullish trend.
MORNING DOJI STAR
What is the Morning Doji Star pattern?
The Morning Doji Star pattern is similar to the Morning Star, but with a doji as the middle candle, indicating greater indecision before a reversal. This pattern consists of a bearish candle, a doji, and a bullish candle, highlighting a transition from bearish to bullish sentiment. The doji reflects a moment when market sentiment is balanced, but the third candle confirms a bullish shift.
Interpreting Morning Doji Stars can help traders identify turning points in downtrends, providing valuable entry opportunities.
Meaning:
Appears in downtrends; signals potential bullish reversal, with indecision from the doji and confirmation by a strong bullish candle.
EVENING STAR
What is the Evening Star pattern?
The Evening Star is a three-candle pattern that appears at the top of an uptrend, signaling a potential bearish reversal. It consists of a bullish candle, a small-bodied middle candle, and a bearish candle, showing a transition from buyer control to seller strength. This pattern often appears at market peaks, where optimism is giving way to caution.
Understanding the Evening Star pattern helps traders anticipate downtrend formations, allowing them to time their exits.
Meaning:
Found in uptrends; signals potential bearish reversal as sellers gain control, confirmed if the third candle closes below the first.
BEARISH ABANDONED BABY
What is the Bearish Abandoned Baby pattern?
The Bearish Abandoned Baby is the bearish counterpart to the Bullish Abandoned Baby and consists of a bullish candle, a gapped doji, and a bearish candle. This pattern reveals a dramatic shift in sentiment from bullish to bearish, highlighting a sudden reversal at the top of an uptrend.
Recognizing the Bearish Abandoned Baby can offer traders insight into market tops and impending trend changes.
Meaning:
Appears in uptrends; indicates strong bearish reversal, as indecision in the doji is followed by selling strength.
THREE BLACK CROWS
What is the Three Black Crows pattern?
The Three Black Crows pattern consists of three consecutive bearish candles, each closing lower than the last, appearing in uptrends to signal potential reversal. This pattern reflects sustained selling pressure, indicating that sellers are gaining control. The Three Black Crows highlight a moment when buyer confidence wanes, marking the beginning of downward momentum.
For traders, this pattern provides a clear signal to avoid buying into weakening trends or even entering short trades.
Meaning:
Found in uptrends; signals potential bearish reversal, with sustained selling pressure often marking the start of a downtrend.
EVENING DOJI STAR
What is the Evening Doji Star pattern?
The Evening Doji Star is similar to the Evening Star, but with a doji as the middle candle, highlighting greater indecision. This pattern consists of a bullish candle, a doji, and a bearish candle, indicating a shift from bullish to bearish sentiment. The doji suggests that buyers are losing control, with sellers prepared to reverse the trend.
Understanding Evening Doji Stars allows traders to recognize market tops, helping them avoid overextended trends.
Meaning:
Appears in uptrends; signals potential bearish reversal, as the doji suggests indecision, confirmed by strong selling on the third candle.
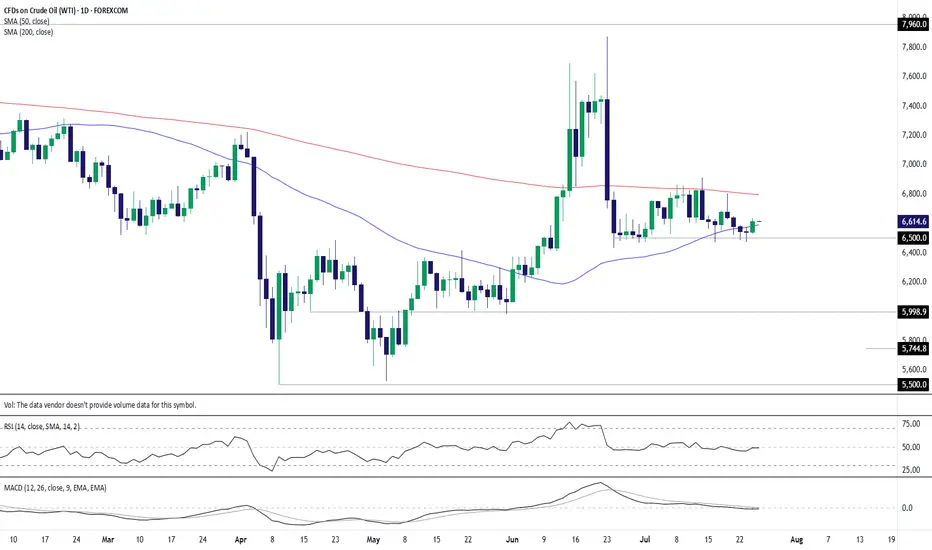
WTI crude: $65 floor holds again as bulls test 50-day MAAfter nine failures to break and close beneath $65 per barrel over the past month, you have to wonder how much longer bears will persist in attempting to take out the level. Following a nice pop higher on Thursday, completing a morning star pattern and closing above the 50-day moving average, it may be time for WTI bulls to have their day in the sun.
For those eyeing long setups, positions could be initiated above the 50-day moving average with a stop beneath for protection against reversal.
As for potential targets, the contract had little luck breaking cleanly above the 200-day moving average earlier this month, making it screen as a suitable level. It’s found just below $68 per barrel today.
Good luck!
DS
Is this a Bull Flag forming on the XRP daily timeframe?Although sentiment for XRP is strong and recent trend has been sharply upwards. I'm wondering if this is a bear flag forming on the daily?
Given the sharp rise it could be and may not be a negative signal as it could give the opportunity for a healthy pull back before rising again to new all time highs.
Let's watch how it progresses over the next few days. I will not be jumping into a trade until it confirms.

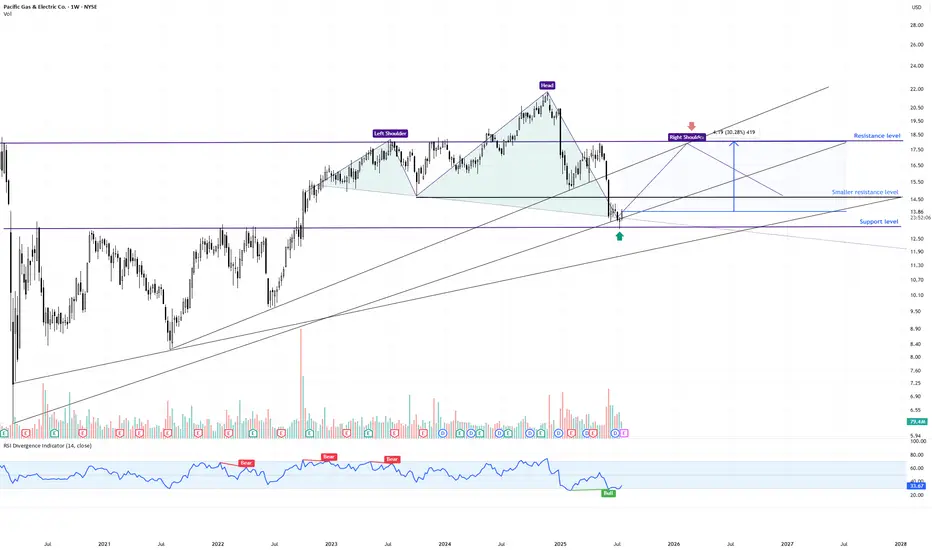
PCG Weekly Swing Trade | High-Probability Reversal Zone📍 Ticker: PCG (Pacific Gas & Electric Co.)
📆 Timeframe: 1W (Weekly)
💡 Pattern: Head & Shoulders Formation – Testing Neckline & Long-Term Support
📉 Price: $13.87 (current weekly level)
📊 Volume: 78M
📉 RSI: 33.7 → oversold zone brewing
🔍 What the Chart is Showing
PCG is in the late stages of a Head & Shoulders pattern, but the right shoulder is still developing. Price is now pressing into a critical confluence area where multiple factors intersect:
✅ Neckline zone from the potential H&S structure
✅ Multi-year ascending trendline support (2020 origin)
✅ Horizontal support cluster from 2022–2023 consolidation
✅ Weekly RSI hovering near oversold, hinting at possible bullish divergence
Importantly, the H&S is not yet confirmed – it would require a decisive weekly close below the neckline to trigger a textbook breakdown.
🧠 Swing Trade Scenarios
➡️ Bullish Reversal Scenario (Failed Breakdown)
🟢 Entry Zone: $13.60–$14.00
🎯 Target 1: $14.62 (initial resistance pivot) - close 30-70% of the position
🎯 Target 2: $17.80–$18.50 (major resistance) - close the another 30-70% of the position.
⛔️ Stop-Loss 1: Close below $13.20 (neckline break confirmation)
➡️ Bearish Breakdown Scenario (Pattern Confirmation)
❌ If PCG closes below $13.20 on the weekly, it confirms the H&S → opens downside toward $11.50 (the lowest trendline support)
⚠️ What Makes This Week Critical
📌 A hammer-like candle is forming – but needs a strong weekly close to indicate buyer absorption
📌 A close above $14.00 would weaken the H&S formation, hinting at a failed pattern
📌 A close below $13.20 would confirm the bearish continuation
This is a decision zone: either the right shoulder fails, triggering a deeper swing lower, or buyers defend and negate the pattern.
💬 Will PCG confirm the weekly H&S breakdown or trap bears with a failed pattern bounce?
✅ This week’s close will define the next major swing move!
LIKE & FOLLOW for more professional swing setups with clean risk/reward.
#PCG #SwingTrade #Utilities #TargetTraders #TechnicalAnalysis #HeadAndShoulders
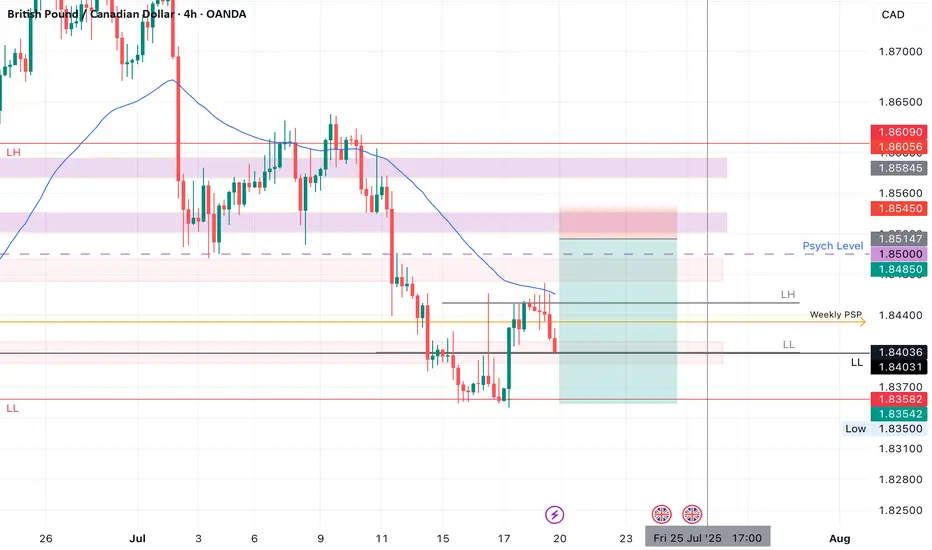
GBPCAD SHORTMarket structure bearish on HTFs DW
Entry at both Weekly and Daily AOi
Weekly Rejection at AOi
Previous Weekly Structure Point
Daily Rejection at AOi
Daily EMA retest
Around Psychological Level 1.85000
H4 Candlestick rejection
Levels 5.3
Entry 90%
REMEMBER : Trading is a Game Of Probability
: Manage Your Risk
: Be Patient
: Every Moment Is Unique
: Rinse, Wash, Repeat!
: Christ is King.
AUDCAD SHORTMarket structure bearish on HTFs DW
Entry at both Weekly and Daily AOi
Weekly Rejection at AOi
Weekly Previous Structure Point
Weekly Rejection at AOi
Daily Rejection at AOi
Daily Previous Structure Point
Around Psychological Level 0.89500
H4 EMA retest
H4 Candlestick rejection
Levels 4.17
Entry 100%
REMEMBER : Trading is a Game Of Probability
: Manage Your Risk
: Be Patient
: Every Moment Is Unique
: Rinse, Wash, Repeat!
: Christ is King.

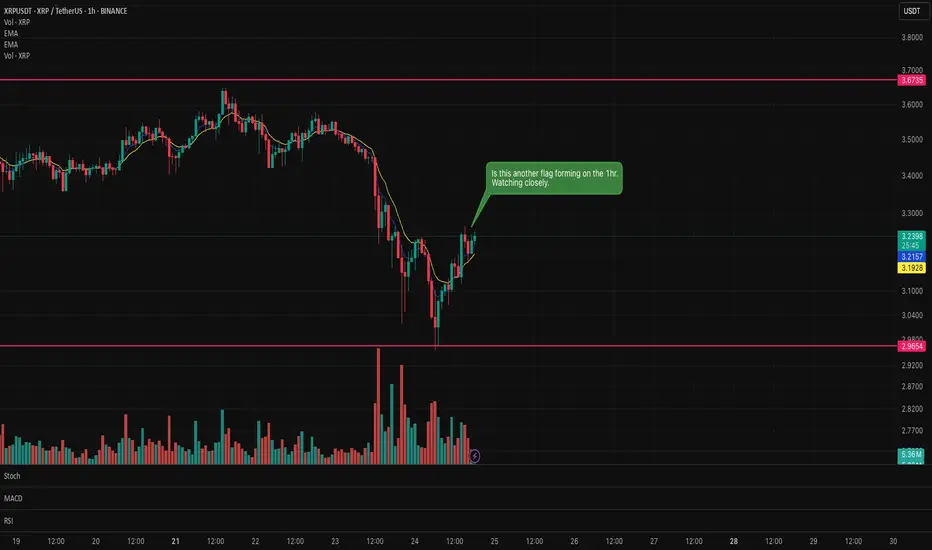
Is there another XRP flag forming on the hourly chart?Could be another flag forming on XRP. Waiting for the formation to prove confirmation as to whether it will be a bull or bear flag.
News of large amounts of XRP entering the exchanges from the CEO could mean a bear flag?
It's only appearing on the hourly so it could be a false flag.
Let's what and see what forms on the hourly candle.