Nifty Analysis EOD – July 24, 2025 – Thursday 🟢 Nifty Analysis EOD – July 24, 2025 – Thursday 🔴
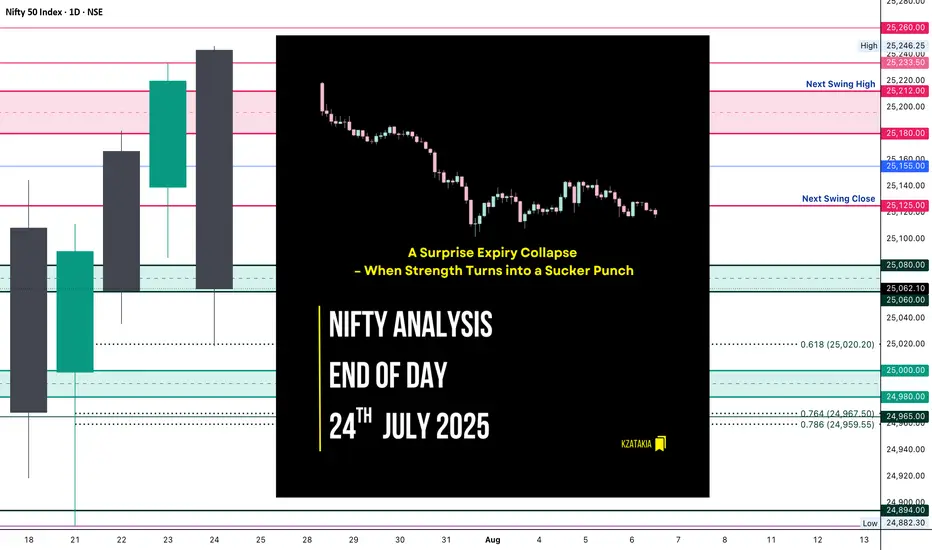
📉 A Surprise Expiry Collapse – When Strength Turns into a Sucker Punch
Today’s session was an unexpected twist.
Nifty opened above the previous day’s high, giving early hope to the bulls—but within the first hour, it slipped to 25,155 and formed its IB. What followed was a sharp 136-point fall, breaking not just yesterday’s low, but also the July 22nd low. This sudden bearish momentum was completely news-driven, and expiry-day long unwinding only added fuel to the fire.
Despite a strong close yesterday, today’s fall erased all of July 23rd’s gains and brought us right back to July 22nd’s close—neutralizing the recent upward effort.
The day closed at 25,062, marginally above key support. Technically, today’s low respected the 0.618 Fib retracement level drawn from July 21st’s low to July 23rd’s high—so a dead cat bounce is possible if no further bad news hits. But if we open below 25,050 tomorrow, expect more downside pressure toward 24,960–24,890 zones.
🕯 5 Min Time Frame Chart with Intraday Levels
🕯 Daily Time Frame Chart with Intraday Levels
🕯 Daily Candle Breakdown
Open: 25,243.30
High: 25,246.25
Low: 25,018.70
Close: 25,062.10
Change: −157.80 (−0.63%)
Candle Structure Analysis:
🔴 Body: Large red body (181.2 pts) shows strong intraday selling.
☁️ Upper Wick: Tiny (2.95 pts) → sellers dominated from the start.
🌊 Lower Wick: Moderate (43.4 pts) → small recovery near close.
Candle Type:
Almost a bearish Marubozu — clear domination by sellers with barely any upper shadow, signaling intense sell pressure.
Key Insight:
Bulls lost control after open.
Bears took charge below 25,155.
Close near support, but bias cautious.
Bulls must reclaim 25,150+ for recovery, else 25,000 may give way.
🛡 5 Min Intraday Chart
⚔️ Gladiator Strategy Update
ATR: 185.97
IB Range: 83.55 → Medium
Market Structure: Balanced
Trades Triggered:
⏰ 10:05 AM – Short Entry → SL Hit
⏰ 11:10 AM – Short Entry → Target Hit (1:3.6 Risk:Reward)
📊 Support & Resistance Levels
Resistance Zones:
25,125
25,155
25,180 ~ 25,212
25,233
Support Zones:
25,080 ~ 25,060
25,020
25,000 ~ 24,980
24,967 ~ 24,959
24,882
🔮 What’s Next?
A gap-up or stable open may trigger a dead cat bounce toward 25,150–25,180.
A gap-down below 25,050 confirms bearish continuation → next targets: 24,960 / 24,890.
Watch price action around the 25,020–25,060 zone closely.
🧠 Final Thoughts
“Markets are never wrong – opinions often are.”
— Jesse Livermore
Today was a reminder of how expiry day surprises and news flows can flip the narrative. Stay flexible, and keep a bias—but not a blind one.
✏️ Disclaimer
This is just my personal viewpoint. Always consult your financial advisor before taking any action.
Candlestick Analysis
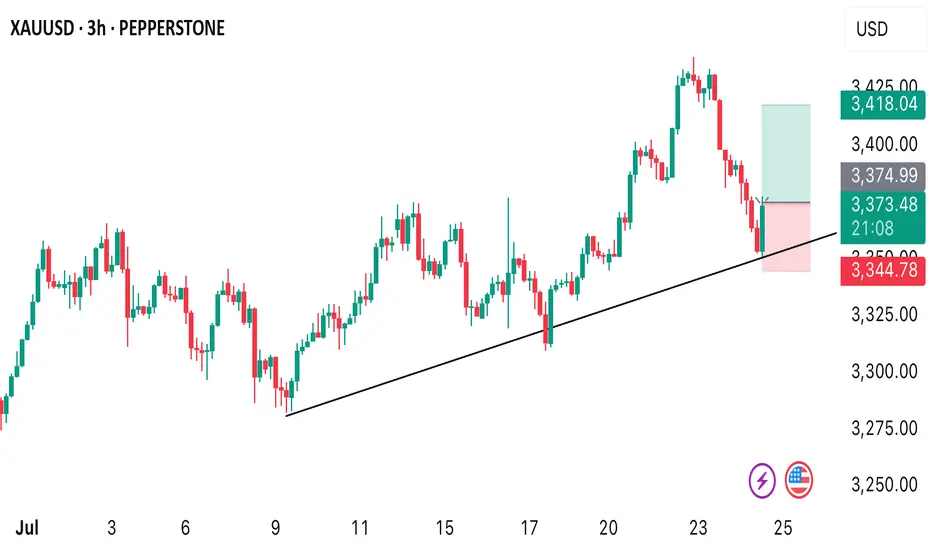
XAUUSD INTRADAY BUY OPPORTUNITY A buy opportunity is envisaged from the current market price as price rebounds around 3344.78 we’re looking forward to seeing buyers take price back to resistant level of $3,418.04 Take advantage of this opportunity.
The callback is coming to an end, don't chase the short easily#XAUUSD
The long positions held last night have already left the market at a loss😔. After the Asian session opened, I continued to watch the trend of gold, but it did not effectively rebound to the ideal target area. After repeatedly testing around 3393, I chose to manually exit the market📀.
Gold is currently somewhat overcorrected, with the hourly line falling into severe oversold territory📉. But the market will eventually return to the bullish trend🐂. Why do I say that? First, there are less than 8 days left before the final deadline for tariffs. Second, the Federal Reserve’s interest rate cut is also approaching. In the medium and long term, there is definitely no problem with being bullish. There will be initial jobless claims data later, which will affect the trend of gold today. We need to pay some attention to it👀.
From the daily line, the current Bollinger Band middle track is near the 3343 line, and the SMA60 moving average is near the 3330 below. In the short term, the downward momentum of gold is released, and it is expected to test the 3343 mid-line support below💪.
📊Therefore, we can consider going long again at 3360-3343 below and look towards 3375-3385. Short-term losses don’t mean anything. With the recent frequent news fluctuations, we still have a good chance to turn losses into profits🚀.
🚀BUY 3360-3350
🚀TP 3375-3385
SHIB/USDT: A Fight for Recovery?SHIB/USDT is currently trading around $0.00001363, marking an approximately 11.5% drop over the past 24 hours. However, it's crucial to note that the price is successfully holding above the key support level of $0.00001373.
Recently, we've witnessed a significant increase in the activity of so-called "large holders" or "whales" concerning SHIB/USDT. Their netflow has reached a two-month high, signaling heightened interest. In the past 24 hours, addresses holding at least 0.1% of the total SHIB supply accumulated an impressive 4.66 trillion SHIB, representing an investment of a staggering $63.7 million. These major players clearly believe in the potential for a price recovery.
What's Next? Scenarios for SHIB/USDT
Bullish Scenario (Uptrend):
Should SHIB/USDT successfully bounce off the support level at $0.00001317, it would likely pave the way for further price appreciation. It could potentially reach $0.00001423. If this level solidifies as new support, it would mark a full recovery of today's losses and could initiate a new uptrend, provided that broader market conditions remain favorable. The investment by the whales would be crucial in this scenario.
Bearish Scenario (Downtrend):
However, if SHIB/USDT fails to hold above the support of $0.00001317 and falls below this level (likely due to profit-taking by other market participants), the popular "meme coin" could slip to $0.00001188. Such a development would invalidate the bullish thesis and further reduce investor confidence. The next few days will be critical for SHIB to demonstrate whether it can
maintain its current support levels.
#forex #SHIB #USDT #SwingTrade

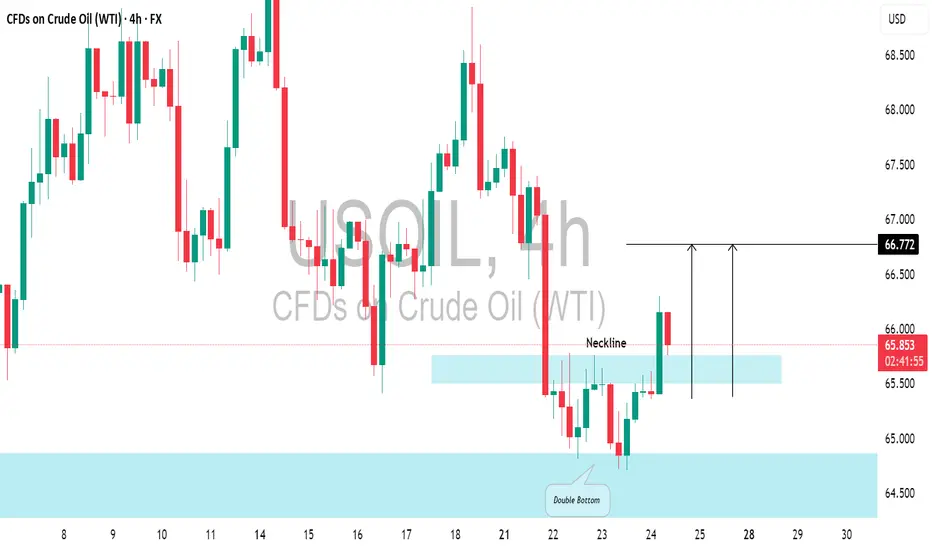
US CRUDE OIL (WTI): Pullback From Support📈USOIL responded well to the highlighted daily support level.
The price formed a double bottom pattern on that and broke above its neckline.
There's a strong likelihood that the price will continue to increase and reach 66.72 shortly.
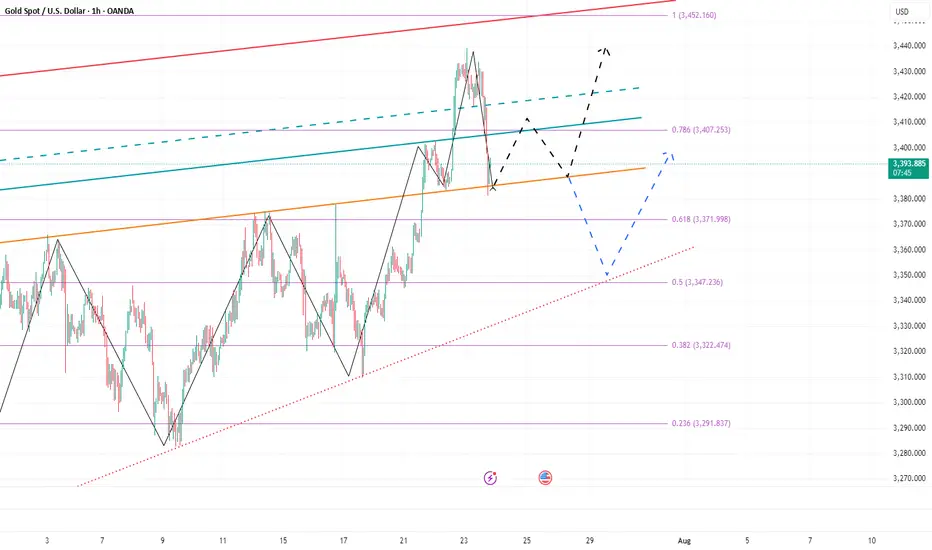
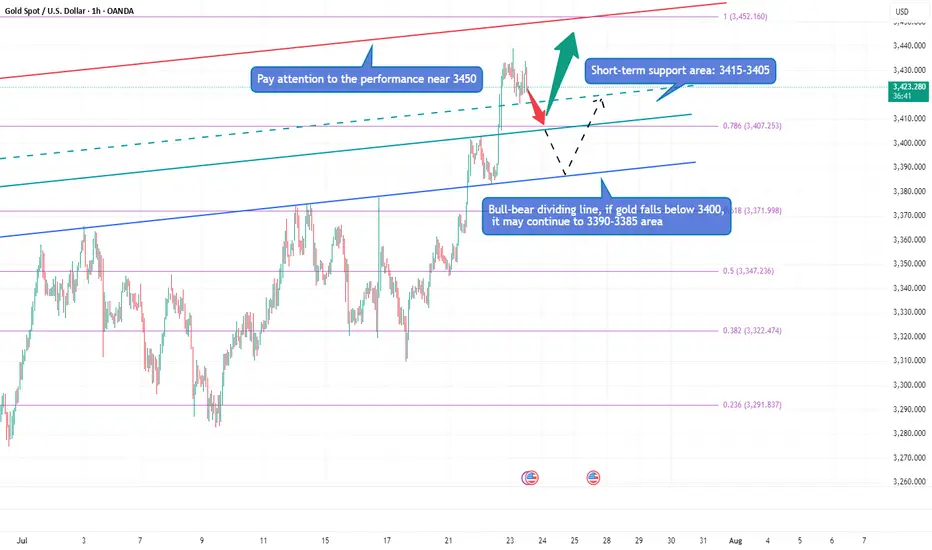
Double Down on Gold — Targeting 3400–3410!Obviously, gold did not give us the opportunity to short gold near 3440 today. In the process of its recent pullback, gold tested 3400 as expected, and after falling below 3400, it continued to fall to around 3385 as if it was planned by me. Although the lowest point had reached around 3381, it quickly rebounded above 3385. What is relatively regrettable today is that both of our plans to short gold ended in failure. The first time was when gold did not give us the opportunity to short near 3440. The second time was when we were preparing to short gold at 3400 and set the TP to 3385. However, we did not have time to create an order because the price fell too quickly, causing us to miss the gold short trade again.
At present, I have a trading order to go long on gold near 3386. And I go long on gold with twice the usual trading volume. Why am I still optimistic about the rebound of gold in the short term after the gold price fell by nearly $60? Because the area around 3385 is the short-term bull-bear dividing line, although gold has fallen sharply, as long as it stays above the area around 3385, gold is still in a bullish trend as a whole, and the bullish structure has not been destroyed, so in the short term, gold still has a lot of room for rebound after the pullback. This is why I dare to use twice the usual trading volume to buy gold near 3386.
However, because the current gold long and short continuity is not strong, and the market uncertainty is still increasing due to complex news, the gold market is prone to violent fluctuations in the short term, so we have to be more careful in trading. At present, I still hold a gold long position near 3386, and I hope that gold can continue to rebound to the target area: 3400-3410.
XAU/USD 24 July 2025 Intraday AnalysisH4 Analysis:
-> Swing: Bullish.
-> Internal: Bullish.
You will note that price has targeted weak internal high on three separate occasions which has now formed a triple top, this is a bearish reversal pattern and proving this zone is a strong supply level. This is in-line with HTF bearish pullback phase.
Remainder of analysis and bias remains the same as analysis dated 23 April 2025.
Price has now printed a bearish CHoCH according to my analysis yesterday.
Price is now trading within an established internal range.
Intraday Expectation:
Price to trade down to either discount of internal 50% EQ, or H4 demand zone before targeting weak internal high priced at 3,500.200.
Note:
The Federal Reserve’s sustained dovish stance, coupled with ongoing geopolitical uncertainties, is likely to prolong heightened volatility in the gold market. Given this elevated risk environment, traders should exercise caution and recalibrate risk management strategies to navigate potential price fluctuations effectively.
Additionally, gold pricing remains sensitive to broader macroeconomic developments, including policy decisions under President Trump. Shifts in geopolitical strategy and economic directives could further amplify uncertainty, contributing to market repricing dynamics.
H4 Chart:
M15 Analysis:
-> Swing: Bullish.
-> Internal: Bullish.
H4 Timeframe - Price has failed to target weak internal high, therefore, it would not be unrealistic if price printed a bearish iBOS.
The remainder of my analysis shall remain the same as analysis dated 13 June 2025, apart from target price.
As per my analysis dated 22 May 2025 whereby I mentioned price can be seen to be reacting at discount of 50% EQ on H4 timeframe, therefore, it is a viable alternative that price could potentially print a bullish iBOS on M15 timeframe despite internal structure being bearish.
Price has printed a bullish iBOS followed by a bearish CHoCH, which indicates, but does not confirm, bearish pullback phase initiation. I will however continue to monitor, with respect to depth of pullback.
Intraday Expectation:
Price to continue bearish, react at either M15 supply zone, or discount of 50% internal EQ before targeting weak internal high priced at 3,451.375.
Note:
Gold remains highly volatile amid the Federal Reserve's continued dovish stance, persistent and escalating geopolitical uncertainties. Traders should implement robust risk management strategies and remain vigilant, as price swings may become more pronounced in this elevated volatility environment.
Additionally, President Trump’s recent tariff announcements are expected to further amplify market turbulence, potentially triggering sharp price fluctuations and whipsaws.
M15 Chart:

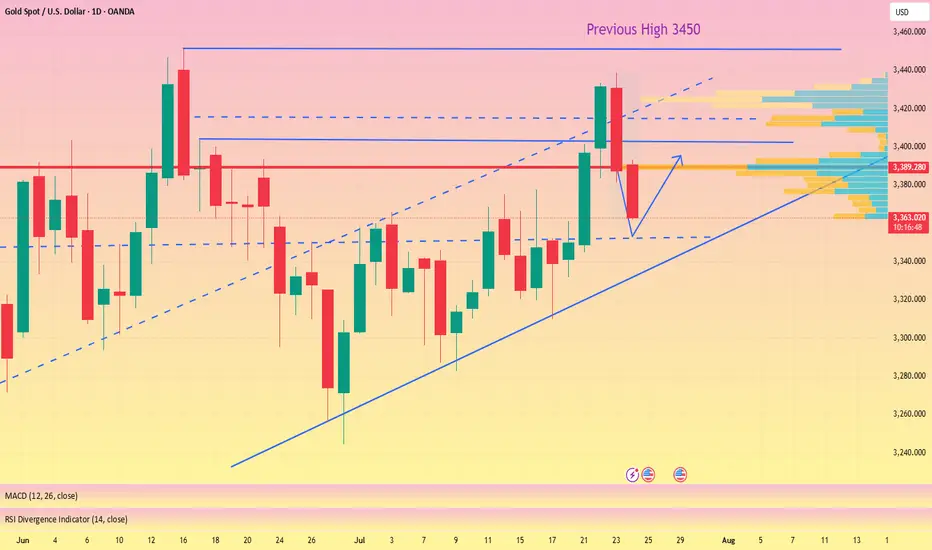
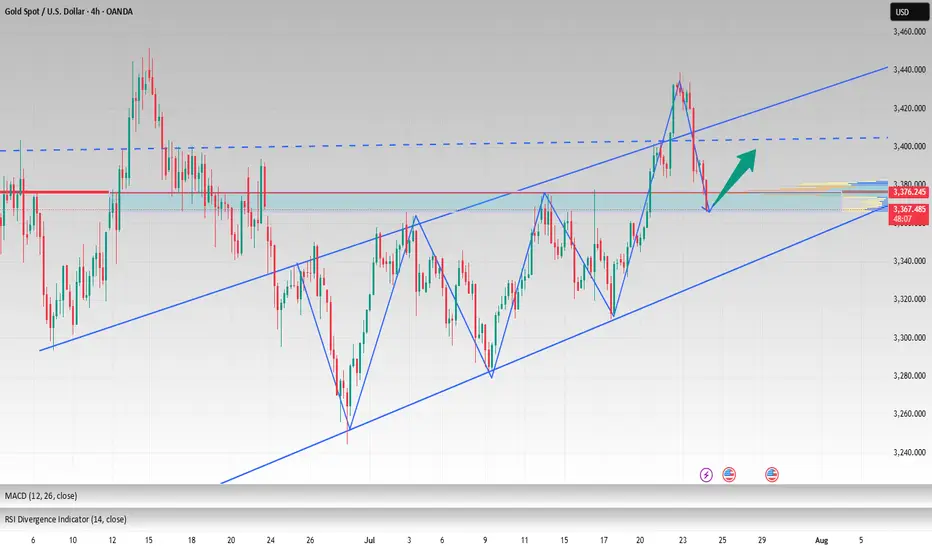
Correction is not bearish, buy on rebound at low levelToday is critical. Yesterday, gold fell under the pressure of 3396. The next 3396 area is very critical, and it will be relatively weak below it. If it goes up, the market rebound will expand. Pay attention to 3405 or 3420 area, with the focus on 3420. As long as it is below here, it will be mainly bearish. Breaking through 3420, the market is expected to continue to rise and break yesterday's high to test the 3450 area, and then seek to fall again. On the downside, pay proper attention to the 3380 area, which is short-term support; the focus is on the 3370~3365 area, which is the next bull-bear watershed.
The daily line fell yesterday and included the previous day's big positive rise, which represents the current high-level fluctuation of the price. At present, we need to pay attention to the lower moving average support corresponding to SMA10 at 3367, while the moving average SMA30 is around 3351-53, the middle track is at 3344, and the moving average SMA60 is at 3330.
From the daily level: today's decline will not fall below 3351-53, and it is likely to be around 3367-70. We have the opportunity to participate in long orders near 3370.
Therefore, if the price touches 3370-3365 for the first time during the day, you can consider going long, with the target at 3390-3400; if the downward trend of gold continues during the day, you can go long again at 3355-3353, defend 3345, and exit the market after earning a difference of $10-20.
OANDA:XAUUSD
Gold fell as expected, can it reverse?📰 News information:
1. Initial unemployment claims data
📈 Technical Analysis:
Gold has made a profit retracement correction as expected. The two-day rising market has led to an overly bullish sentiment in the market. Under this pattern, it is very easy to trigger an unexpected reversal trend, which is often a key opportunity to break the psychological defense line of retail investors in the market.
From the bottom of gold at 3244 to the high of 3439 this week, it can be found that the current 38.2% support position is near 3364. Moreover, the current daily SMA10 moving average position is also near 3364, SMA30 and the middle track of the Bollinger Band are near 3343, and SMA60 is near 3330.
From the daily line, if the daily line can stand above 3364, then there is still a possibility of refreshing the high of 3438 in the future. On the other hand, if the daily line falls below 3364, then 3438 may become the high point in July.
If there is a rebound in the morning, then 3384 in the white session will be the bottom support, and short positions must be participated in the European and American sessions. If the downward trend continues in the morning, there will be an opportunity to participate in long orders around 3370. At the same time, the possibility of further decline and reaching the middle line of 3343 cannot be ruled out. At the same time, if the 4H chart can form a head and shoulders top pattern, then the intraday long rebound point will not exceed 3410.
Therefore, on the whole, if it falls directly, it can be considered to go long when it first touches 3375-3365, and the target is 3390-3400; if the intraday decline is strong, the second trading opportunity is below 3355-3345, and the target is $10-20 before exiting.
🎯 Trading Points:
BUY 3375-3365
TP 3390-3400
In addition to investment, life also includes poetry, distant places, and Allen. Facing the market is actually facing yourself, correcting your shortcomings, facing your mistakes, and exercising strict self-discipline. I share free trading strategies and analysis ideas every day for reference by brothers. I hope my analysis can help you.
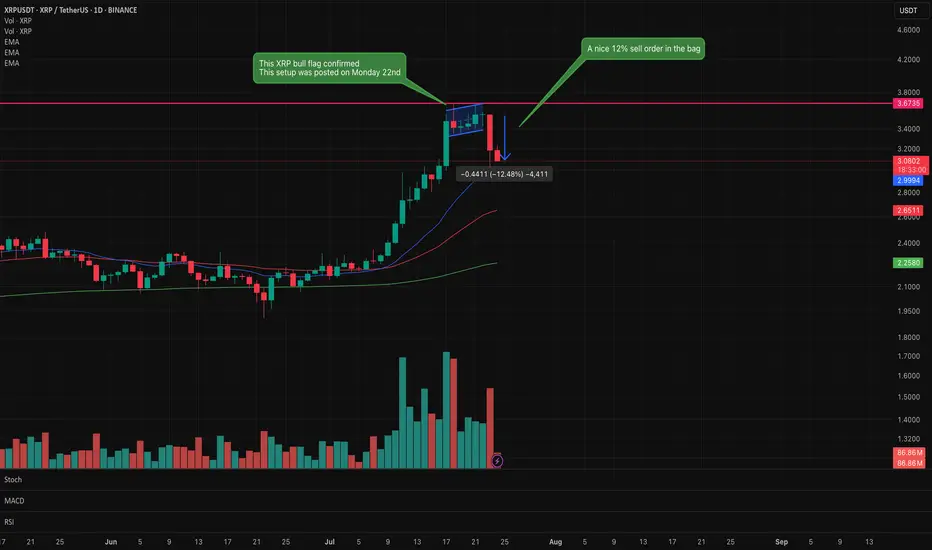
XRP Bear flag confirmed. Looking for support in the decline.XRP bear flag identified on Monday 22nd has now confirmed with a nice 12% short sell.
This signals do not always confirm but when they do it is satisfying that the analysis and patience has paid off.
Trading is all about controlling emotions and being patient. Wait for the confirmation before executing.
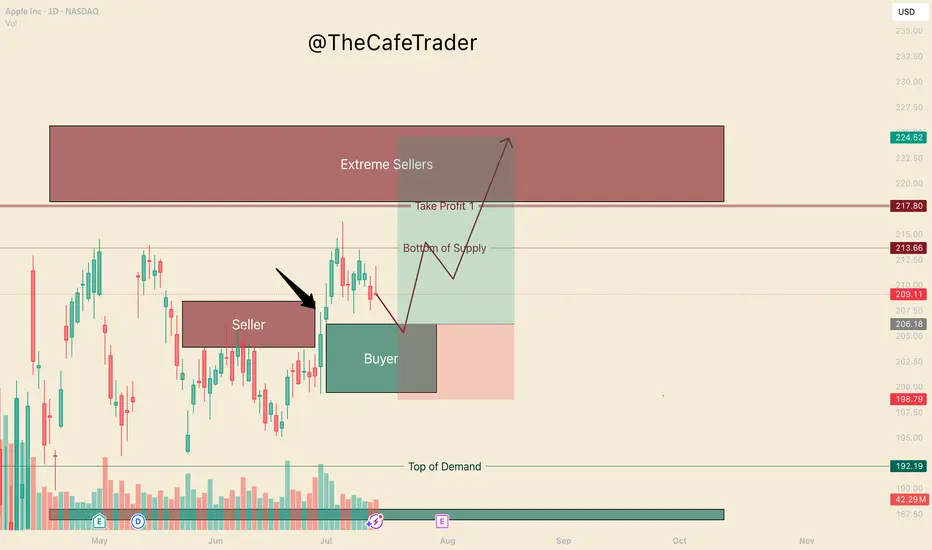
APPL. Bulls are in ControlHello, I’m TheCafeTrader.
This post is for technical traders looking to capitalize on short swings and options.
What you’re seeing here are supply and demand zones — areas where liquidity is concentrated. These levels are identified using a system built around footprint data, order flow, and market imbalances.
🔹 Key Observation:
I’ve marked a seller that price has now broken above. This tells us that buyers have overpowered a sell-side participant, and are now likely targeting deeper liquidity in the $218–$225 range.
🔹 On Apple’s Behavior:
Apple can be slow and choppy at times. So, if you’re trading options, consider going as close to the money as possible and give yourself some time on the contracts.
🔹 New Buyer in the Market:
Between $199–$206, a new aggressive buyer has stepped in. This player appears to be pressuring the first line of sellers (labeled “beginning of supply”).
🟢 My Expectation:
I expect AAPL to pull back to around $206 before catching a bid. As long as price holds above $199, buyers remain in control. In this range, I anticipate further accumulation by bulls.
🔸 Take Profit Levels:
• First TP: Just before the major selling cluster around $218
• Final TP: Deep inside the seller zone near $223
⸻
📊 Follow for more short-term analysis. This week, we’re covering both short- and long-term views of the MAG 7.
⸻
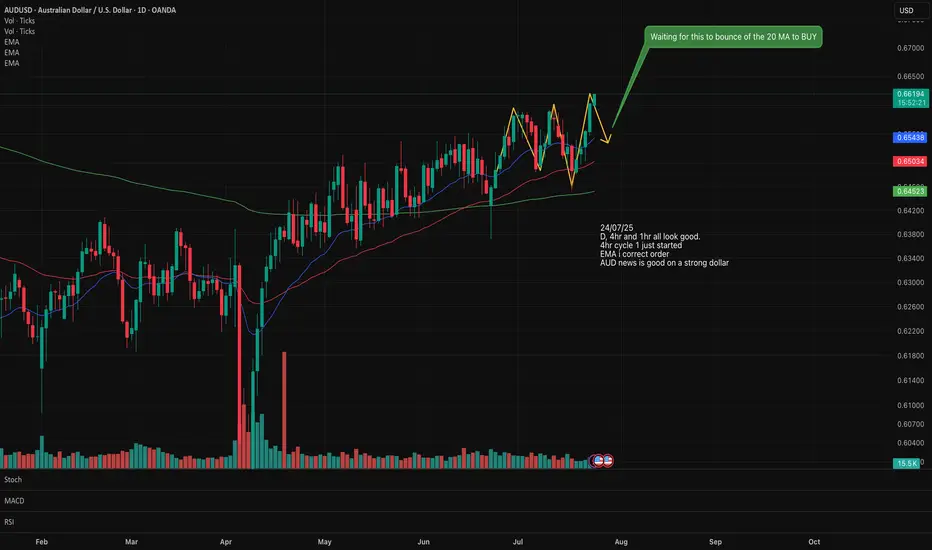
AUS/USD Long/Buy setting upLooking at AUS/USD for a potential Buy setting up on the Daily and 4 hr.
EMA has lined up in the correct stacking order.
An upward trend can be observed. The 20 has crossed over the 50.
We are starting a new Cycle 1 on the upward so I will wait for the pull back to the 20MA which will form the Cycle 2 then wait for the new Cycle 1 on the upward to start again before I buy in.
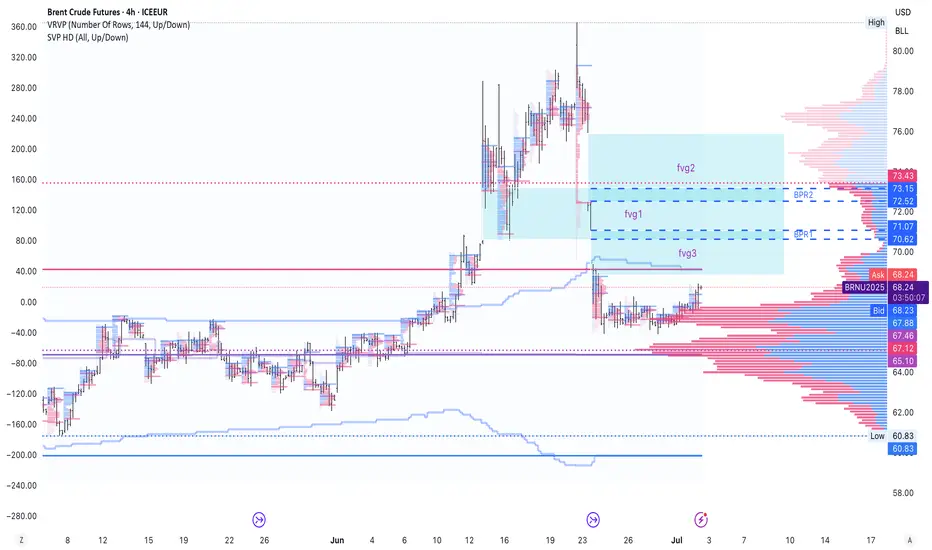
to identify BPRs on Brent Oil FuturesI am not good at the ICT price action style. So I got 2 questions for traders that know this well.
1. Did i draw the correct BPRs? I use both bars and volume profile to filter FVGs
2. Do you only use BPRs to do after break trend following or position closing, or you can actually use them in resistance reversal entry?
Need your help and advice mates.
USD/JPY(20250724)Today's AnalysisMarket news:
U.S. President Trump continued to lash out at the Federal Reserve on Tuesday, but seemed to back off from the remaining plan to fire Chairman Powell. "I think he's doing a bad job, but he's going to be out of office soon anyway," Trump said in an exchange with reporters at the White House. "In eight months, he'll be out of office."
Technical analysis:
Today's buying and selling boundaries:
146.60
Support and resistance levels:
147.70
147.29
147.02
146.18
145.92
145.51
Trading strategy:
If the price breaks through 146.60, consider buying in, with the first target price at 147.02
If the price breaks through 146.18, consider selling in, with the first target price at 145.92

PLTR moving higherPLTR expected to move higher.
The price is bouncing off the 20MA and respecting it.
Making new higher/highs and higher lows.
Earnings is due shortly, which could have a negative impact to the price.
However, the long term outlook for the company is still strong.
Anyone else have thoughts on this stock?

Perfect profit on short position, long TP 3450#XAUUSD
Gold is in an upward trend from the daily chart. From the technical indicators, the SMA5-SMA10 moving averages are golden crosses, BOLL opens upward, the K line runs on the upper track of the daily Bollinger Band, and the MACD continues to increase, indicating that the bullish trend remains unchanged📈.
The approaching August 1st tariff deadline, coupled with uncertainties such as the Federal Reserve, provide short-term support for gold🔍.
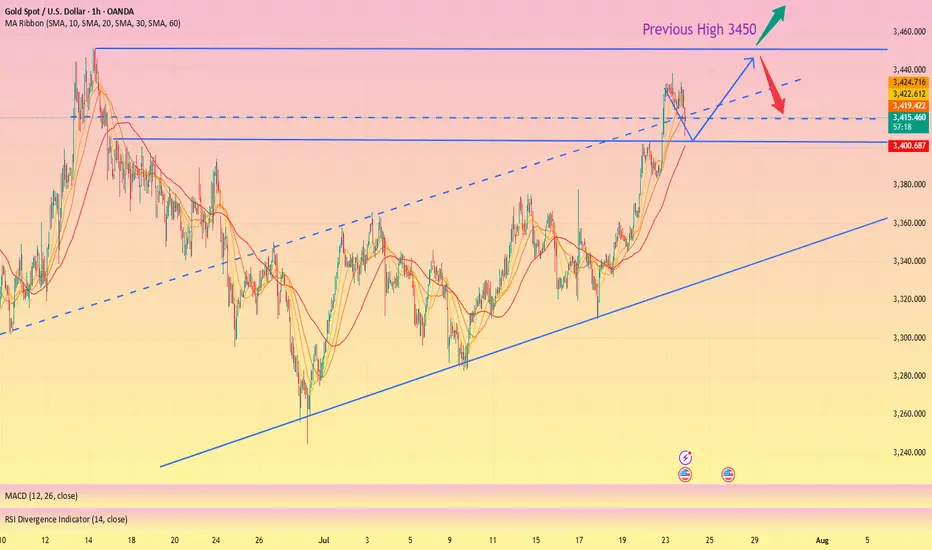
📊The current lower support is at 3410-3400. If it falls back to this level during the day, you can consider going long. Gradually check 3430 and 3440 on the upside, and pay close attention to the breakthrough of the 3450 level🏅. If it effectively breaks through 3450, gold is expected to break through the historical high. If it encounters resistance near 3450 as in the previous trend, you can consider shorting📉.
🚀BUY 3410-3400
🚀TP 3430-3440
The callback continuity is poor, and the bulls are still strong📰 News information:
1. Geopolitical situation
2. Tariff retaliation
📈 Technical Analysis:
Trump continued to lash out at the Fed, but seemed to have backed off on whether to remove Fed Chairman Powell. The continuous rise of the gold index, once close to 3440, also ushered in a new high in more than a month. Next, we need to pay attention to whether gold can reach the 3450 mark.
Judging from the daily chart, there were three times when it touched around 3450 and then fell back. If it breaks through and stabilizes above 3450 this time, the historical high of 3500 may be refreshed. If it cannot effectively break through 3450, the probability of subsequent retracement is still very high.
From the hourly chart, the bottom support is almost at 3405-3400. However, the recent rhythm belongs to the consolidation of the Asian and European sessions, the US session has begun to rise, and the risk of serious overbought data indicators is still there. This is why I told everyone in the morning that we need to be vigilant about the current rise. Waiting for a pullback to go long is relatively more stable. I also explained in the morning that if it falls below 3405-3400, the decline may continue to around 3385. After all, the fundamental purpose of our trading is to make a profit, so we must minimize the foreseeable risks to the greatest extent possible.
On the whole, if there is an obvious stop-loss signal at 3405-3400, you can consider going long and looking at 3450. Once it falls below 3400, don't chase it easily, and pay attention to the possibility of a retracement below 3385.
🎯 Trading Points:
BUY 3405-3400
TP 3440-3450
In addition to investment, life also includes poetry, distant places, and Allen. Facing the market is actually facing yourself, correcting your shortcomings, facing your mistakes, and exercising strict self-discipline. I share free trading strategies and analysis ideas every day for reference by brothers. I hope my analysis can help you.
FXOPEN:XAUUSD OANDA:XAUUSD FX:XAUUSD FOREXCOM:XAUUSD PEPPERSTONE:XAUUSD TVC:GOLD
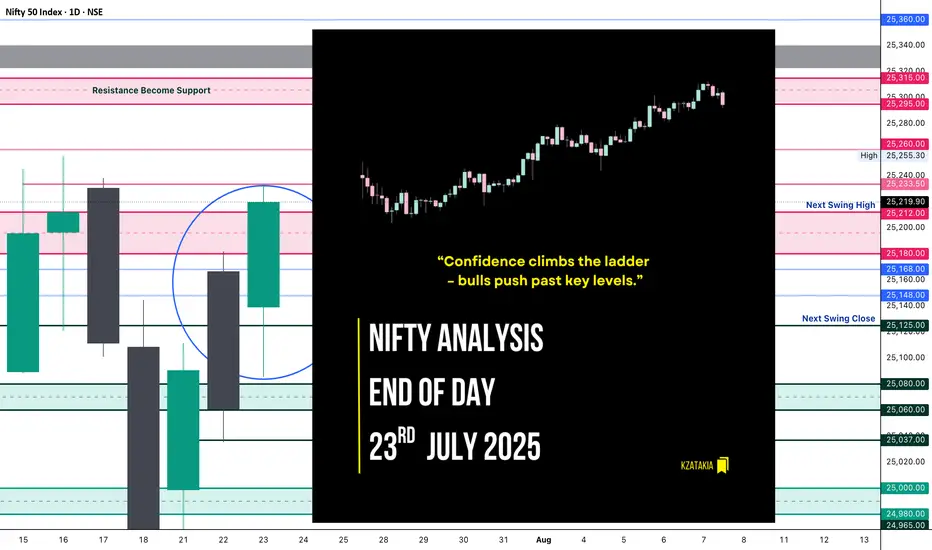
Nifty Analysis EOD – July 23, 2025 – Wednesday 🟢 Nifty Analysis EOD – July 23, 2025 – Wednesday 🔴
“Confidence climbs the ladder – bulls push past key levels.”
Nifty opened with a Gap Up of 78 points and initially retraced 54 points, finding solid footing around the CPR Zone. Once reclaimed VWAP, the index climbed in a methodical, low-volatility uptrend, breaking one resistance after another: CDH, R1, 25150, PDH, and the key zone 25200~25212 — finally touching the anticipated resistance at 25333, and closing just below that at 25219.90, close to the day’s high.
📌 Flashback from Yesterday's Note:
“If this is truly a retracement, 25K must hold in upcoming sessions, and bulls will need to reclaim 25,200 to regain their grip.”
👉 This expectation played out to perfection today — gradual yet confident bullish strength led Nifty to reclaim 25200 and close above it.
🔍 Today’s close of 25220 is higher than the last 7 sessions, suggesting a bullish shift in structure. However, bulls now face the real test — breaching the 25300 ~ 25350 resistance zone.
🕯 5 Min Time Frame Chart with Intraday Levels
🕯 Daily Time Frame Chart with Intraday Levels
🕯️ Daily Candle Breakdown
Open: 25,139.35
High: 25,233.50
Low: 25,085.50
Close: 25,219.90
Change: +159.00 (+0.63%)
Candle structure analysis:
Real body: Green body = 80.55 pts → strong bullish body
Upper wick: 13.60 pts → very small
Lower wick: 53.85 pts → moderate
Candle Interpretation:
The session opened stable, dipped to 25,085, but strong buyers showed up, helping price climb throughout the day and close near high. A firm green candle, signaling buyers in control.
Candle Type:
A Bullish Marubozu–like candle, not perfectly clean but represents strong continuation momentum.
Key Insight:
Close above 25200 confirms a bullish grip
If price holds above 25220–25250, next push could be towards 25280–25330
Immediate support now moves to 25,120–25,140
🛡 5 Min Intraday Chart
⚔️ Gladiator Strategy Update
ATR: 181.35
IB Range: 64.35 → Medium
Market Structure: Balanced
Trades Triggered:
⏱️ 10:45 AM – Long Entry → Trailing SL Hit (1:2.65 RR)
🔁 Support & Resistance Levels
Resistance Zones:
25,180 ~ 25,212
25,233
25,260
25,295 ~ 25,315
25,340 ~ 25,322 (Gap Zone)
Support Zones:
25,168
25,125
25,080 ~ 25,060
25,037
🧠 Final Thoughts
“Momentum is not magic—it’s built one level at a time.”
Bulls showed strength with control and consistency today. With 25200 reclaimed, they now hold the ball — next challenge lies at the gates of 25300–25350. Will they break through or pause for breath? Tomorrow holds the answer.
✏️ Disclaimer:
This is just my personal viewpoint. Always consult your financial advisor before taking any action.
Gold is surging, can it hit 3500?Due to the trade tensions caused by tariffs and the continued conflict between the White House and the Federal Reserve, gold continued to rise, and the current highest has reached around 3438. Obviously, after gold rose strongly and broke through the 3400 and 3420 areas, the bullish sentiment of gold has been ignited. Next, we need to pay attention to whether gold can test and stand firm at 3450.
Gold is currently extremely strong, and there is basically no room for retracement during the rise. As gold rises, the short-term support below has also moved up to the 3415-3405 area; and the upper side needs to pay attention to the breakthrough of the 3450 mark. If gold continues to break through 3450, then gold has the potential to challenge 3500 again; however, if gold still cannot effectively break through when it touches the area near 3500 again, the sentiment of gold cashing out and leaving the market may be stimulated, resulting in gold There may be room for retracement in the short term. If gold falls below 3400 during the retracement, the decline may continue to the 3395-3385 area.
Therefore, for the next short-term trading, we can first wait for the opportunity for gold to pull back, and then consider going long on gold with the 3415-3405 area as support; if gold does not give a chance to pull back, then when gold first touches the area around 3440-3450, we can consider starting to short gold.
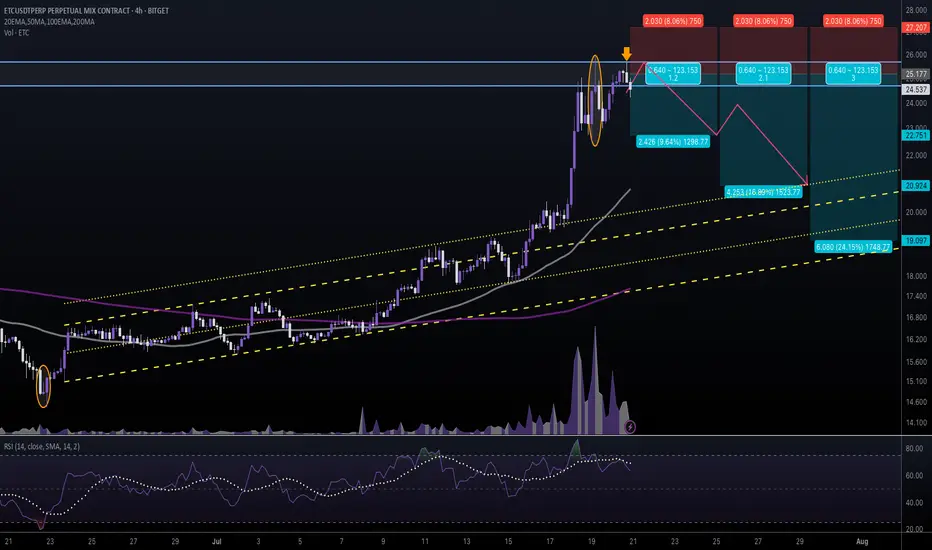
#ETCUSDT #4h (Bitget Futures) Ascending channel retestEthereum Classic printed two evening stars in a row, looks locally topped and ready for correction towards 50MA & 200MA supports.
⚡️⚡️ #ETC/USDT ⚡️⚡️
Exchanges: Bitget Futures
Signal Type: Regular (Short)
Leverage: Isolated (5.0X)
Amount: 5.0%
Entry Zone:
24.679 - 25.675
Take-Profit Targets:
1) 22.751
2) 20.924
3) 19.097
Stop Targets:
1) 27.207
Published By: @Zblaba
CRYPTOCAP:ETC BITGET:ETCUSDT.P #4h #EthereumClassic #PoW #L1 ethereumclassic.org
Risk/Reward= 1:1.2 | 1:2.1 | 1:3.0
Expected Profit= +48.2% | +84.5% | +120.7%
Possible Loss= -40.3%
Estimated Gaintime= 1-2 weeks
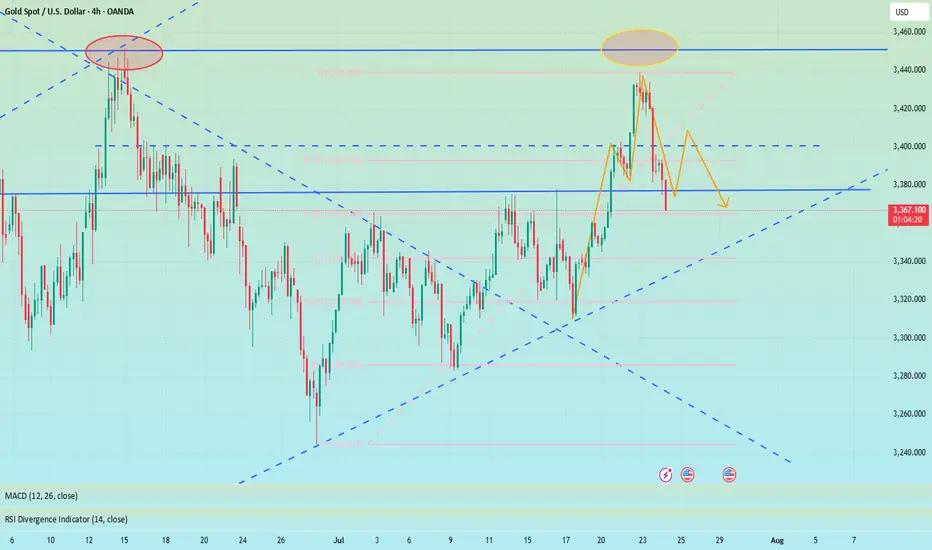
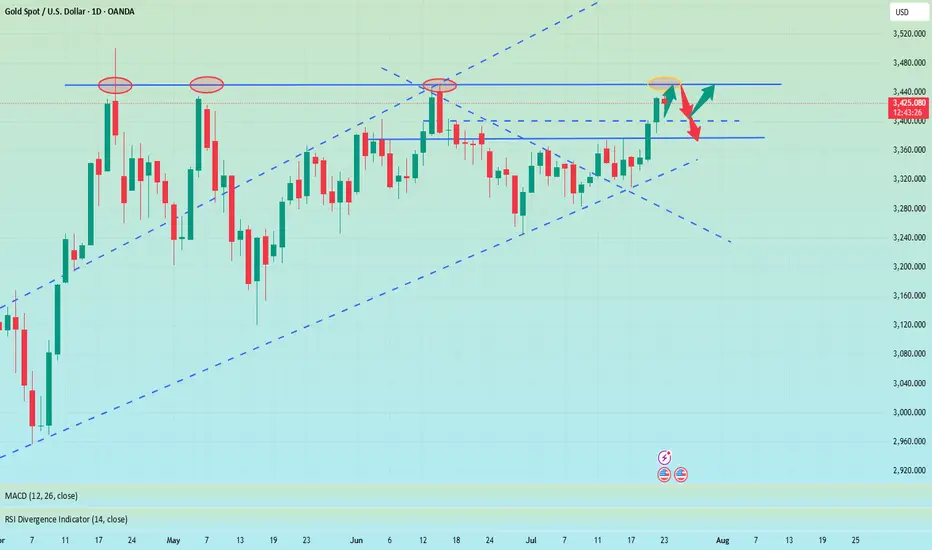
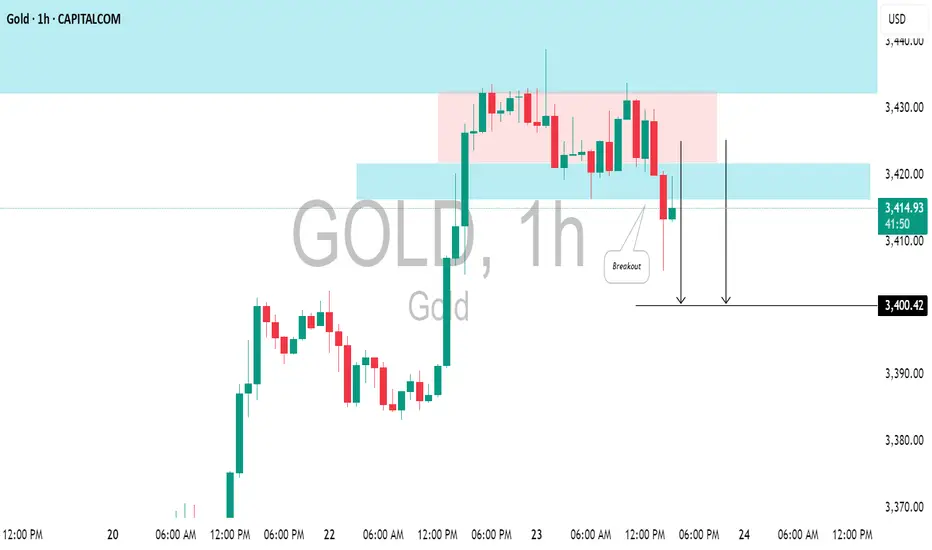
GOLD(#XAUUSD): Pullback From Resistance ConfirmedGOLD could retreat from the highlighted resistance level.
I observed a horizontal trading range pattern following a test of significant intraday resistance, along with a breach of its support level marked by a strong bearish candle.
Target - 3400.
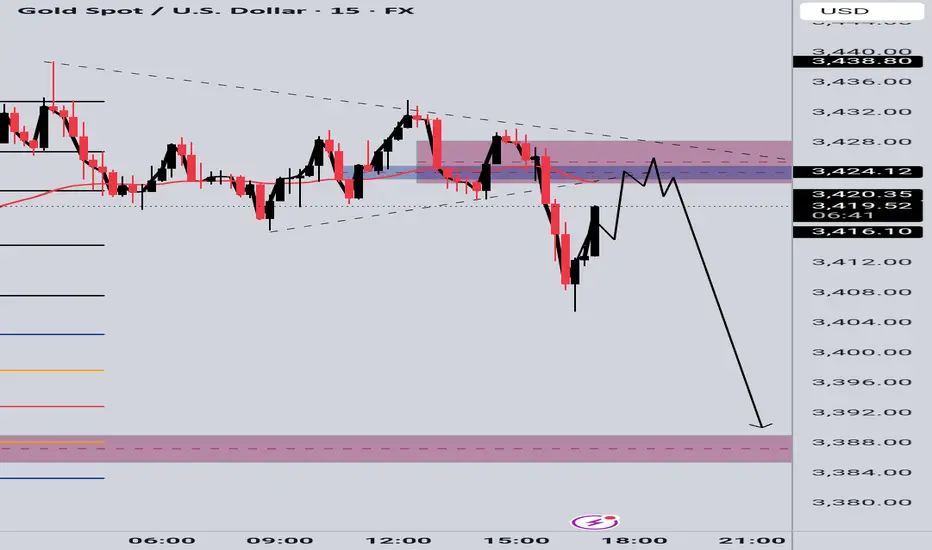
GOLD SELL SETUPWe failed the bullish momentum on previous chart ,now aiming for the continuation to the downside;
🔹 Entry Zone: 3425–3430 (Supply Rejection)
🔸 Trendline Break + Liquidity Sweep Confirmed
🎯 Targets:
— TP1: 3410
— TP2: 3388 (Major Demand Zone)
🔒 Bearish momentum building, watching for continuation toward the lower zone.
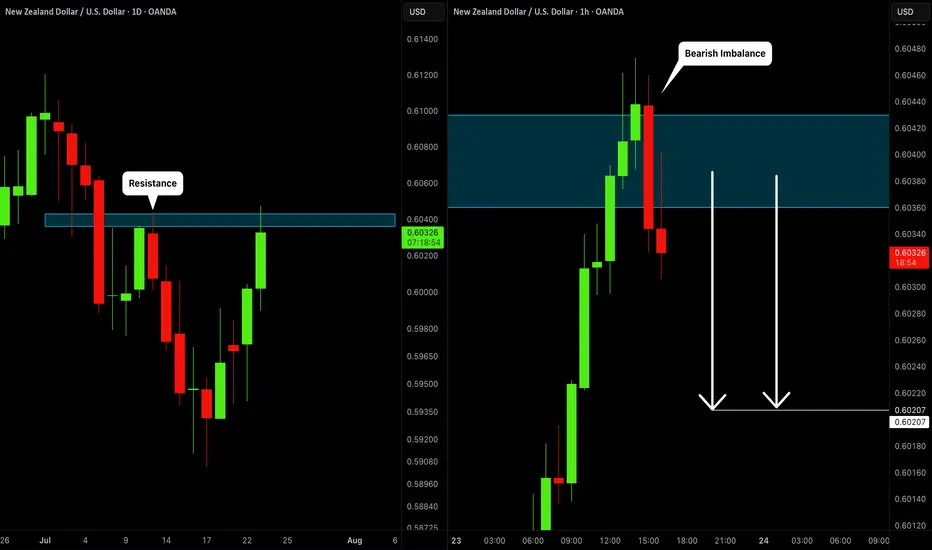
NZDUSD: Time For Pullback 🇳🇿🇺🇸
I think that NZDUSD will retrace from the underlined resistance.
As a confirmation, I spotted a bearish imbalance candle on an hourly time frame
after its test.
There is a high chance to see a retracement.
Goal - 0.602
❤️Please, support my work with like, thank you!❤️