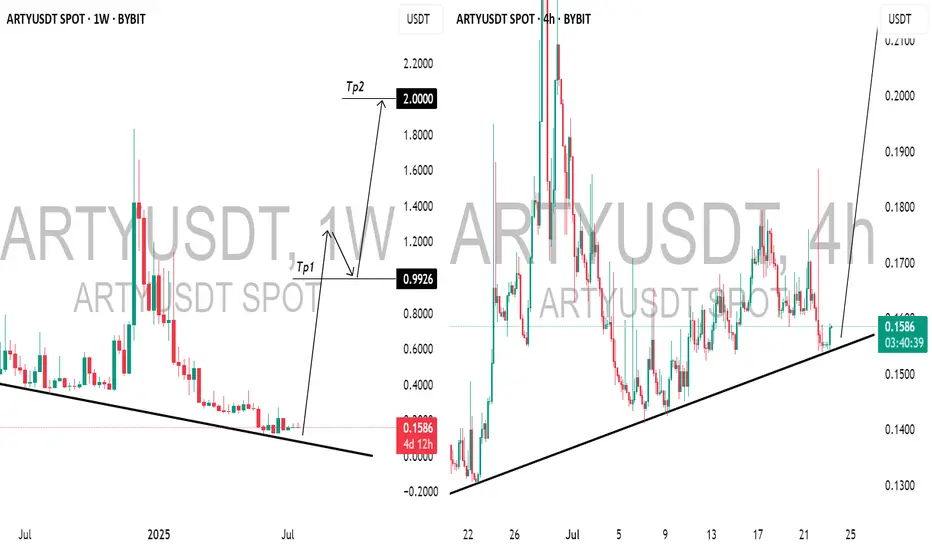
ARTFACT (ARTYUSDT): Bullish Outlook ExplainedThis morning, while analyzing 📈ARTY on a weekly chart, I noticed a promising bullish signal following a test of a falling trend line.
The price has been adhering well to a rising trend line on the 4-hour chart, and after a recent test, we observed a positive bullish reaction, prompting me to enter a long position.
Recently, early investors took profits from three years of staking, alleviating sell pressure. Additionally, Artyfact has introduced its first Play-and-Earn mode, which is expected to attract hundreds of thousands of new players.
This surge in interest will likely increase the demand for AMEX:ARTY and drive up its price, as players can only purchase gaming NFTs using $ARTY.
I believe the price has good potential to rise to 1.00 then to 2.00 soonest.
Candlestick Analysis
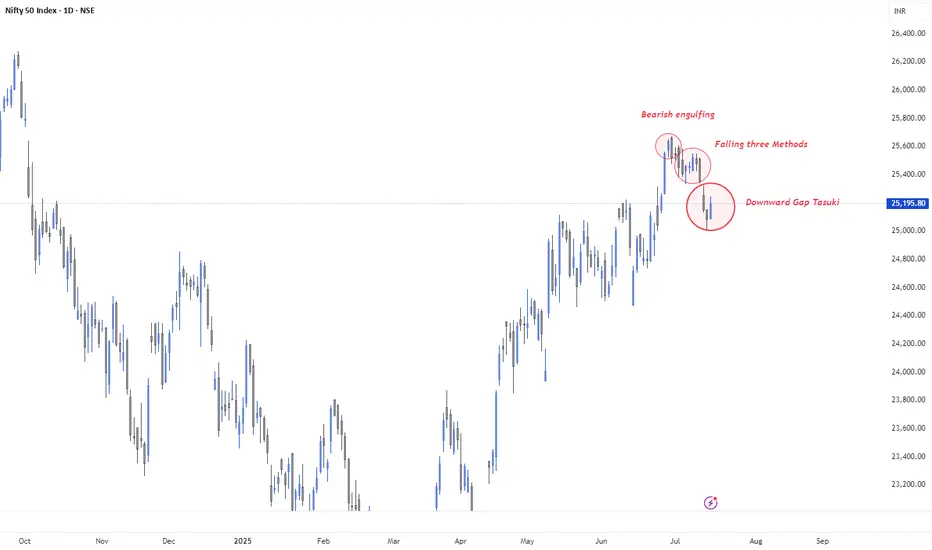
Candlestick Confluence: Bearish Signals in a Bullish Trend🔹 30 June – Bearish Engulfing
A large bearish candle fully engulfed the prior bullish day, forming at new highs (~25,790). Classic sign of distribution after an extended uptrend. This marked the beginning of the current corrective leg.
🔹 3 to 10 July – Falling Three Methods
After the initial drop, price consolidated in a tight range. Three small-bodied candles (4–9 July) signaled indecision. On 10 July, a strong bearish continuation candle confirmed the Falling Three Methods pattern — strengthening the downside move.
🔹 15 July – Downward Gap Tasuki
A bearish gap formed between 12–14 July. On 15 July, a small bullish candle emerged but failed to fill the gap — forming a Downward Gap Tasuki, a bearish continuation pattern. While this is typically a trend-continuation signal, it's forming within a primary uptrend, making follow-through uncertain.
🧠 Trend Context: Bullish Dominance Meets Short-Term Exhaustion
Despite these bearish candlestick formations, the broader trend from April remains structurally bullish. This confluence of reversal + continuation signals indicates:
Controlled profit-booking at highs
Low conviction from bulls near resistance
Possible mid-trend correction, not a trend reversal (yet)
🔎 Key Technical Levels to Watch
📉 Support Zones:
25,050: Immediate swing low (14 July)
24,850: Prior breakout zone
24,600: Horizontal support from mid-June
📈 Resistance Zones:
25,300 – 25,350: Gap resistance from 12–15 July
25,500: Key rejection zone from recent highs
25,650 – 25,700: All-time highs
⚠️ Market Psychology
Bulls are still in control on the higher timeframe, but the emergence of strong bearish patterns suggests hesitation at the top.
With Indian CPI easing and RBI’s neutral stance, macro still supports the bullish narrative — but the technical structure is flashing red flags in the short term.
🧾 Conclusion
"Nifty Spot has printed a sequence of reliable bearish candlestick formations — Bearish Engulfing (30 June), Falling Three Methods (3–10 July), and Downward Gap Tasuki (15 July). While these indicate short-term pressure, the broader uptrend remains intact. A close below 25,050 could trigger a deeper correction to 24,850–24,600. Bulls need to decisively reclaim 25,400+ to nullify the bearish setup and resume the uptrend."
#Nifty50
#NiftyAnalysis
#NiftyTechnicalAnalysis
#NSEIndia
#IndianStockMarket
#BearishEngulfing
#FallingThreeMethods
#TasukiGap
#CandlestickPatterns
#PriceAction
Simple Swing Trading Strategy with Smart Money Concept Explained
I will share with you the essential basics of swing trading forex gold with Smart Money Concepts.
You will learn how to do swing trading with the best SMC strategy.
I will teach you to c ombine order blocks, liquidity zones and imbalances to spot accurate entries and confirmation signals.
If you just started learning swing trading Forex with Smart Money Concepts, I strictly recommend trading with the trend only.
The cases and examples that we will discuss will be strictly trend-following ones.
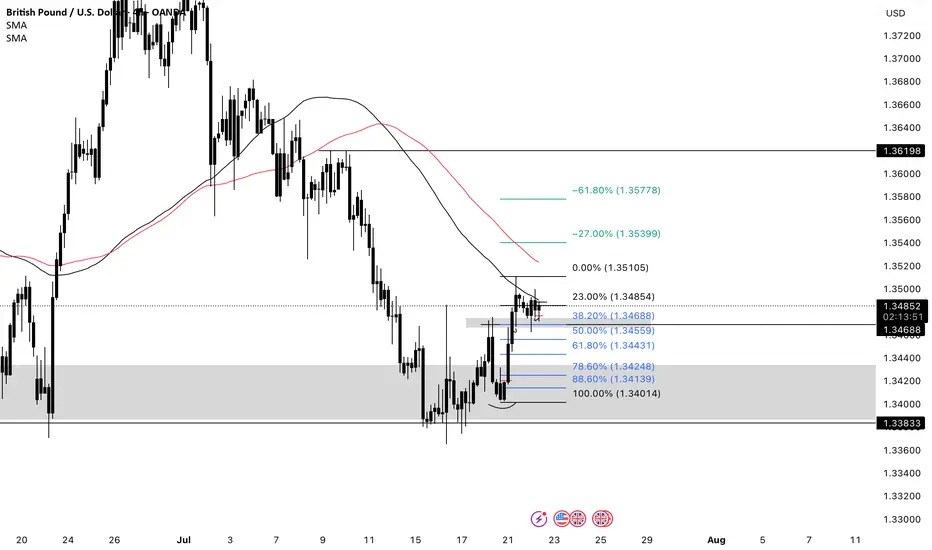
Swing Trading with SMC in Uptrend
For swing buying any forex pair, we will look for the market that is trading in a bullish trend.
To confirm that the market is rising, you will need to execute structure mapping and find a forex pair that updates Higher Highs HH and Higher Lows HL.
Above is the example how I confirmed that GBPUSD is bullish with structure mapping. You can see that the pair consistently updates the highs.
Once you identified a bullish pair, your next step will be to find the zone from where the next swing move will follow.
According to the rules, the market remains in uptrend till the price is staying above or on the level of the last Higher Low HL.
Here is such a zone on GBPUSD.
It is based on the last Higher Low and current price levels.
We will assume that buying orders will concentrate within that area and from that a bullish rally will follow.
The problem is that this area is extremely wide, and we can not just buy randomly within.
Our next step will be to find liquidity zones within.
To buy, we need demand areas.
I found 4 price action based historic demand zones on GBPUSD.
We will need to wait for the test of one of these zones and then wait for an order block - a place where smart money are placing their buy orders.
The problem is that we don't know in which of these areas the order block is, so we will need to wait for tests of these zones and a consequent imbalance to confirm it.
To confirm a bullish imbalance for swing trading Forex, I recommend analyzing a 4H time frame after a test of a demand zone.
According to Smart Money Concepts, a bullish imbalance can be any sign of strength of the buyers : bullish breakout of a vertical/horizontal resistance, change of character, high momentum bullish candle, bullish price action pattern, etc.
An order block on GBPUSD was confirmed with a breakout of a resistance line of a falling channel on a 4H time frame.
That was the signal that Smart Money are buying, and that is your signal to open a swing long trade.
You place a buy position then with a stop loss below the order block and a target - at least a current high.
Swing Trading with SMC in Downtrend
For swing selling any forex pair, you will need to find a market that is trading in a bearish trend.
I suggest applying structure mapping to identify such a pair.
It simply should update Lower Lows LL and Lower Highs consistently.
USDCAD is trading in a bearish trend.
Structure mapping helps to easily confirm that.
Then, we will need to identify the zone from where the next bearish wave will start.
According to Smart Money Concepts structure mapping rules, the market remains bearish till the price is staying below or on the level of the last Lower High LH.
That's such a zone on USDCAD.
It is based on current prices and the last Lower High.
We will assume that selling orders will be distributed along the entire lenth of our zone.
Of course, we can not sell randomly within that zone because it is relatively extended.
Our next task will be to find liquidity supply zones within.
I found 2 price action based supply zones within our underlined area.
Before we sell, we will need to find an order block.
A place from where smart money are selling big.
To spot that, I suggest waiting for a test of one of our supply zones and wait for a bearish imbalance on a 4H time frame.
According to SMC, a bearish imbalance can be a bearish high momentum candle, a bearish CHoCH, a bearish price action pattern, a bearish breakout of a horizontal/vertical support , etc.
You can see that a lower supply zone was tested on USDCAD.
Our bearish order block confirmation is a bearish Change of Character, a formation of a high momentum bearish candle and a breakout of a rising trend line.
After that we can open a swing sell position and expect a bearish movement at least to a current low.
Stop loss should lie strictly above the order block.
TP should be at least a c urrent low.
That is how a trade should be executed on USDCAD pair.
Remember that there is no guarantee that the order block will be within a liquidity zone. You should learn to track the signs of smart money and their operations.
A proper combination of a trend analysis, liquidity zones and order block is the essential basis of a profitable swing trading Forex.
Mastering that, practice recognizing the imbalances and confirmations for spotting the best swing trading entries.
❤️Please, support my work with like, thank you!❤️
I am part of Trade Nation's Influencer program and receive a monthly fee for using their TradingView charts in my analysis.
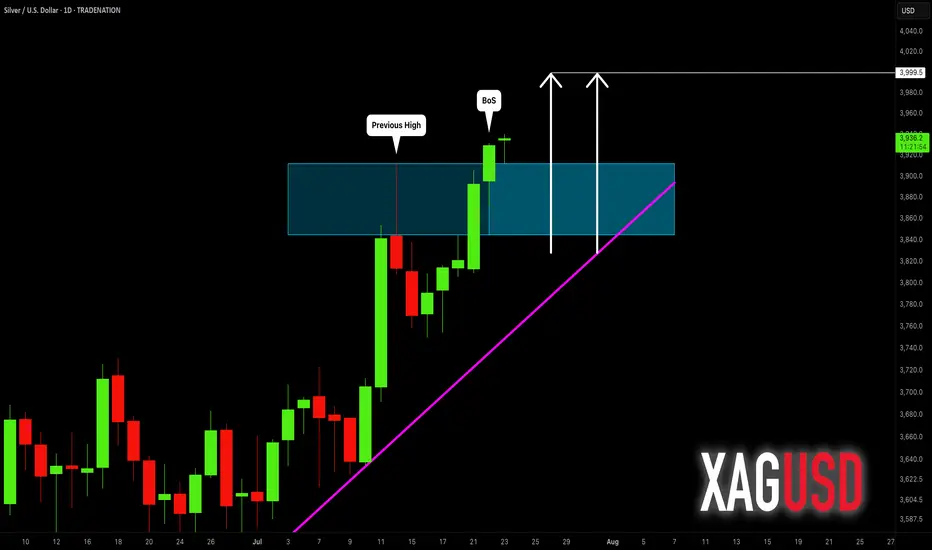
SILVER (XAGUSD): Confirmed Break of Structure
Silver updated a year's high yesterday, breaking a strong daily resistance.
With a confirmed Break of Structure BoS, we can expect that
the market will rise even more.
The next strong resistance is 40.
It is a round number based psychological level.
It can be the next goal for the buyers.
❤️Please, support my work with like, thank you!❤️
I am part of Trade Nation's Influencer program and receive a monthly fee for using their TradingView charts in my analysis
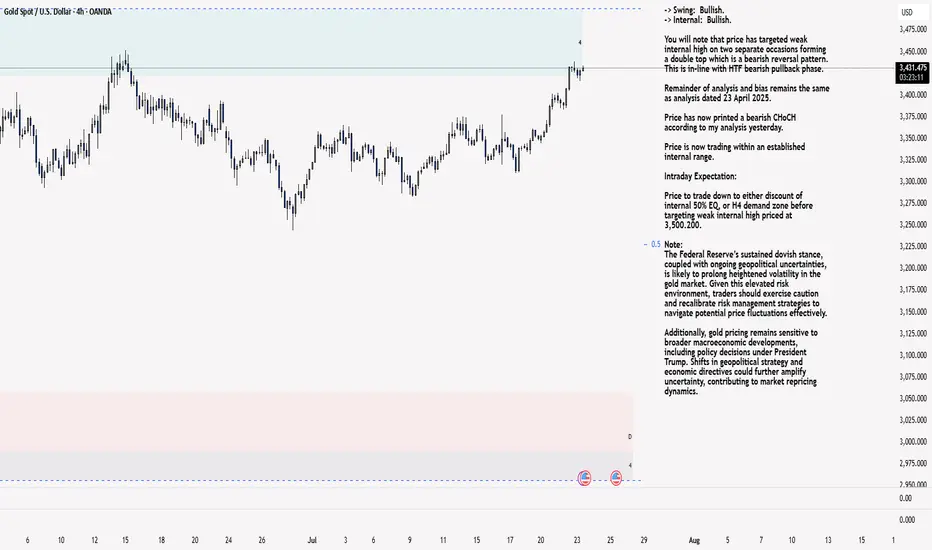
XAU/USD 23 July 2025 Intraday AnalysisH4 Analysis:
-> Swing: Bullish.
-> Internal: Bullish.
You will note that price has targeted weak internal high on two separate occasions forming a double top which is a bearish reversal pattern. This is in-line with HTF bearish pullback phase.
Remainder of analysis and bias remains the same as analysis dated 23 April 2025.
Price has now printed a bearish CHoCH according to my analysis yesterday.
Price is now trading within an established internal range.
Intraday Expectation:
Price to trade down to either discount of internal 50% EQ, or H4 demand zone before targeting weak internal high priced at 3,500.200.
Note:
The Federal Reserve’s sustained dovish stance, coupled with ongoing geopolitical uncertainties, is likely to prolong heightened volatility in the gold market. Given this elevated risk environment, traders should exercise caution and recalibrate risk management strategies to navigate potential price fluctuations effectively.
Additionally, gold pricing remains sensitive to broader macroeconomic developments, including policy decisions under President Trump. Shifts in geopolitical strategy and economic directives could further amplify uncertainty, contributing to market repricing dynamics.
H4 Chart:
M15 Analysis:
-> Swing: Bullish.
-> Internal: Bullish.
H4 Timeframe - Price has failed to target weak internal high, therefore, it would not be unrealistic if price printed a bearish iBOS.
The remainder of my analysis shall remain the same as analysis dated 13 June 2025, apart from target price.
As per my analysis dated 22 May 2025 whereby I mentioned price can be seen to be reacting at discount of 50% EQ on H4 timeframe, therefore, it is a viable alternative that price could potentially print a bullish iBOS on M15 timeframe despite internal structure being bearish.
Price has printed a bullish iBOS followed by a bearish CHoCH, which indicates, but does not confirm, bearish pullback phase initiation. I will however continue to monitor, with respect to depth of pullback.
Intraday Expectation:
Price to continue bearish, react at either M15 supply zone, or discount of 50% internal EQ before targeting weak internal high priced at 3,451.375.
Note:
Gold remains highly volatile amid the Federal Reserve's continued dovish stance, persistent and escalating geopolitical uncertainties. Traders should implement robust risk management strategies and remain vigilant, as price swings may become more pronounced in this elevated volatility environment.
Additionally, President Trump’s recent tariff announcements are expected to further amplify market turbulence, potentially triggering sharp price fluctuations and whipsaws.
M15 Chart:
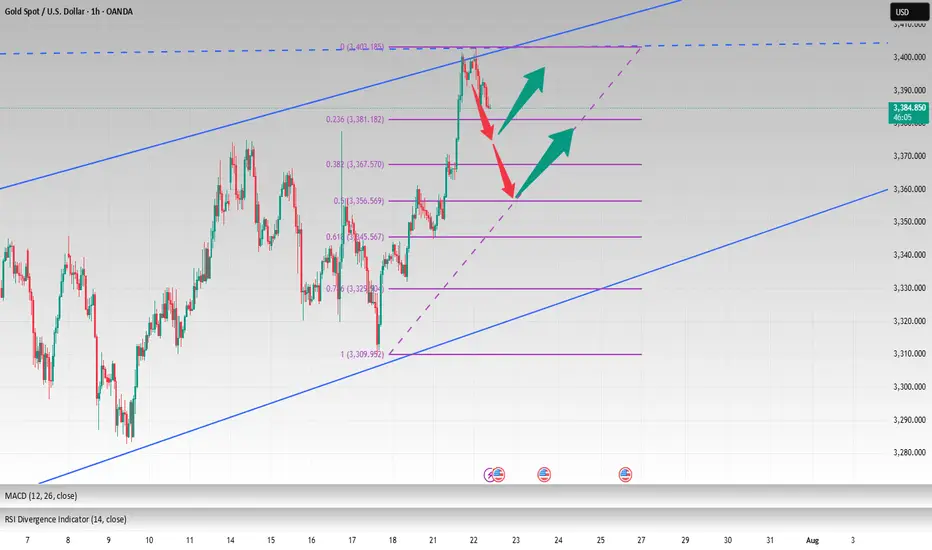
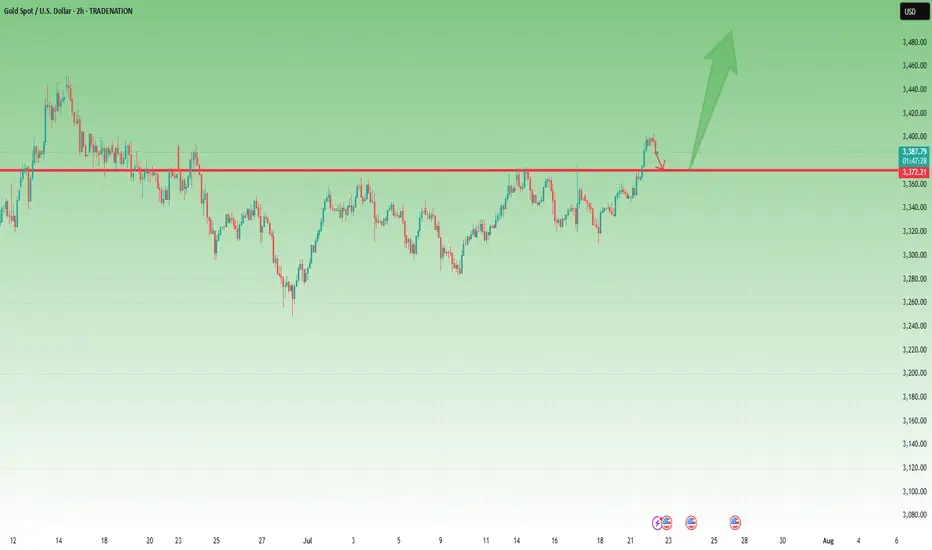
3400 has been reached, wait patiently for a pullback to go longGold opened on Monday with a volatile rise. After breaking through the 3360-65 area, the bulls turned strong. After breaking through the 3375~80 area in the evening, the bulls accelerated their rise, reaching the highest point of 3402. It fluctuated sideways in the late trading, and the daily line closed at around 3397 with a big positive line! Gold temporarily broke the small range oscillation pattern, but the bulls were not strong, and it still fluctuated upward.
From the perspective of the intraday cycle, after yesterday's rapid rise, the market fell into a serious overbought state; however, yesterday's $60 big positive line supported the bulls, and it is expected that the market will fluctuate; the next focus is still the 3400 mark area. The pressure in the 3400~05 area was dense last night, and adjustments may be made at any time before the breakthrough; and since the rise of 3282, it has just touched the upper edge of the parallel channel. The big sweep will continue, but the range is constantly changing!
So although gold broke the recent volatility yesterday and hit the 3400 mark with a big positive line; however, if it cannot stand above it, then it will continue to fall; recently we have repeatedly and many times emphasized the importance of the 3400 mark. If it stands here, the market will gradually rise to 3420~25 and break through to the 3450 area before looking for a decline.
Today we will continue to focus on the 3400 mark area. First, we will rush to the high altitude, with the goal of retracement to the 3375 and 3356 regional support platforms, and then pay attention to long opportunities; if the bulls stand above the 3400 mark, they will further bullishly impact 3420~25 and break through the 3450 area before falling back.
OANDA:XAUUSD
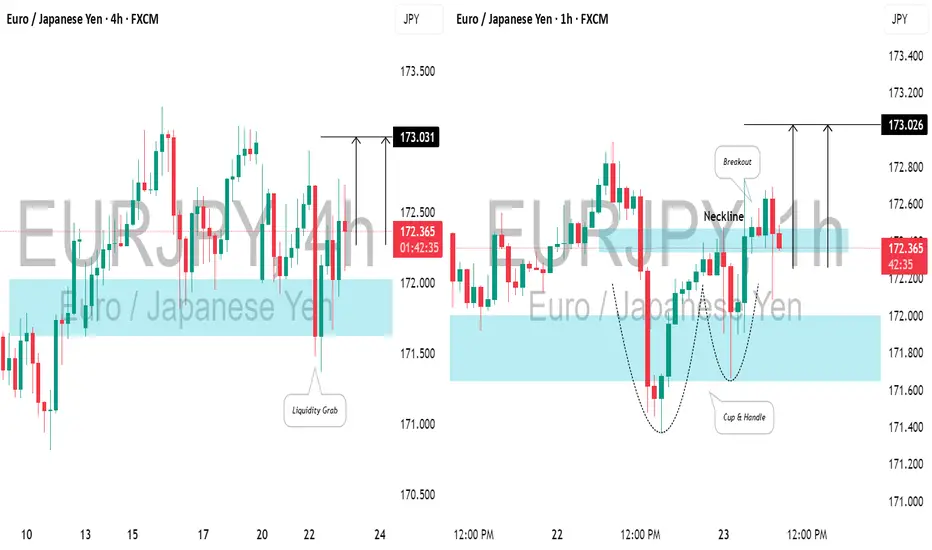
EURJPY: Bullish Move After Liquidity Grab📈EURJPY created a bearish high-range candle beneath a crucial support level in a horizontal trading range on the 4-hour chart.
However, a subsequent recovery and a bullish opening in the Asian session indicate a strong likelihood of an upward movement today, targeting 173.00.
EURJPY about to enter into a DowntrendRecently EURJPY reached high points in the chart at 173.016
From there it fell and continued downwards.
I took a quick demo trade with an inverse risk to reward. Not the ideal thing to do, but I didn't want to keep my TP higher than 173.016 since we know it's a strong resistance level.
Got a quick win there.
Now, on the 4H, we can see that one huge red candle look out the previous five green candles.
It indicates that selling pressure is incoming.
This would be a good time to sell now. But I do want to see price go below 171.540 just to get that extra confirmation. Just in case, price decides to consolidate or go high for a while.
Have to stay vigilant with this market now.
TP1 will be 171.100.
TP2 will be 170.000
TP3 will be 168.800
Lets see how this trade plays out.

AUDUSD Long - A BreakdownAfter a thorough breakdown, I decided to enter longs on AUD/USD. I expect for price to reach highs of around .65898 Which is the daily structure high Currently in profit On a long position and We entered on the 5 minute using a one hour stop loss Hopefully this trade continues to play out, and we'll see you on the other side of profit.

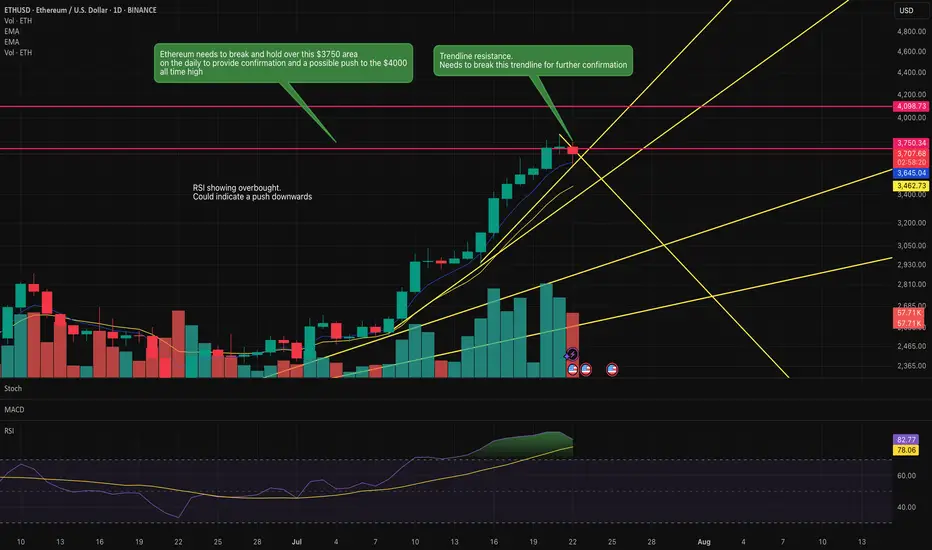
Is Ethereum going to push above this key resistance?Ethereum is knowcking against this key resistance area.
If it pushes above this $3750 area then it has a clear run to the previous all time highs of $4000.
RSI indicates overbought so it could indicate a reversal to the downside.
Key trendline is being honoured currently. However, a break of this trendline may indicate the move upwards to the previous all time high.
Watch this space over the next couple of days.
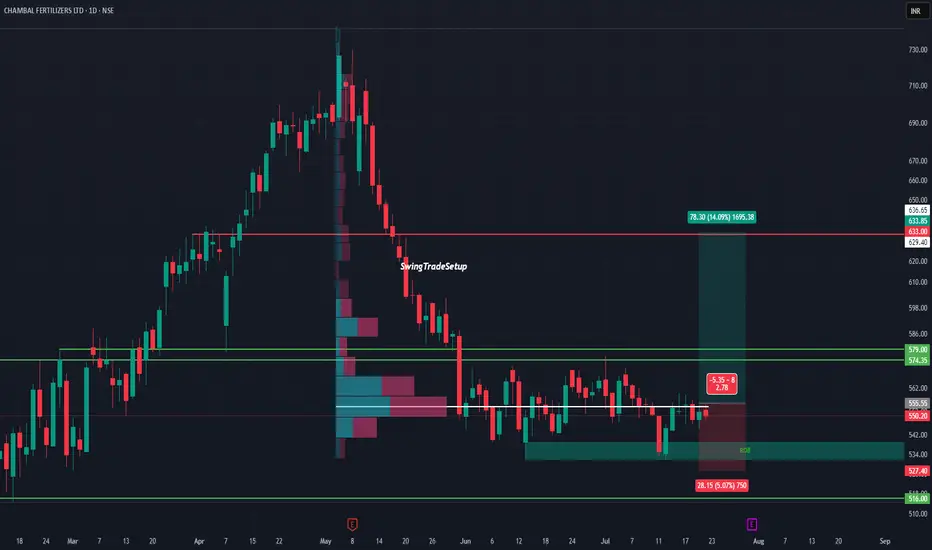
CHAMBAL FERTILISERS LTD – Potential Bottoming Out‽CHAMBAL at Demand Zone | Volumes story
After a steep fall from 730 to 516, Chambal is now consolidating in a critical demand zone backed by visible volume activity. This range has previously triggered price reversals, and now history might repeat.
The stock is respecting the support between 527–516, forming a potential base. On the upside, a clean breakout above ₹555.55 can unlock a near-term target of 633+, a move of over 14%.
The risk-to-reward ratio remains attractive with a tight invalidation below ₹527, while the volume profile suggests accumulation in this range.
Technical View :
• Major support: ₹516–527
• Breakout trigger: ₹555.55
• Upside target: ₹633–636
• Risk below: ₹527
• Volume profile: Dense node suggests buyer interest
Valuation :
• PE: ~10.3 (undervalued vs peers)
• Dividend Yield: ~6.5% (steady income potential)
• Promoter Holding: 60.62% (strong & stable)
• No recent equity dilution
• DII/FII: Activity neutral, could turn if technical align
A good mix of fundamentals, attractive valuation, and technical structure makes this a stock to keep an eye on. If it crosses ₹560 with volume, it may kick off a short-term trend reversal.
This chart is for educational use only and not a buy/sell recommendation.
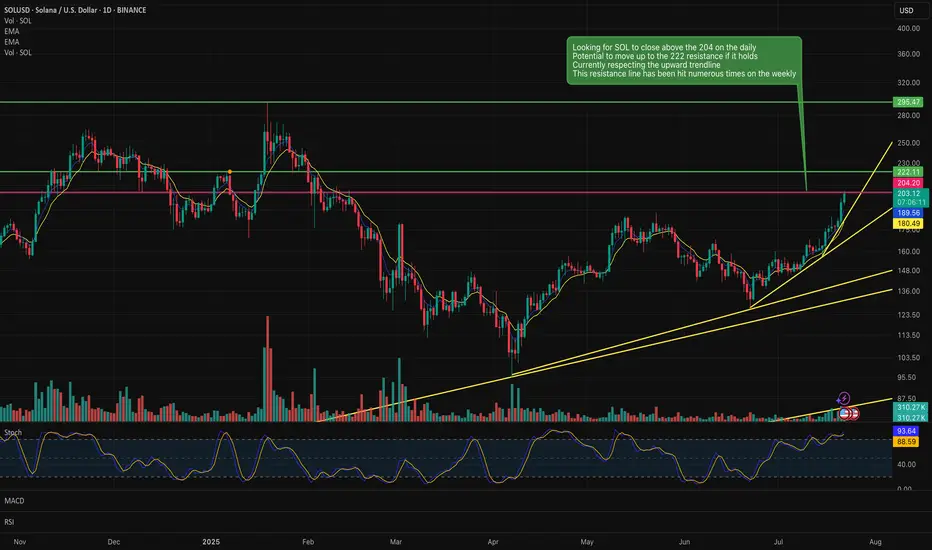
SOL holding above the 204 on the daily could be a long positionSOL is respecting the 204 on the daily and if it holds above it, we could have a long position buying opportunity.
Upside could be too the 222 resistance line if it holds above the 204.
Sentiment seems to be good for Sol and other strong alt coins at the moment. This also supports and upside trajectory.
Bulls are still the main theme, 3400 is not the high point📰 News information:
1. Fed Chairman Powell delivers a welcome speech at a regulatory conference
2. The tariff deadline is approaching
📈 Technical Analysis:
Today's opening high reached around 3402, and did not effectively break through the upper resistance of 3405-3415. As I said yesterday, a decline and return to the moving average is an inevitable result. The tariff issue is still there, with the deadline on August 1, and the daily MACD indicator still shows a golden cross. The general direction of short-term bullishness has not changed, but from a technical point of view, gold still has room to fall to correct the overbought part.
Below the day, we first focus on the top and bottom conversion position of 3377-3375. As time goes by, the 4H middle track will probably resonate with the 50% position of the Fibonacci line at 3355, which is also a good long position I expect. Therefore, if the price falls back to 3380-3375 for the first time during the day, you can consider going long. If the price continues to fall, pay attention to the second opportunity to go long at 3355, with the target at 3390-3410.
🎯 Trading Points:
BUY 3380-3375
TP 3390-3410
BUY 3360-3350
TP 3370-3380
In addition to investment, life also includes poetry, distant places, and Allen. Facing the market is actually facing yourself, correcting your shortcomings, facing your mistakes, and exercising strict self-discipline. I share free trading strategies and analysis ideas every day for reference by brothers. I hope my analysis can help you.
TVC:GOLD PEPPERSTONE:XAUUSD FOREXCOM:XAUUSD FX:XAUUSD OANDA:XAUUSD FXOPEN:XAUUSD
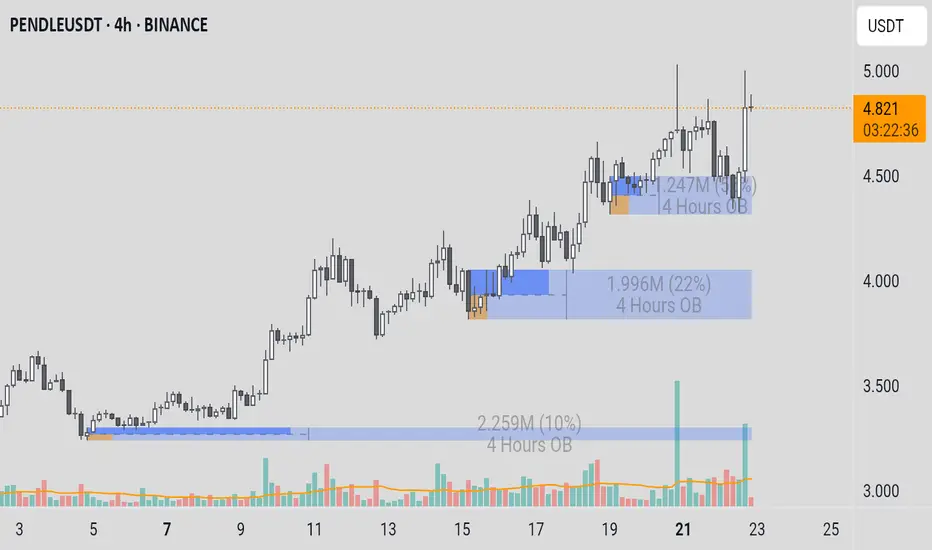
PENDLEUSDTDetailed Analysis of PENDLE/USDT 4-Hour (4h) Chart
Here is a structured insight and interpretation of the PENDLE/USDT chart as of July 22, 2025, to support trading decisions.
1. Chart Type and Instrument
* Chart Type: The presented chart is a Candlestick Chart.
* Instrument: The traded asset is PENDLEUSDT on the Binance exchange.
* Timeframe: The analysis is conducted on the 4-Hour (4h) timeframe, which is ideal for identifying short to medium-term trading opportunities (swing trading).
2. Identification of General Trend
This chart clearly displays two contrasting trend phases:
* Downtrend and Accumulation (Late June - Early July): In the first half of the chart, PENDLE was in a downtrend, which then slowed down and transitioned into a consolidation or accumulation phase around the $3.100 - $3.400 price level. The price failed to make a new low, signaling a weakening of selling pressure.
* Strong Uptrend (Starting July 9 - Present): Around July 9, a significant trend reversal occurred. The price successfully broke out of the accumulation zone and initiated a very strong and structured uptrend. This is confirmed by a consistent series of higher highs and higher lows.
3. Support and Resistance Levels (based on Order Blocks)
The chart analyst has marked key levels using the Order Block (OB) concept, which indicates zones of high liquidity.
* Support (Demand Zone):
* $4.500 - $4.700 (Blue OB): This is the nearest and most relevant support zone at the moment. The price is currently consolidating just above this area after an impulsive upward move.
* $3.900 - $4.100 (Blue OB): This was a crucial previous support zone. The price bounced strongly from this area around July 18-19, which became the launchpad for the move to the current level.
* $3.100 - $3.250 (Blue OB): The foundation of the entire uptrend. This is the origin demand zone where buying pressure first took dominant control.
* Resistance (Supply Zone):
* $5.300 - $5.600 (Orange OB): This is the major resistance zone above the current price. This area is likely the primary target for buyers and represents a significant hurdle where selling pressure is expected to increase.
4. Price Patterns and Key Events
* Market Structure Shift (July 9): The strong upward price movement on July 9 definitively broke the previous downtrend structure. This was the first and most important signal that market sentiment had shifted from bearish to bullish.
* Bullish Consolidation: The current price action (July 21-22), which is moving sideways above the $4.500 support zone, is forming a bullish consolidation pattern. This pattern is often a pause phase where the market "takes a breath" before continuing its primary trend.
* Respecting Demand Zones: The chart shows that the price highly respects the marked demand zones. Each time the price corrected back to one of the blue zones (Order Block), buyers stepped in and pushed the price higher, confirming the strength of these zones.
5. Use of Technical Indicators
* Volume: A noticeable increase in volume occurred during the initial breakout (around July 9) and on each subsequent impulsive upward leg. This indicates strong participation and commitment from buyers, which validates the strength of the uptrend.
* Order Blocks (OB): The primary indicator on this chart is the visualization of the Order Block zones. The blue zones (Demand) act as support floors, while the orange zone (Supply) acts as a resistance ceiling. The success of this strategy relies on the price reaction upon entering these zones.
Rationale for Entry Decision (Case Study)
Based on the current market conditions on the chart, a logical entry opportunity (buy position) can be considered based on the consolidation pattern above the support.
An entry could be made around the $4.700 - $4.850 level for the following reasons:
* Following the Dominant Trend: A buy position aligns with the primary trend, which is strongly bullish, thereby increasing the probability of a successful trade.
* Confirmation of Strong Support: The price is currently holding firm above the demand zone (Demand OB) at $4.500 - $4.700. This indicates that buyers are successfully absorbing selling pressure and defending a new, higher support level.
* Continued Accumulation Pattern: The current price consolidation can be interpreted as a re-accumulation phase before the next leg up. Entering during this phase allows a trader to get in before the next potential impulsive move.
* Defined Risk Management: A buy position at this level allows for a clear and logical placement of a stop loss, for instance, just below the blue support zone (e.g., at $4.450). If the price breaks this level, the short-term bullish scenario would be invalidated.
* Favorable Risk/Reward Ratio: With a defined risk, the primary profit target is the overhead resistance zone at $5.300 - $5.600. This offers a potential reward that is significantly greater than the risk.
Risks and Factors to Watch For
* Consolidation Failure: There is a risk that this consolidation pattern fails and the price breaks down below the $4.500 support zone instead. If this happens, the price will likely seek lower support around the $4.000 level.
* Exhaustion (Market Fatigue): Although the trend is strong, a rapid ascent can lead to buyer exhaustion. Watch for signs of weakening momentum as the price approaches its previous high around $5.100.
* Major Resistance Ahead: The supply zone at $5.300 - $5.600 is a very significant obstacle. Traders should be wary of a potential sharp reversal or large-scale profit-taking in that area.
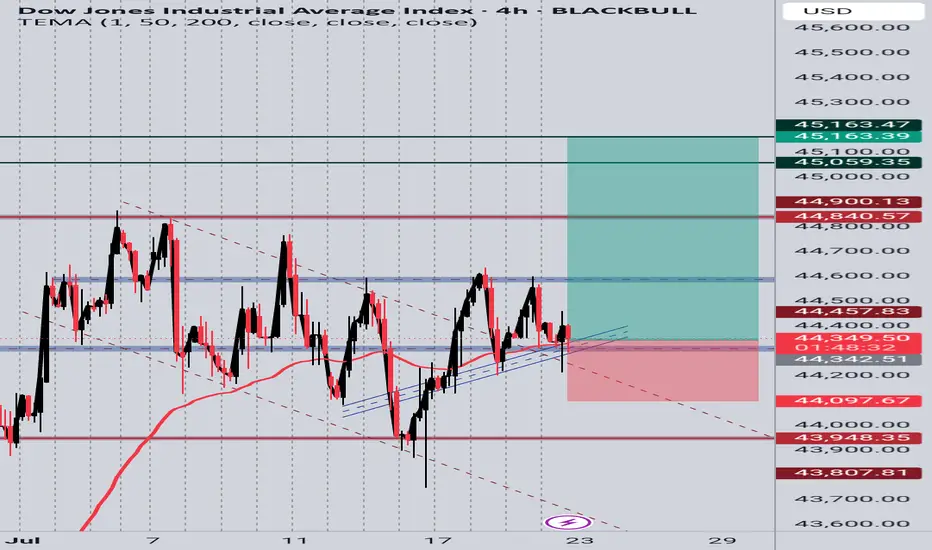
US30 4H Long SetupPrice is respecting a rising trendline and holding above a key support zone. After multiple rejections at the trendline and EMA bounce, current candle shows bullish intent. Targeting previous resistance zones around 45,059 and 45,163. SL placed below the trendline and recent structure low at 44,097. Setup based on structure support, EMA reaction, and potential bullish continuation.
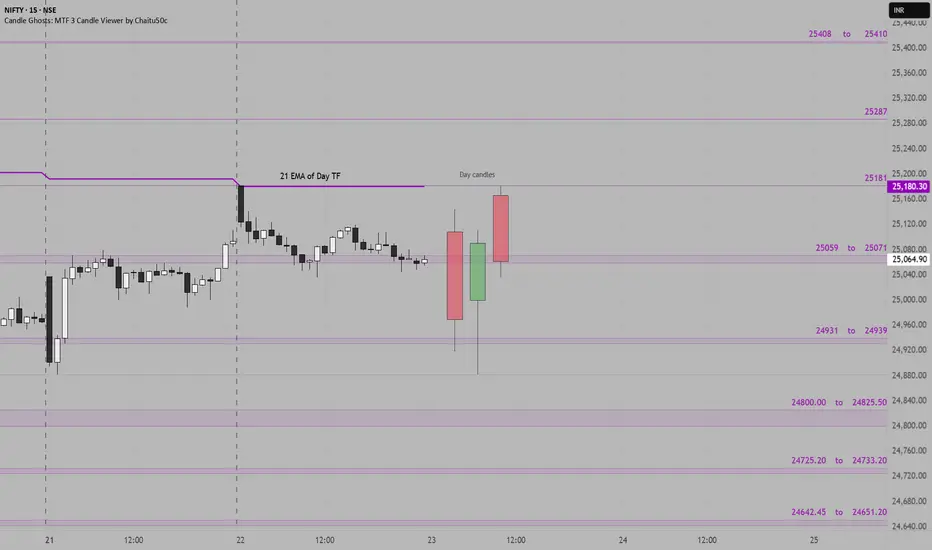
Nifty Support & Resistance Zones for 23rd July 2025The following support and resistance zones have been identified for Nifty based on recent price structure, candle reactions, and high-activity price clusters:
Resistance Zones:
25408 – 25410
25287
25181
25059 – 25071
Support Zones:
24931 – 24939
24800 – 24825.50
24725.20 – 24733.20
24642.45 – 24651.20
Yesterday Nifty formed a strong bullish day candle after testing support near 24800, showing signs of recovery. If the price holds above 25070, we may see a move toward 25181 and possibly 25287.
These levels act as potential zones of reaction and should be used with confirmation via price action or volume triggers during live market.
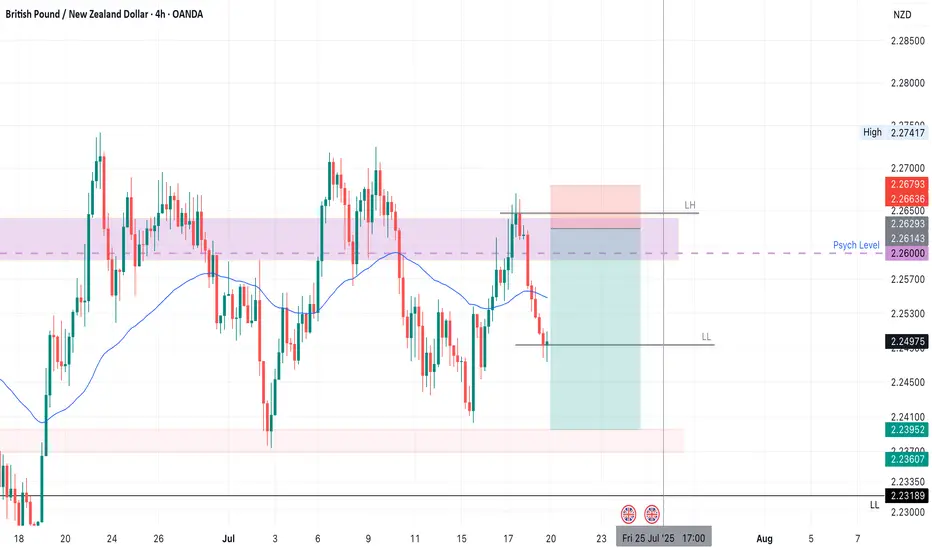
GBPNZD SHORT Market structure bearish on HTFs 3
Entry at both Weekly and Daily AOi
Weekly Rejection at AOi
Previous Weekly Structure Point
Daily Rejection at AOi
Around Psycholoogical Level 2.26000
H4 Candlestick rejection
Rejection from Previous structure
Levels 4.68
Entry 95%
REMEMBER : Trading is a Game Of Probability
: Manage Your Risk
: Be Patient
: Every Moment Is Unique
: Rinse, Wash, Repeat!
: Christ is King.
Don't chase the bullish trend,wait for the short position layout#XAUUSD
The tariff policy recently announced by the US government is undoubtedly the focus of the current gold market. Trump also tied the tariffs to the trial of former Brazilian President Jair Bolsonaro, adding to policy uncertainty. ⚖️
The implementation of the tariff policy may push up commodity prices, thereby exacerbating inflationary pressure, which is both an opportunity and a challenge for gold📊. On the one hand, rising inflation expectations may enhance the attractiveness of gold as an anti-inflation asset; on the other hand, the strengthening of the US dollar and US Treasury yields may offset this positive. 💡
At present, the lower support has moved up to the 3375-3365 area, where a top-bottom conversion position will be formed. The upper short-term resistance level is 3387-3393, the previous high. If the market touches this for the first time, you can try to see a double top fall.
🚀SELL 3385-3390
🚀TP 3365-3355
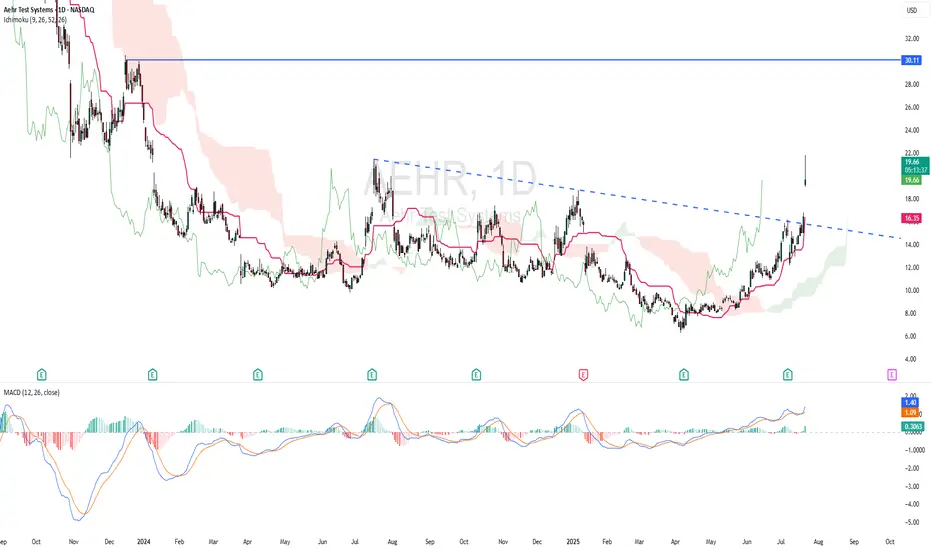
AEHR - RISING WINDOWTechnically AEHR is bullish as the stock made a strong rising window. Based on ICHIMOKU CLOUD, price is above cloud and chikou span is above candlestick - indicating bullish scenario. Kijun Sen is rising. MACD indicator showing bullish momentum.
ENTRY PRICE : 19.30 - 19.70
TARGET : 30.00 (potential almost 50% roi)
SUPPORT : 14.72
GBPUSD BUYS GU broke the previous LH and formed support. I’m waiting for price to break out of consolidation on the M15 and form more bullish pressure before entering longs towards 1.36200 area.
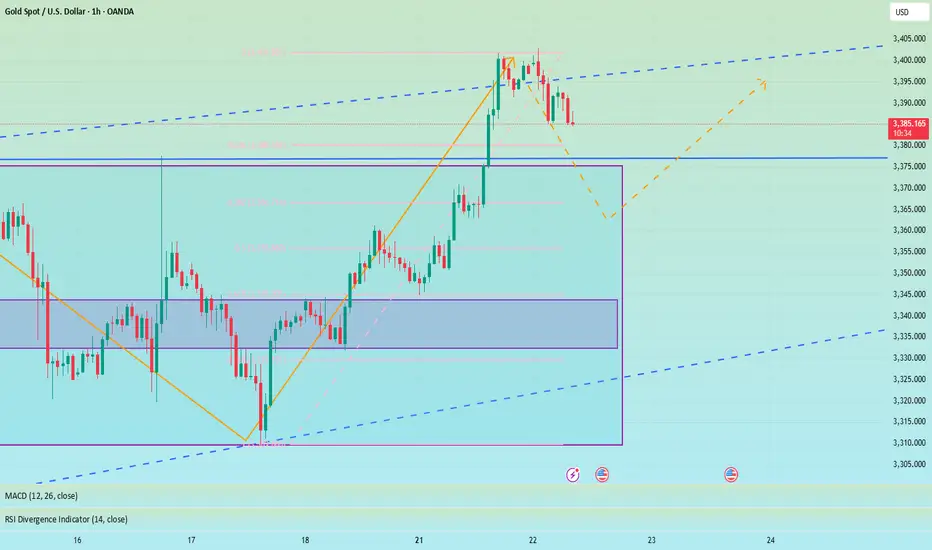
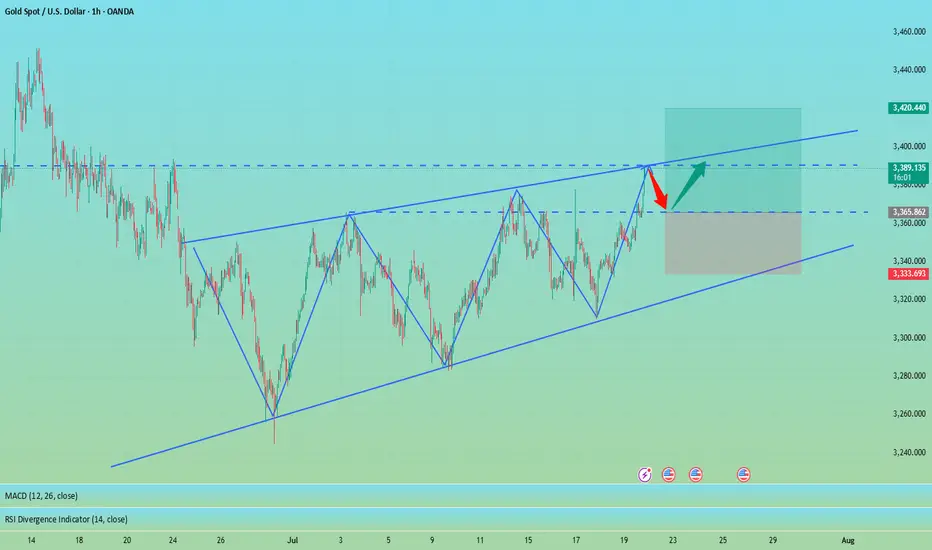
Gold - Above 3370 Is Bullish Territory – But 3360 Must Hold📆 What happened yesterday?
After more than a week of frustrating, sideways price action, Gold finally broke out above the key 3370 resistance zone.
The breakout was clean and impulsive, with TRADENATION:XAUUSD pushing to an intraday high around 3400.
Following that move, price printed a small double top near the high and began a modest correction — perfectly normal after such a breakout. At the time of writing, Gold trades at 3385, still holding above former resistance.
📈 Why this breakout matters:
The daily close at 3396 came in strong and near the top, leaving behind a clear Marubozu candle
This kind of price action signals conviction and momentum
The breakout confirms what I’ve been anticipating for days — the range is resolved, and the market is choosing the bullish path
🎯 What to expect next:
If price stabilizes above 3400, the road to 3450 opens — which is the target mentioned in my previous analyses
That area represents the next major resistance and likely magnet for price if bulls stay in control
🧭 Trading Plan:
For me, the plan is now simple:
✅ Buy the dips — especially on a potential retest of the 3370–3375 broken resistance, which now turns into support
❌ Negation comes only with a daily close below 3360, which would invalidate this breakout and raise questions
📌 Conclusion:
The breakout has finally come. After days of coiling, Gold chose the upside.
Momentum is building, structure is clean, and bulls are back in control — unless 3360 fails.
Until then, I remain bullish, looking to buy dips into strength. 🚀
Disclosure: I am part of TradeNation's Influencer program and receive a monthly fee for using their TradingView charts in my analyses and educational articles.
More Pain for Gold? The Charts Say It’s PossibleSince the start of the London market, gold has almost maintained a narrow range of fluctuations in the 3390-3385 area. Compared with yesterday, the market is much weaker today, and gold has failed to stabilize at 3400 several times, indicating that the sentiment of cashing out near this area is also very high. From the current gold structure, gold is obviously biased towards a long structure. Since gold broke through 3400, 3375-3365 has become the key support area after the top and bottom conversion in the short term.
However, gold rose strongly yesterday but did not stabilize at 3400. The bullish sentiment may no longer be strong. Moreover, after the accelerated rise in gold, the sustainability was not strong, so gold still needs to retreat in the short term. This is why I insisted on shorting gold again near 3400 yesterday. Therefore, I think gold has not yet retreated to the right level. I will pay attention to the opportunity to go long on gold after it pulls back to the 3375-3365 area.
Gold fell after touching 3400 twice. Whether a short-term effective "M" double top structure has been formed, I think more signals are needed to verify. However, in the short term, it is still under pressure in the 3405-3410 range, so if there is no major positive news, I think gold may maintain a wide range of fluctuations in the 3410-3360 range. Therefore, if gold rises to the 3400-3410 range again, I will continue to try to short gold!

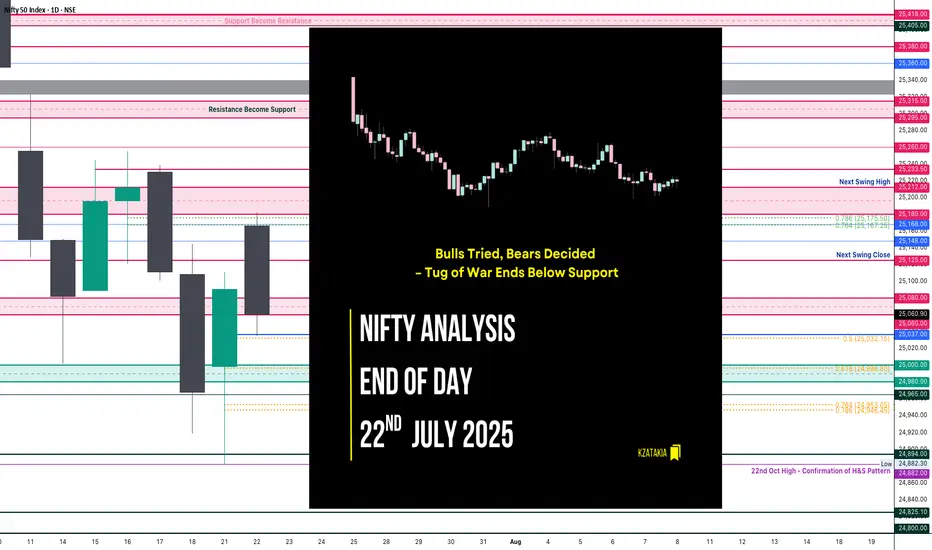
Nifty Analysis EOD – July 22, 2025 – Tuesday🟢 Nifty Analysis EOD – July 22, 2025 – Tuesday 🔴
"Bulls Tried, Bears Decided – Tug of War Ends Below Support"
Nifty opened with an 88-point gap-up, continuing the bullish sentiment, right at the resistance zone of 25,180 ~ 25,212. However, the market opened at the high (OH) and quickly slipped around 100 points to form the Initial Balance (IB). After a brief bounce back to the mean, it faced resistance, leading to a breakdown of IB and further losses of 77 points.
A supportive bounce emerged near 25,060 ~ 25,080, but the price was pushed down again by PDH + VWAP + R1. The day closed below PDC and under the support zone at 25,065, showing bearish dominance despite a volatile tug-of-war between bulls and bears.
Today’s low tested the 0.5 Fibonacci retracement level (from yesterday’s low to today’s high). If this is truly a retracement, 25K must hold in upcoming sessions, and bulls will need to reclaim 25,200 to regain their grip.
🕯 5 Min Time Frame Chart with Intraday Levels
🕯 Daily Time Frame Chart with Intraday Levels
📊 Daily Candle Breakdown
Open: 25,166.65
High: 25,182.00
Low: 25,035.55
Close: 25,060.90
Change: −29.80 (−0.12%)
Candle Structure:
Real Body: Red (−105.75 pts) → Decent bearish body
Upper Wick: 15.35 pts → Small
Lower Wick: 25.35 pts → Moderate
Interpretation:
Price opened strong but faced selling near 25,180, leading to a steady drop throughout the session. The lower wick shows some buying attempt near 25,035, but the close below open signals bears dominated.
Candle Type:
Bearish candle with moderate lower wick – resembles a Bearish Engulfing setup after a green candle, suggesting profit-booking or fresh selling.
Key Insight:
Sellers defending 25,180–25,200 firmly
Holding above 25,030–25,050 is critical; breaking this could retest 24,950–25,000
Bulls must reclaim 25,120–25,150 for momentum revival
🛡 5 Min Intraday Chart
⚔️ Gladiator Strategy Update
ATR: 182.32
IB Range: 92.6 → Medium
Market Structure: Balanced
Trades Triggered:
10:45 AM – Short Trade → Trailing SL Hit (1:0.8)
12:45 PM – Long Trade → SL Hit
📌 Support & Resistance Levels
Resistance:
25,080 ~ 25,060
25,125
25,168
25,180 ~ 25,212
Support:
25,037
25,000 ~ 24,980
24,965
24,894 ~ 24,882
24,825
24,800 ~ 24,768
🧠 Final Thoughts:
"Markets often dance between zones of power — where bulls flex and bears press. It's not chaos, it's the choreography of sentiment."
The 25,000–25,212 zone continues to be the battlefield. Let’s see who seizes the upper hand tomorrow.
✏️ Disclaimer:
This is just my personal viewpoint. Always consult your financial advisor before taking any action.