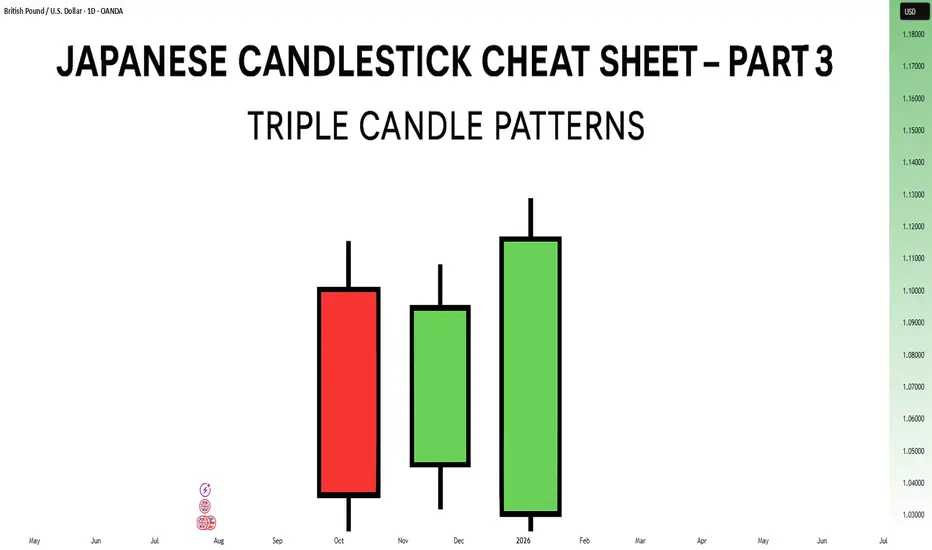
Japanese Candlestick Cheat Sheet – Part Three- 3 candle patternsSo far in this series, we've broken down single candle formations ( Part 1 ) and explored double candle signals ( Part 2 ) — the kind of patterns that give you quick, often powerful hints about the market’s mood.
But now it’s time to go a step further.
👉 In Part 3, we dive into triple candlestick formations — patterns that take more time to form, but often offer stronger confirmation and a more reliable narrative.
They’re like reading three full sentences from the market instead of just one or two words.
If you’re ready to spot momentum shifts (not noise), this lesson is for you.
Let’s decode the story behind formations like Morning Star, Three White Soldiers, and so on.
MORNING STAR
Bias: Bullish
What is the Morning Star pattern?
The Morning Star pattern consists of a bearish candle, a small-bodied middle candle, and a bullish candle, forming at the end of a downtrend to signal potential reversal. This pattern reflects a shift from seller dominance to buyer strength, as the middle candle marks a pause before a reversal. The Morning Star is a reliable signal that buyer interest is reemerging.
Understanding Morning Stars helps traders anticipate shifts in momentum, providing valuable entry points for new uptrends.
Meaning:
Found in downtrends; signals potential bullish reversal as buyers gain control, with strength confirmed by the third candle closing above the first.
BULLISH ABANDONED BABY
Bias: Bullish
What is the Bullish Abandoned Baby pattern?
The Bullish Abandoned Baby is a rare but powerful reversal pattern that consists of a bearish candle, a gapped doji, and a bullish candle. The middle doji reflects indecision, while the third bullish candle confirms the reversal. This pattern highlights a dramatic shift in sentiment, showing that buyers are prepared to take control.
Recognizing the Bullish Abandoned Baby can offer traders insights into pivotal market shifts.
Meaning:
Appears in downtrends; suggests a strong bullish reversal, as the middle doji shows indecision, with confirmation by a strong bullish move.
THREE WHITE SOLDIERS
What is the Three White Soldiers pattern?
The Three White Soldiers pattern consists of three consecutive bullish candles, each closing higher than the last, often appearing in downtrends to signal a potential bullish reversal. This pattern reflects sustained buying pressure, indicating that buyer sentiment is strong. Psychologically, it shows that buyers are steadily gaining confidence, pushing prices upward.
For traders, Three White Soldiers provide a clear signal of momentum, ideal for capturing emerging trends.
Meaning:
Found in downtrends; signals potential trend reversal, showing sustained buying strength, often signaling the start of a bullish trend.
MORNING DOJI STAR
What is the Morning Doji Star pattern?
The Morning Doji Star pattern is similar to the Morning Star, but with a doji as the middle candle, indicating greater indecision before a reversal. This pattern consists of a bearish candle, a doji, and a bullish candle, highlighting a transition from bearish to bullish sentiment. The doji reflects a moment when market sentiment is balanced, but the third candle confirms a bullish shift.
Interpreting Morning Doji Stars can help traders identify turning points in downtrends, providing valuable entry opportunities.
Meaning:
Appears in downtrends; signals potential bullish reversal, with indecision from the doji and confirmation by a strong bullish candle.
EVENING STAR
What is the Evening Star pattern?
The Evening Star is a three-candle pattern that appears at the top of an uptrend, signaling a potential bearish reversal. It consists of a bullish candle, a small-bodied middle candle, and a bearish candle, showing a transition from buyer control to seller strength. This pattern often appears at market peaks, where optimism is giving way to caution.
Understanding the Evening Star pattern helps traders anticipate downtrend formations, allowing them to time their exits.
Meaning:
Found in uptrends; signals potential bearish reversal as sellers gain control, confirmed if the third candle closes below the first.
BEARISH ABANDONED BABY
What is the Bearish Abandoned Baby pattern?
The Bearish Abandoned Baby is the bearish counterpart to the Bullish Abandoned Baby and consists of a bullish candle, a gapped doji, and a bearish candle. This pattern reveals a dramatic shift in sentiment from bullish to bearish, highlighting a sudden reversal at the top of an uptrend.
Recognizing the Bearish Abandoned Baby can offer traders insight into market tops and impending trend changes.
Meaning:
Appears in uptrends; indicates strong bearish reversal, as indecision in the doji is followed by selling strength.
THREE BLACK CROWS
What is the Three Black Crows pattern?
The Three Black Crows pattern consists of three consecutive bearish candles, each closing lower than the last, appearing in uptrends to signal potential reversal. This pattern reflects sustained selling pressure, indicating that sellers are gaining control. The Three Black Crows highlight a moment when buyer confidence wanes, marking the beginning of downward momentum.
For traders, this pattern provides a clear signal to avoid buying into weakening trends or even entering short trades.
Meaning:
Found in uptrends; signals potential bearish reversal, with sustained selling pressure often marking the start of a downtrend.
EVENING DOJI STAR
What is the Evening Doji Star pattern?
The Evening Doji Star is similar to the Evening Star, but with a doji as the middle candle, highlighting greater indecision. This pattern consists of a bullish candle, a doji, and a bearish candle, indicating a shift from bullish to bearish sentiment. The doji suggests that buyers are losing control, with sellers prepared to reverse the trend.
Understanding Evening Doji Stars allows traders to recognize market tops, helping them avoid overextended trends.
Meaning:
Appears in uptrends; signals potential bearish reversal, as the doji suggests indecision, confirmed by strong selling on the third candle.
Candlestickanalisys
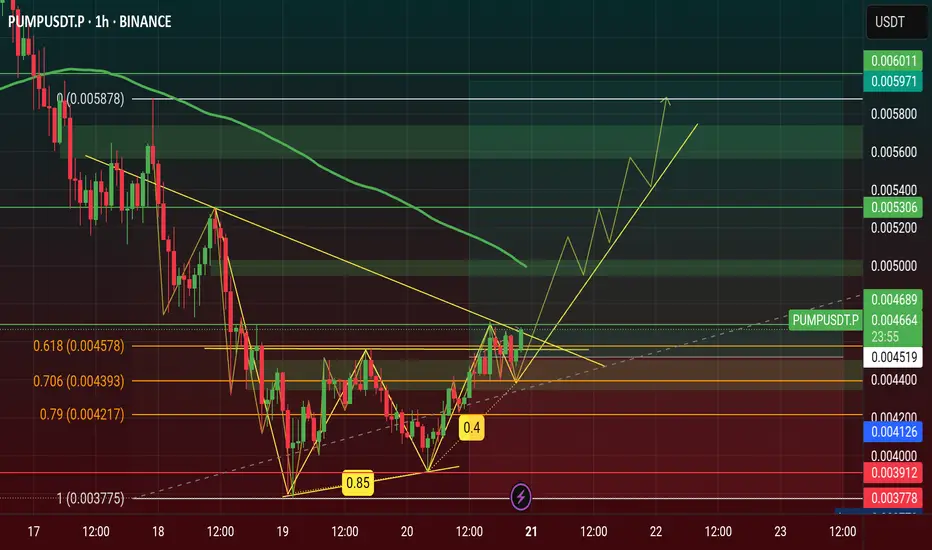
$PUMP Price Will Hit $0.006 this July 2025 see on Chart...🚀 NYSE:PUMP Price Will Hit $0.006 this July 2025, NYSE:PUMP is Showing a Double Bottom Pattern Looking on Chart now.
Double Bottom Pattern is a Reversal Pattern and It's will Manipulation Price of Pump. I'm Find a Three White Shoulders Candle in bottom price area on 4h Chart & It is a Bullish Candle. Now Price Retest and If it's Breakout it will be happened this month.
#Write2Earn #TrendingPredictions #AltcoinSeasonLoading #pump #SUBROOFFICIAL
Disclaimer: This article is for informational purposes only and does not constitute financial advice. Always conduct your own research before making any investment decisions. Digital asset prices are subject to high market risk and price volatility. The value of your investment may go down or up, and you may not get back the amount invested. You are solely responsible for your investment decisions and Binance is not available for any losses you may incur. Past performance is not a reliable predictor of future performance.
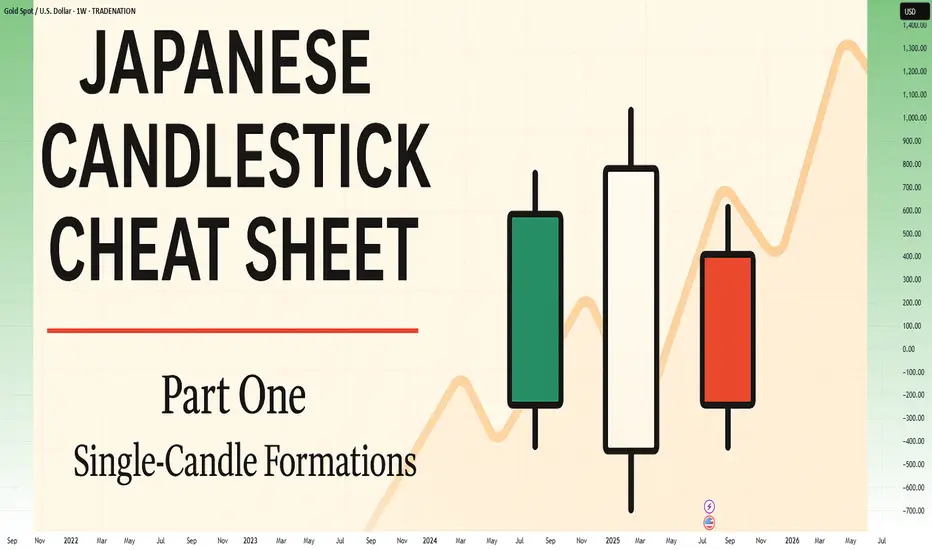
Japanese Candlestick Cheat Sheet – Part OneSingle-Candle Formations That Speak
Before you dream of profits, learn the one language that never lies: price.
Indicators are just subtitles — price is the voice.
Japanese candlesticks are more than just red and green bars — they reflect emotion, pressure, and intention within the market.
This series will walk you through the real psychology behind candlestick patterns — starting here, with the most essential:
🕯️ Single-candle formations — the quiet signals that often appear before big moves happen.
If you can’t read a doji, you’re not ready to understand the market’s hesitation.
If you ignore a hammer, you’ll miss the moment sentiment shifts.
Let’s start simple. Let’s start strong.
This is Part One of a five-part series designed to build your candlestick fluency from the ground up.
1. DOJI
Bias: Neutral
What is the Doji pattern?
The Doji candlestick pattern forms when a candle’s open and close prices are nearly identical, resulting in a small or nonexistent body with wicks on both sides. This pattern reflects market equilibrium, where neither buyers nor sellers dominate. Dojis often appear at trend ends, signaling potential reversals or pauses.
As a fundamental tool in technical analysis, Dojis help traders gauge the psychological battle between buyers and sellers. Proper interpretation requires context and experience, especially for spotting trend shifts.
Meaning:
Indicates market indecision or balance. Found during trends and may signal a reversal or continuation based on context.
LONG-LEGGED DOJI
Bias: Neutral
What is the Long-Legged Doji pattern?
The Long-Legged Doji captures a moment of intense uncertainty and volatility in the market. Its long wicks represent significant movement on both sides, suggesting that neither buyers nor sellers have control. This back-and-forth reflects the psychology of market participants wrestling for control, which often foreshadows a shift in sentiment. When traders see a Long-Legged Doji, it highlights the need to monitor for potential changes in direction.
They can appear within trends, at potential reversal points, or at consolidation zones. When they form at the end of an uptrend or downtrend, they often signal that the current trend may be losing momentum.
Meaning:
The prominent wicks indicate volatility. Buyers and sellers pushed prices in opposite directions throughout the session, ultimately reaching an indecisive close.
SPINNING TOP
Bias: Neutral
What is the Spinning Top pattern?
A Spinning Top is a candlestick with a small body and long upper and lower wicks, indicating that the market has fluctuated significantly but ultimately closed near its opening price. This pattern often points to a moment of indecision, where both buyers and sellers are active but neither dominates. Spinning Tops are commonly found within both uptrends and downtrends and can suggest that a trend is losing momentum.
For traders, a Spinning Top provides a valuable insight into market psychology, as it hints that the prevailing sentiment may be weakening. While Spinning Tops alone aren’t always definitive, they can serve as a precursor to larger moves if the following candles confirm a shift in sentiment.
Meaning:
Shows indecision between buyers and sellers. Common in both up and downtrends; signals potential reversal or pause.
HAMMER
Bias: Bullish
What is the Hammer pattern?
A Hammer candlestick appears at the end of a downtrend, with a small body and a long lower wick. This shape reflects a moment when sellers pushed prices lower, but buyers managed to absorb the selling pressure and drive prices back up before the close. This pattern is particularly important for spotting potential reversals, as it indicates that buyers are beginning to reassert control.
Hammers reveal the underlying psychology of a market where buying confidence is emerging, even if sellers have dominated for a while. To successfully trade this pattern, it’s essential to confirm the reversal with subsequent candles.
Meaning:
Showing rejection of lower prices. Signals potential bullish reversal, especially if followed by strong buying candles.
INVERTED HAMMER
Bias: Bullish
What is the Inverted Hammer pattern?
The Inverted Hammer forms at the bottom of a downtrend, with a small body and long upper wick. This pattern shows that buyers attempted to push prices higher, but sellers ultimately brought them back down by the close. The Inverted Hammer is an early sign of buyer interest, hinting that a trend reversal may be underway if subsequent candles confirm the shift.
Interpreting the Inverted Hammer helps traders understand where sentiment may be shifting from bearish to bullish, often marking the beginning of a recovery. Recognizing these patterns takes practice and familiarity with market conditions.
Meaning:
Showing rejection of higher prices. Can signal bullish reversal if confirmed by subsequent buying pressure.
DRAGONFLY DOJI
Bias: Bullish
What is the Dragonfly Doji pattern?
The Dragonfly Doji has a long lower wick and no upper wick, forming in downtrends to signal potential bullish reversal. This pattern reveals that sellers were initially in control, pushing prices lower, but buyers stepped in to push prices back up to the opening level. The Dragonfly Doji’s unique shape signifies that strong buying support exists at the lower price level, hinting at an impending reversal.
Recognizing the psychology behind a Dragonfly Doji can enhance a trader’s ability to anticipate trend changes, especially in markets where support levels are being tested.
Meaning:
Found in downtrends; suggests possible bullish reversal if confirmed by a strong upward move.
BULLISH MARUBOZU
Bias: Bullish
What is the Bullish Marubozu pattern?
The Bullish Marubozu is a large, solid candle with no wicks, indicating that buyers were in complete control throughout the session. This pattern appears in uptrends, where it signals strong buying momentum and often foreshadows continued upward movement. The absence of wicks reveals that prices consistently moved higher, with little resistance from sellers.
For traders, the Bullish Marubozu offers a glimpse into market psychology, highlighting moments when buyer sentiment is particularly strong. Learning to identify these periods of intense momentum is crucial for trading success.
Meaning:
Showing complete buying control. Found in uptrends or at reversal points; indicates strong buying pressure and likely continuation of the trend.
SHOOTING STAR
Bias: Bearish
What is the Shooting Star pattern?
The Shooting Star appears at the top of an uptrend, characterized by a small body and a long upper wick, indicating a potential bearish reversal. Buyers initially drove prices higher, but sellers took over, bringing prices back down near the open. This shift suggests that buyers may be losing control, and a reversal could be imminent.
Interpreting the Shooting Star gives traders valuable insights into moments when optimism begins to fade, providing clues about a potential trend shift.
Meaning:
Indicating rejection of higher prices. Signals a potential bearish reversal if followed by selling pressure.
HANGING MAN
Bias: Bearish
W hat is the Hanging Man pattern?
The Hanging Man candle forms at the top of an uptrend, with a small body and long lower wick. This pattern suggests that sellers attempted to drive prices down, but buyers regained control. However, the presence of a long lower shadow hints that sellers may be gaining strength, potentially signaling a bearish reversal.
The Hanging Man pattern reflects market psychology where buyers might be overextended, making it a valuable tool for identifying potential tops in trends.
Meaning:
Signals potential bearish reversal if confirmed by selling candles afterward.
GRAVESTONE DOJI
Bias: Bearish
What is the Gravestone Doji pattern?
With a long upper wick and no lower wick, the Gravestone Doji reveals that buyers pushed prices up, but sellers eventually regained control. Found in uptrends, it suggests that a bearish reversal could be near, as the upper shadow indicates buyer exhaustion. The Gravestone Doji often appears at market tops, making it a valuable indicator for those looking to anticipate shifts.
Understanding the psychology behind this pattern helps traders make informed decisions, especially in markets prone to overbought conditions.
Meaning:
Showing rejection of higher prices. Found in uptrends; signals potential bearish reversal if followed by selling activity.
BEARISH MARUBOZU
Bias: Bearish
What is the Bearish Marubozu pattern?
The Bearish Marubozu is a large, solid bearish candle without wicks, showing that sellers held control throughout the session. Found in downtrends, it signals strong bearish sentiment and suggests that the trend is likely to continue. The lack of wicks reflects consistent downward momentum without significant buyer support.
This pattern speaks about market psychology, offering traders insights into moments of intense selling pressure. Recognizing the Bearish Marubozu can help you align with prevailing trends and avoid buying into weakening markets
Meaning:
Showing strong selling pressure. Found in downtrends; signals continuation of the bearish trend or an intensifying sell-off.
👉 Up next: Double-candle formations – where price meets reaction.
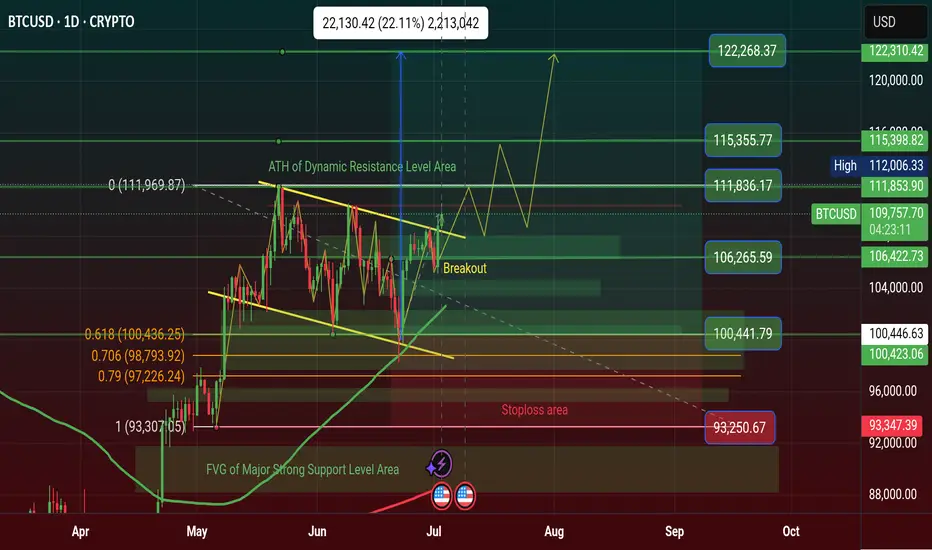
$BTC Price Showing a Bullish Flag Pattern & Breakout see chart..CRYPTOCAP:BTC Price Breakout of Bullish Flag Pattern. I'm guess it's going to the next Price Zone $115K and if Breakout thank going $122K price zone.
I was telling some coins that was saying Multiple Profit and now coins are driving on the way. There are coin is ETH, BNB, XRP, SOL, TRX, TON, SUI, ADA, ICP, ARB, XLM.
Ric Edelman Urges Up to 40% Crypto Allocation, Predicts Bitcoin Surge to $500K
Top advisor Ric Edelman recommends investors allocate up to 40% to crypto, forecasting Bitcoin could reach $500K with rising institutional demand.
Ric Edelman advises investors to allocate 10% to 40% of their portfolios to crypto, based on their risk tolerance.
Edelman predicts Bitcoin could reach $500,000 if just 1% of global assets shift into the cryptocurrency sector. His endorsement is viewed as a major TradFi signal, given his $300 billion asset management influence in the advisory industry.
Ric Edelman, the founder of Edelman Financial Engines and DACFP, has recommended investors shift a significant portion of their portfolio to cryptocurrency. In a recent whitepaper, Edelman advised allocating between 10% and 40% to crypto, depending on individual risk tolerance.
This guidance marks a break from the conventional 60/40 stock-to-bond portfolio model, which he believes is no longer practical in a rapidly advancing economic environment.
According to Edelman, conservative investors should hold 10% in crypto, moderate investors 25%, and aggressive investors 40%. He cited technological advancements and increased life expectancy as reasons to move away from traditional investment formulas. He emphasized that ignoring crypto means betting against an asset class that has outperformed all others over the past 15 years.
Bitcoin Price Could Hit $500,000 with Minimal Asset Shift
Edelman also presented a bullish projection for Bitcoin, suggesting it could reach $500,000. He explained that a 1% allocation of the $750 trillion in global assets toward Bitcoin would inject $7.5 trillion into the market. Based on current valuations, this inflow could significantly drive the asset’s price. He underlined this estimate as simple arithmetic based on supply and demand trends.
Edelman pointed to growing institutional interest and policy changes as key drivers for crypto’s rise. He highlighted that Tether, a major stablecoin, reported $13 billion in profits last year, surpassing companies like McDonald’s and Ford. He also noted that a pro-crypto political climate, especially following Donald Trump’s reelection, is setting favorable conditions for digital assets.
Disclaimer: This article is for informational purposes only and does not constitute financial advice. Always conduct your own research before making any investment decisions. Digital asset prices are subject to high market risk and price volatility. The value of your investment may go down or up, and you may not get back the amount invested. You are solely responsible for your investment decisions and Binance is not available for any losses you may incur. Past performance is not a reliable predictor of future performance. You should only invest in products you are familiar with and where you understand the risks. You should carefully consider your investment experience, financial situation, investment objectives and risk tolerance and consult an independent financial adviser prior to making any investment.
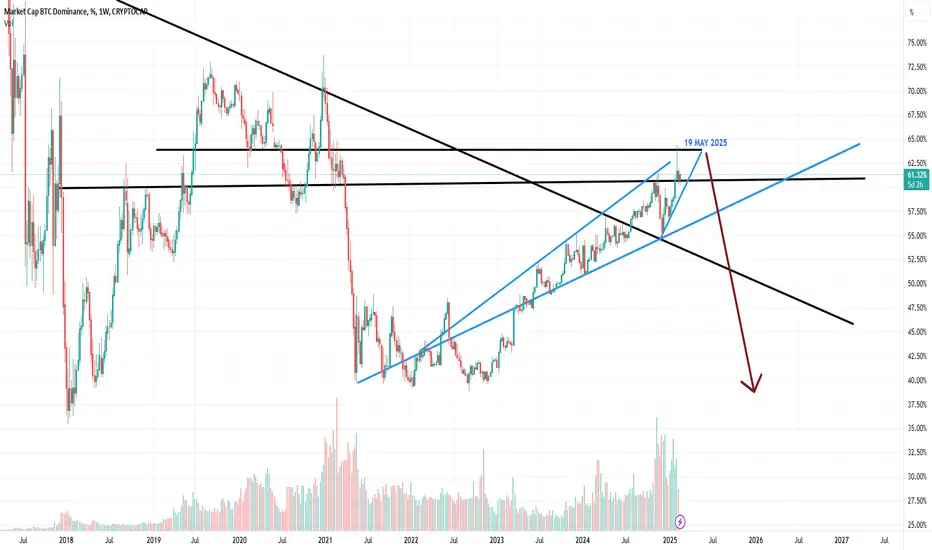
BTC DOMINANCE 19 MAY ALTCOIN SEASONN !!!I expect BTC dominance to break downward by May 19. I believe dominance will touch 64% and then decline. We are very close to ALTCOIN SEASON—buckle up and keep an eye on the chart!
BOOOOMMM
Capturing Market Moves with the Special Candle SetupOverview
The Special Candle Setup Indicator has once again proven its effectiveness in detecting high-probability candlestick formations. In this chart, a bearish pattern was identified at the top, providing an early indication of a potential downside move. This setup allowed traders to position themselves accordingly, capturing the downward trend efficiently.
How It Worked Here
🔹 Precise Bearish Signal – The indicator detected a bearish pattern at a key resistance level, signaling a potential reversal.
🔹 Well-Defined Key Levels – The automatically plotted blue support line and green resistance line provided crucial reference points for trade management.
🔹 Trend Continuation Confirmation – The setup was followed by further bearish price action, validating the accuracy of the signal.
Key Takeaways
✅ Early Signal Accuracy – The indicator highlighted the reversal before the major drop, reinforcing its reliability.
✅ Multi-Market Application – These candlestick formations are not limited to expiry days; they are observed across crypto, forex, stocks, and indices.
✅ Customizable for Different Strategies – Users can enable or disable specific pattern types (bullish/bearish or reversal setups) based on their trading style.
Why This Matters?
Price action remains one of the most powerful trading tools, and this indicator helps traders automate pattern detection while integrating dynamic support and resistance levels for added confluence.

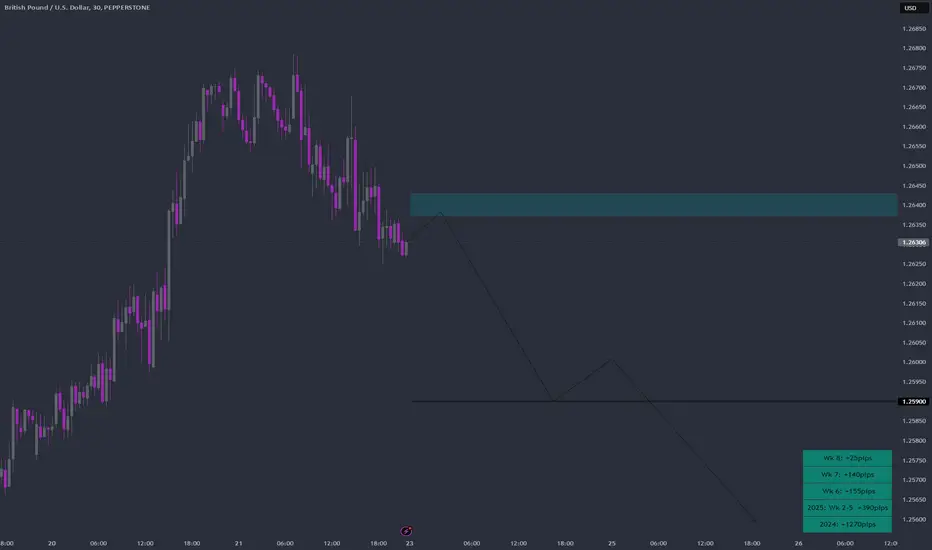
GBPUSD Week 9 Swing Zone/LevelsLast week saw a few pinched pips and also few losses. This highlights the benefit of having a good risk to reward ratio.
Weekly zone and levels are mapped based on previous week daily high-low relationship (ie Monday HL in relation to Tuesday in relation to Wednesday HL, etc). This generates a fairly accurate levels with actual price action determining trades.
SL, stoploss is usually btw 10-15pips
TP, Takeprofit is 5-10x that, with sl moving to BE, breakeven once trade pinches +20pips.
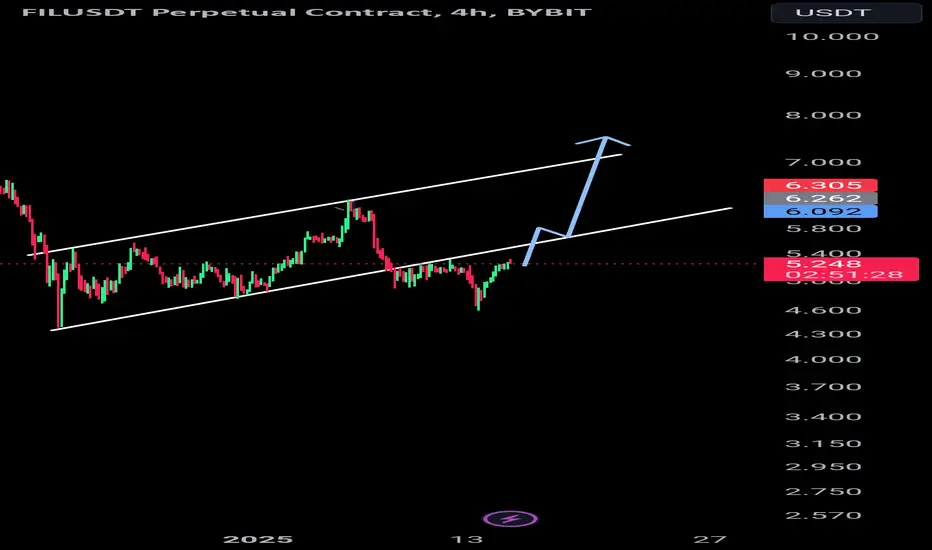
FIL on the Rise Eyeing a Breakout to $6+Key Observations
1. Channel Formation
The price is attempting to move within an ascending channel formation.
The lower trendline acts as support, while the upper trendline serves as resistance.
2.Current Price Action
The price is approaching the upper boundary of the channel.
To confirm bullish momentum, a strong 4-hour candle close above the channel is essential.
3. Resistance and Target
A breakout above the channel indicates a bullish continuation, with the immediate target around $6+.
$5.50 might act as minor resistance before the target.
4.Support Levels
If the price fails to break out, the lower channel line (around $5.00) will serve as a critical support zone.
A break below this support could invalidate the bullish scenario.
5. Volume Confirmation
Monitor trading volume for confirmation. A breakout with high volume increases the likelihood of reaching the target.
6. Market Sentiment
Current sentiment aligns with a potential bullish breakout if external factors like Bitcoin movement or news events don’t cause significant volatility.
Strategy
Entry: Wait for a confirmed 4-hour candle close above the upper trendline with support retest.
Target: $6.00+
Stop-Loss : Below the channel’s lower boundary (e.g $4.90)
The setup looks promising, but caution is advised due to market volatility. Always use proper risk management when trading.
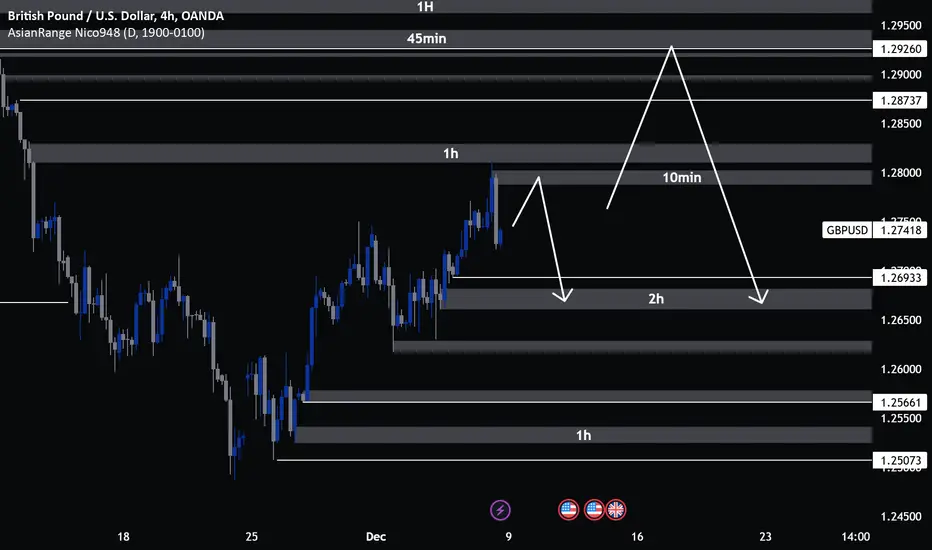
GBP/USD shorts to take level 1.24853With the heavy downwards price action we have been seeing on both GU and EU which directly correlates with the GU and the bullish price action of the dollar which goes against the Gu we can anticipate that Gu will continue in this downwards trend to take the last LL at price point 1.24853.
looking deeper into candle anatomy we see that Fridays price action left a strong bearish candle signifying sellers are in control. We also see that there are multiple ASL to the downside and other pools of liquidity which can be TP targets.
However, there are many demand zones we could see price push up from in the short term to collect liquidity to the upside before continuing in its overall HTF downtrend. It is also possible price could push up market open taking the ASH that lay above before melting.
Bitcoin - Fakeout? MUST WATCH !!A recent surge in the price of BTC is sparking hope for that final impulse wave UP I've been talking about. However, there's a catch - one KEY thing will need to happen in order to convince me this is not just a fakeout, aimed at liquidating shorts.
The previous BTC update was focused on two scenarios, with the GREEN showing a possibility of realizing:
Reclaiming the moving averages in the daily is a good sign - but again, we've been falling under-and-over for the last few weeks, unable to stay above the 200d MA for longer than a few days:
___________________________
BINANCE:BTCUSDT

Quarter Theory: Intraday Trading Mastery - Part 1 IntroGreetings Traders!
In today’s video, we’ll be introducing Quarter Theory Intraday Trading Mastery, a model grounded in the algorithmic nature of price delivery within the markets. We’ll explore candle anatomy and learn how to predict candle behavior on lower timeframes to capitalize on intraday trading opportunities. This model will also help us identify the optimal trading sessions and execute trades with high probability, all while effectively acting on market bias.
This video will focus primarily on the foundational content, with practical examples to follow in the next video. In the meantime, I encourage you to practice these concepts on your own to deepen your understanding.
This video is part of our ongoing High Probability Trading Zones playlist on YouTube. If you haven’t watched the previous videos in the series, I highly recommend checking them out. They provide crucial insights into identifying market bias, which Quarter Theory will help you act on effectively.
I’ll attach the links to those videos in the description below.
Premium Discount Price Delivery in Institutional Trading:
Mastering Institutional Order-Flow Price Delivery:
Quarter Theory Mastering Algorithmic Price Movements:
Mastering High Probability Trading Across All Assets:
Best Regards,
The_Architect

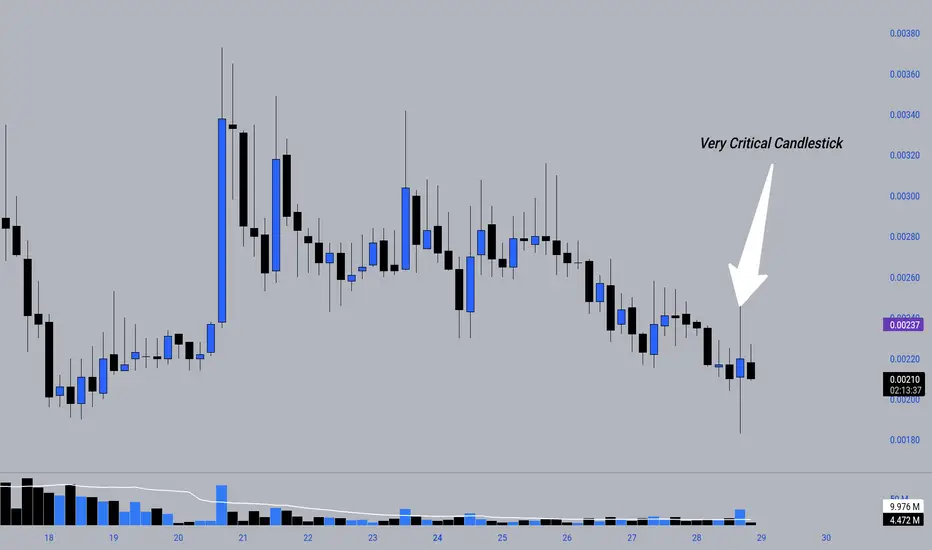
#Avalox Indecisive but voluminous candlestick formationThe last candlestick formed here and the upward wicks of many previous candlesticks still give important signs.
I think it is important to follow this coin in a special place.
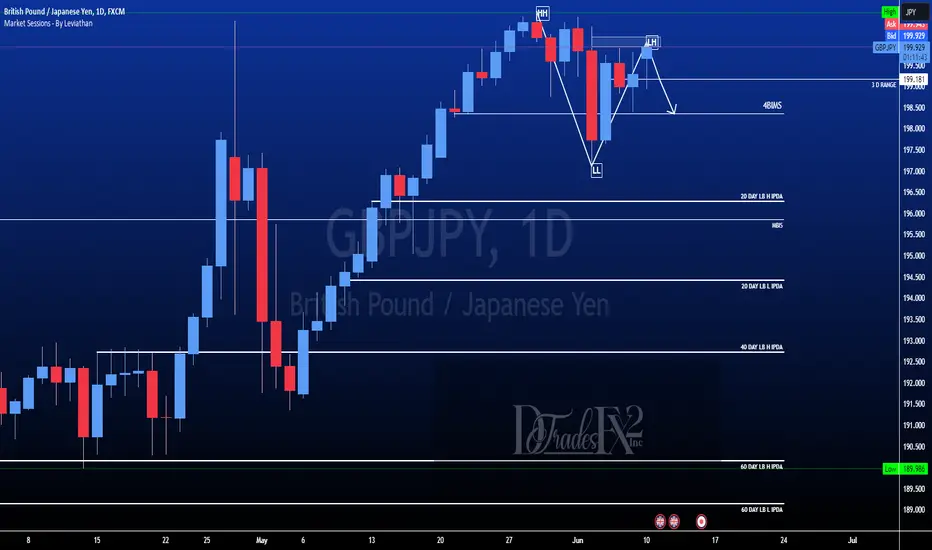
GBPJPY still gives bearish sentiment$$$Took a short yesterday that went according my analysis. After a retracement and doing further analysis my bias is still leaning heavily towards the downside. The monthly nor has the weekly high been breach to make a new higher high. Right now, i'm looking at a rejection on the 4hr and 1hr timeframes that looks to be hitting resistance inside of a fair value gap. My intentions is to dropdown into a lower time frame and look for an entry to short the market.
The Asian and London highs has been breached absorbing liquidity in the form of buystops. After a low or high is taken price usually runs up about 20-30 pips more before making a correction or trend reversal.
Everyone have a safe and productive trading week!!!
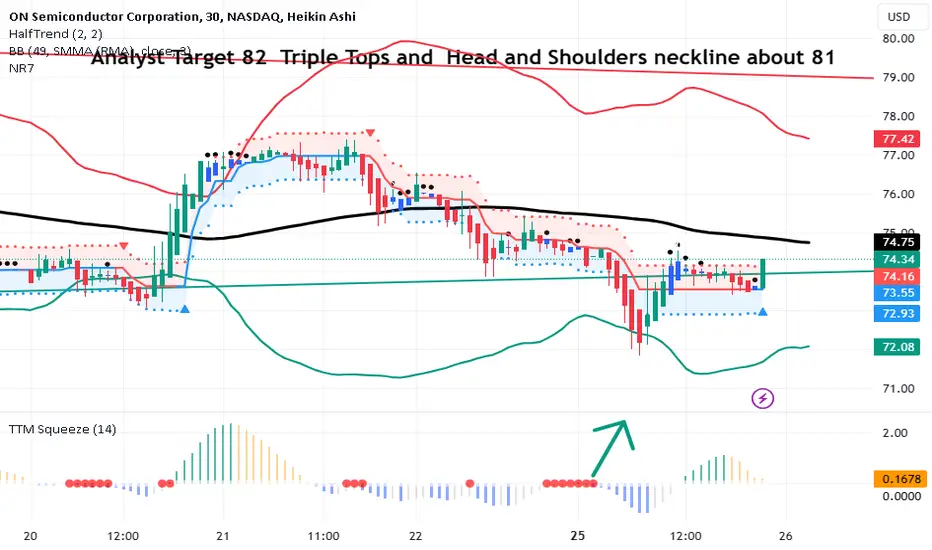
ON Semiconductor lags its leading peer Engulfing Candle LONGON shown on a 30 minute chart- has fallen behind but is a top 50 seached on the the Zack
website. It recently trended down from a push to outside the Bollinger Bands showing extreme
buying volaility and price action than a big fade into selling volatility and a slight compression.
The TTM squeeze fired just as price fell outside the lower band. Price rose abruptly into and
over the trendline and then printed a so called" Big Ass Candle" engulfing about five
hours of price action. This is a strong buy. ON will work to catch up with MU NVDA and the
frontrunners. I will profit while it runs that race.
Apollo Hospitals - An Investment pick for the Mid Term, 50% ROI The stock has broken out decisively in Monthly Jan 2023 after 2 years of good consolidation.
The yearly time frame indicates an inside candle showing the consolidation.
The best entry zones are marked in red. One may enter based on Risk appetite.
For a target of 9653 to 10000.

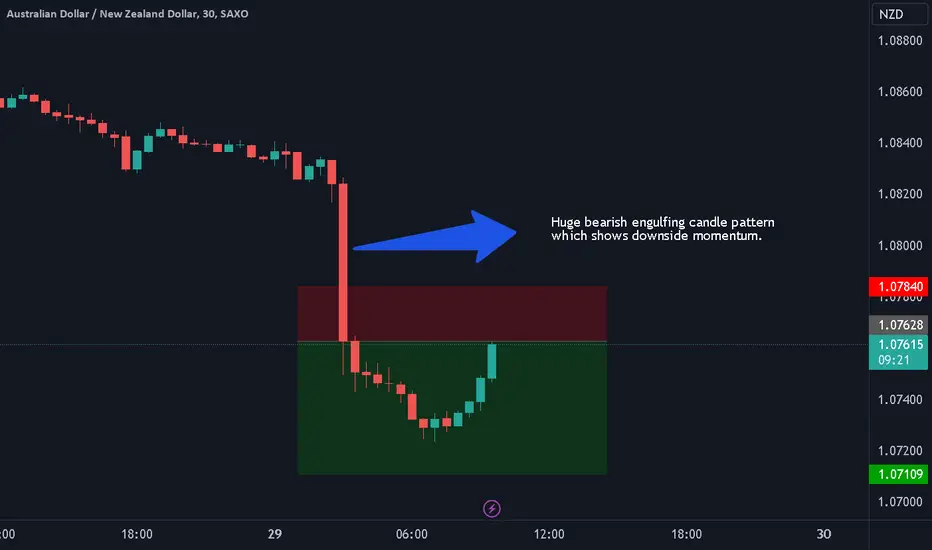
AUDNZD Bearish Engulfing Candle Pattern Short We expect further downside on this pair, signalled by a huge bearish engulfing candle pattern on the H1 time frame.
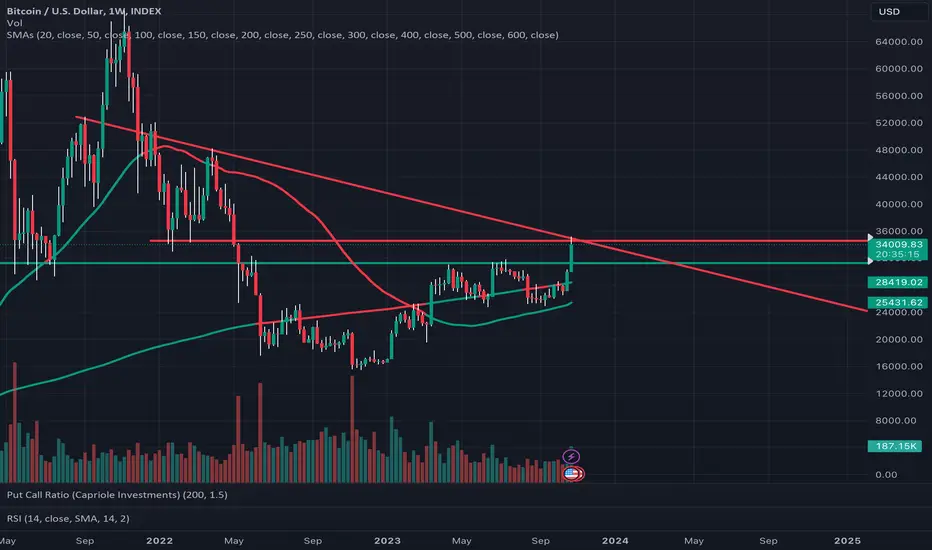
Bitcoin Runs into Strong Resistance on the Weekly.Recently, INDEX:BTCUSD has been having a bit of a bull run. This is probably because most people were and are still expecting a Spot ETF to be approved. That is, according to mainstream sources.
I'm not sure whether the bull run has finished yet, however, we do have some chart statistics that show Bitcoin will probably have a pullback.
Firstly, the RSI is showing >80 on the Daily at the moment, which is very overbought. In fact, during the bull run, Bitcoin hit an RSI number of 90+ temporarily. To put that into perspective, that is the same RSI number Bitcoin hit when it had its late 2021 bull run.
RSI on the Daily
Secondly, there are two strong trend lines on the weekly chart that Bitcoin has just run into, and its clear they're strong resistance.
Weekly Chart
I have shorted KUCOIN:BTCUSDT at this level, and I'm expecting the price to go down soon. Although, I could be wrong.
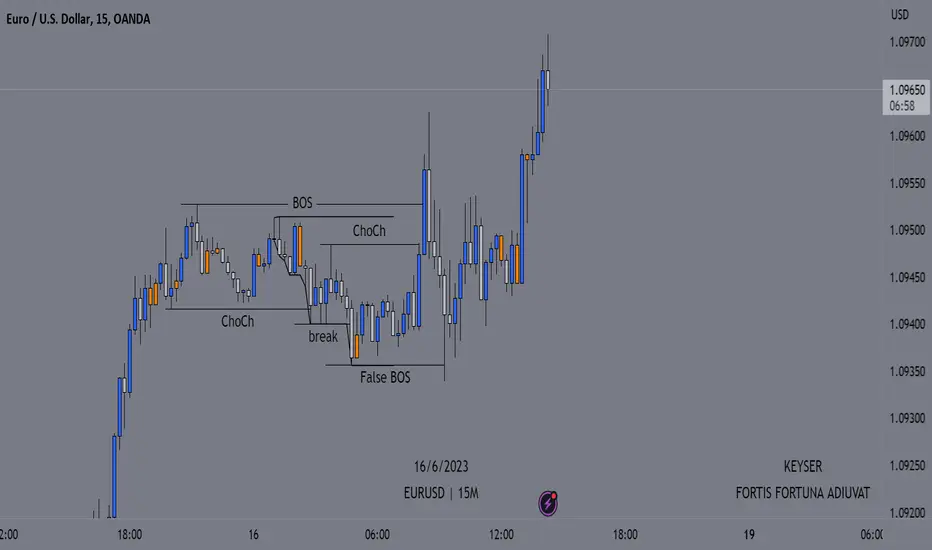
Why candle closes are importantThis is an example of why candle closes are important when marking out a BOS which changed direction. Like here the low just got swept and went on to make another higher high. There is no real way to know if it is a BOS or a trap so it's best just wait and see if we get a candle close or in this case break the high. You could get a reaction on the lower timeframe but it could just be a reaction and not lead to anything.
Going To Test Resistance Google is on track to test resistance at 126.00 a share based on candle stick analysis and triple confirm indicator. Triple confirm is not reliable on its own but works great in conjunction with other indicators. MACD is barely just starting to show a slow down in decline and tomorrow could be a start of a reversal.

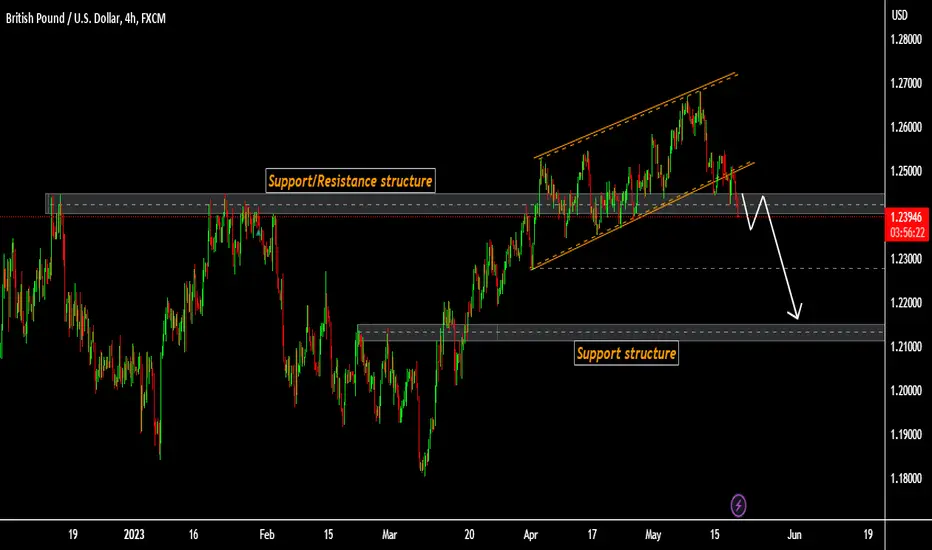
GBPUSD breaking below support, to head lower towards 1.22000GBPUSD
The price is breaking below the support/resistance structure, If price continue to stay below support/resistance structure I expect the price to move lower..
Trade Wisely
*The content on this analysis is subject to change at any time without notice, and is provided for the sole purpose of assisting traders to make independent investment decisions.
BTCUSDT above support,to continue growth after retest of supportBTCUSD
The price is currently above support/resistance structure, after a pullback if price holds above the support I expect the price to move higher...
Trade Wisely
*The content on this analysis is subject to change at any time without notice, and is provided for the sole purpose of assisting traders to make independent investment decisions.

BTCUSDT Correction development scenario of bear market terminusBTC just made a pullback to neckline of the major Head and Shoulders formation on macro. Now, the price action is abandoning the distributive structure with weak volume, due to a micro H&S.
Points of interest
We can see on this chart levels to be watch in a potential swing downward. BTC has been trading in a choppy structure, consolidating within a ending diagonal. The potential drawdown till FEB close tends to be form a monthly bearish Harami candlestick pattern, which is highly reliable on higher timeframes.
This pattern can be consider highly reliable. A Harami bearish just play out on the last weekly close (1W) and tends to be form on 1M, in which is a rare case. In bear markets, this pattern is an important reversal signal after a rally of relief, indicating an intermediary point for an 2nd and final swing leg-down. On this chart, you can see that the potential throw-over of actual consolidation (choppy structure / breakout of Harami) is in confluence w/ a expected final swing leg-down of an expanding ending diagonal.

US30 Initial Weekly Forecast Last week, US30 was technically and fundamentally driven to the downside. What I wanted to discuss here is the simple concept of a trendline. Now a lot of new traders learn to trade the brake and retest a trendline. Depending on whether they know how to trade it and read the price action correctly is the determinant. What can save you from this type of loss is understanding that even though a trendline is broken, it does not necessarily the trend is broken. What is more important than the trend line is the market structure! If price does not break the previous high or low, then is a high chance for a trader's position to be liquidated by the market. This was the exact case for US30 at the end of last week. Currently, we are presented with 2 strong bullish candles with a decent range. The probability for price action to fully retrace last week's move is pretty high. This week I will be analyzing this in addition to the dollar index and the US 10Y, and hopefully, a great setup come out of it. Key level target has also been noted. :-)
