EURCAD / QUICK SELL OFF FROM RESISTANCE!!Looking to get in a position from around this sell zone I have highlighted. Price has had multiple rejections holding a nice resistance from around this zone and just above where I have a horizontal line. If we can see another spike into this area ill be jumping on short trades!
Candlestickpattern

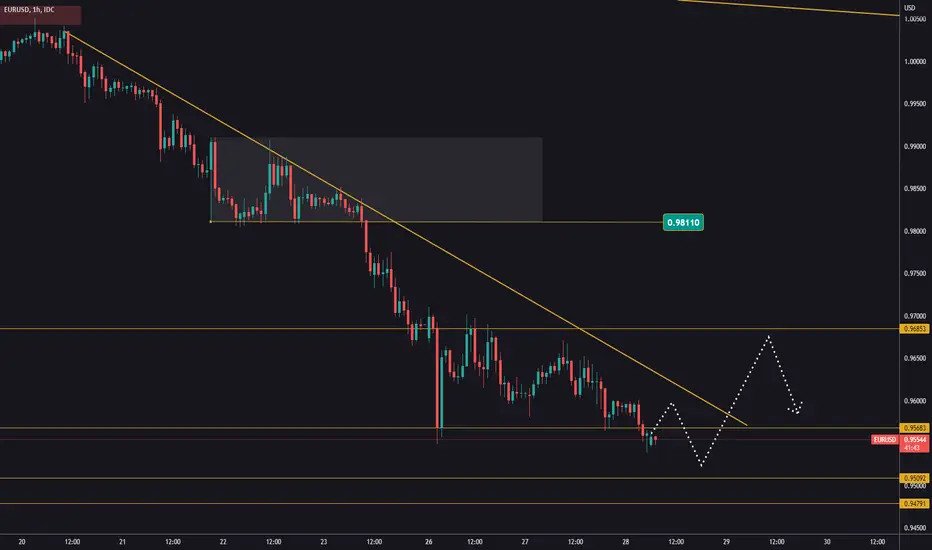
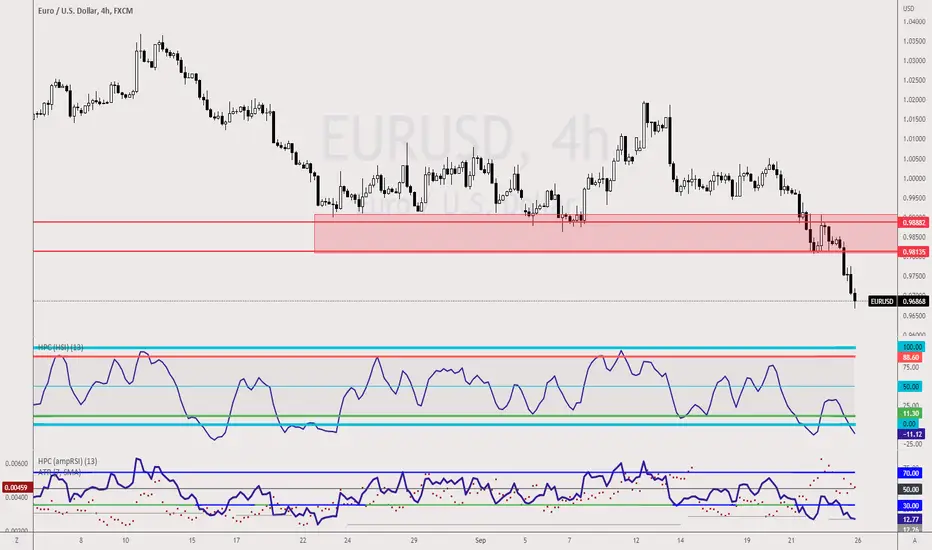
A new low on EURUSD! What's next? This morning EURUSD reached 0,9538 after continuing lower, just as expected.
The next support level is at 0,9510, followed by 0,9480.
Selling at current price levels isn't a good idea and we're also not looking for any long trade opportunities!
A Divergence Signal!At the previous price, the candlestick pattern indicates an accumulative phase without continuous buying pressure and significate volume on the previous trade. With the recent trade, the candlestick closed above the MA20 line without being backed by volume where it's below the MA20 line.
The RSI indicators indicate a fresh buying interest backed by a price candlestick that is closed above the MA20 line.
Interesting to see where MACD and OBV indicators indicate a divergence signal. Hence, align with the candlestick uptrend signal towards the next resistance.
Let's save HEXIND in WL and watch out for significant price movement backed by volume towards price resistance.
R 0.425
S 0.380

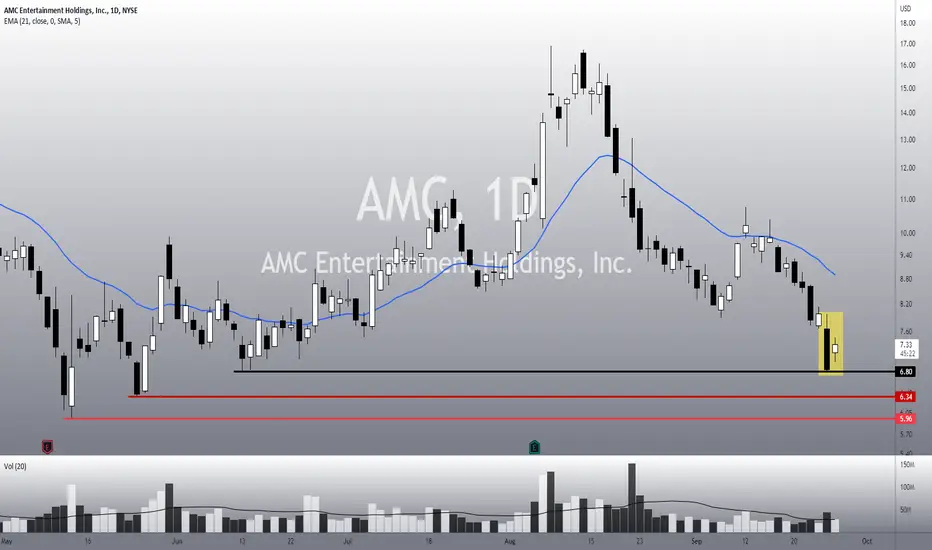
AMC: A bottom sign! What to expect next?• AMC is still in a bear trend, and there is no reversal sign yet. However, there is a bottom sign on it today, just above a support level (black line at $6.80);
• Today’s candlestick pattern is a Bullish Harami, so far, and although it is not the most reliable bottom sign, it appeared in an important support level;
• This could make AMC bounce back up to its 21 ema again, but remember, this is not a reversal sign yet, just a temporary bottom sign;
• If AMC breaks its 21 ema or does a bullish reversal structure in the next few days, then we can talk about a reversal, but for now, let’s just ´pay attention to the Harami pattern;
• In addition, if AMC frustrates this bottom sign, it’ll just seek its next support levels, like the red line at $6.34 - $5.96;
• It all depends on how AMC will react from here.
I’ll keep you guys updated on this. Remember to follow me for more analysis like this! Keep in touch.
this was the ABCD pattern, i was..This was the ABCD pattern I was talking about on the previous analysis, check link at the bottom.
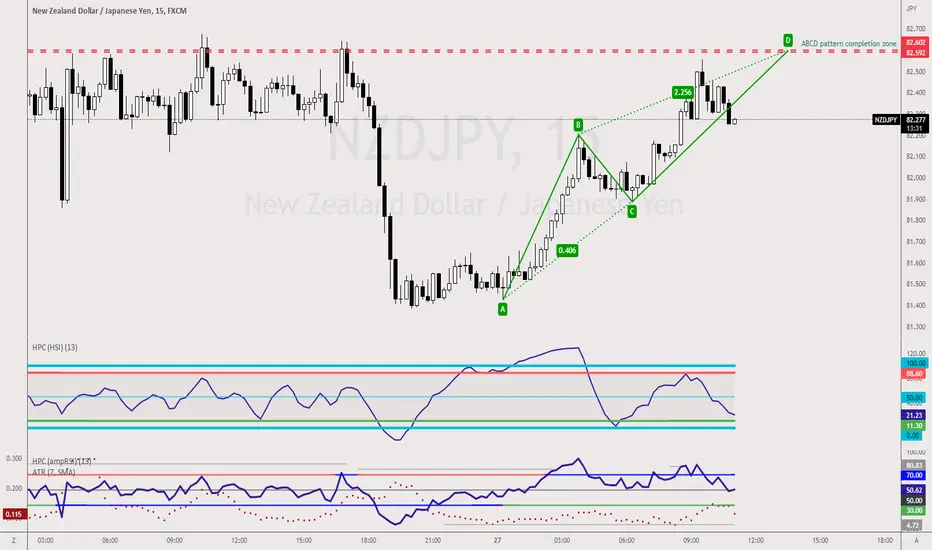
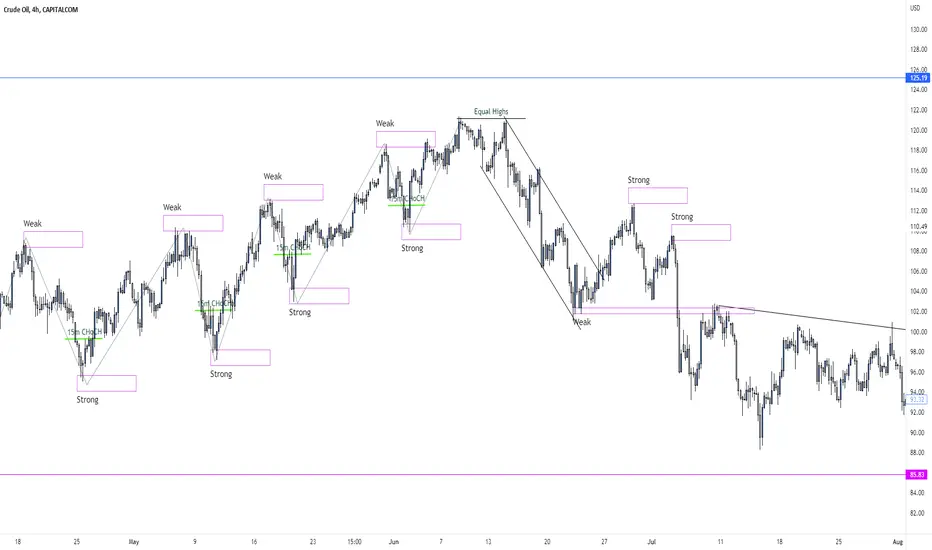
ABCD Pattern on intradayNormally I won't be trading the abcd pattern on the 15-minute timeframe, but in this case, the candlestick completion zone is at 82.60, which is the previous structure resistance, see that?
That is when we need to be flexible in our analysis.
EURJPY - Key Support Level on DailyTraders, I love seeing this formation. Key support level respected. I'll be looking for mid-long term 2days-2months bullish movement on the EURJPY, period.

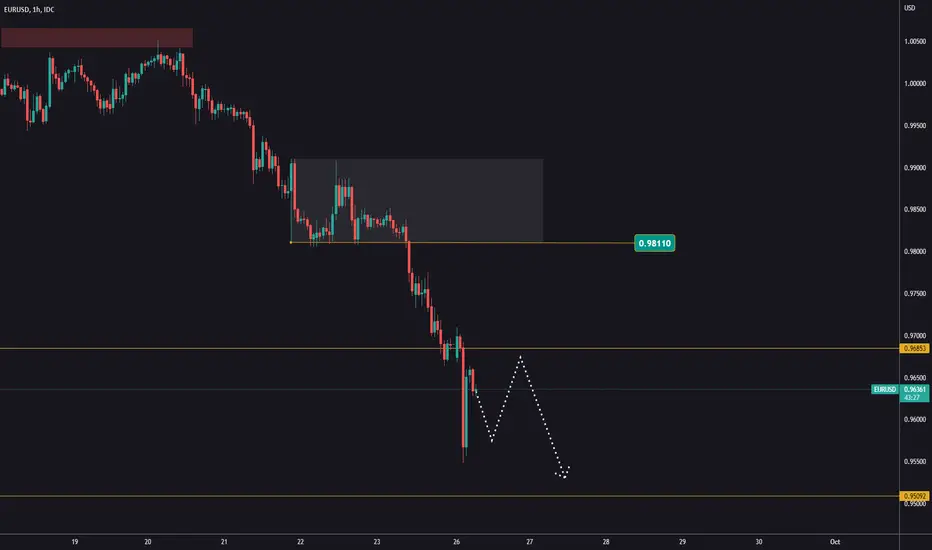
EURUSD continues the downside move Yesterday, we saw rejection of the 0,9585 support level. This level should turn into resistance after a breakout.
The downtrend is still on and we should see price heading back to 0,9568 and then eventually 0,9510.
Entries only after further rejection! We're not looking to buy!
A new low on EURUSD On Friday EURUSD reached the target at 0,9685 and this morning we have another 100 pips drop!
In moments like this, it is pretty obvious why we should trade with the trend!
The only thing that we have to focus on is a possible pullback and a continuation lower.
The next support level is at 0,9510!
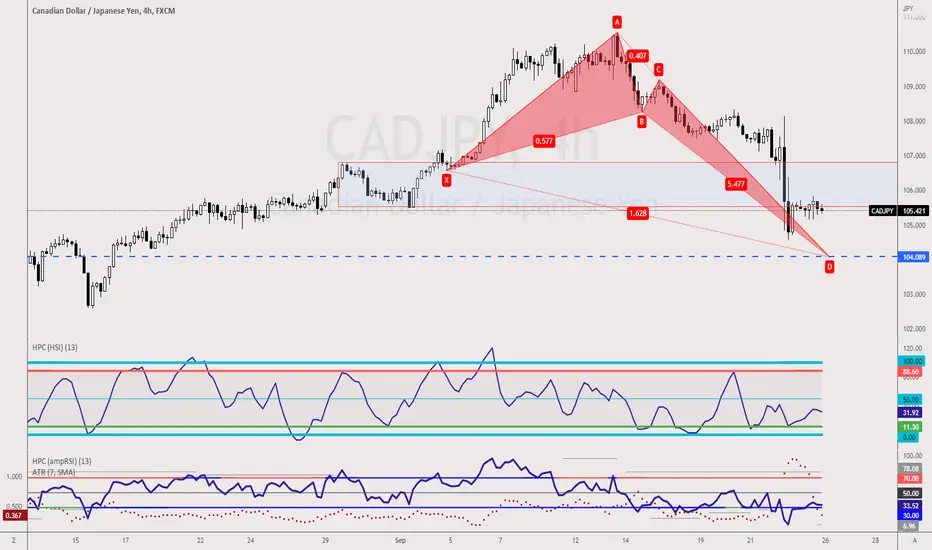
Episode578 CADJPY - Bullish CrabAs much as I like to prize this Crab Pattern as the ultimate setup for the week, this Bullish Crab Pattern has a major warning sign.
Trained Harmonic Pattern traders can comment at the bottom.
The reason I would still consider this a Crab Pattern is because the levels converge at 104.08.
The better setup this week is the Bearish Crab Pattern on the USDJPY Daily Chart, check out the link at the bottom.
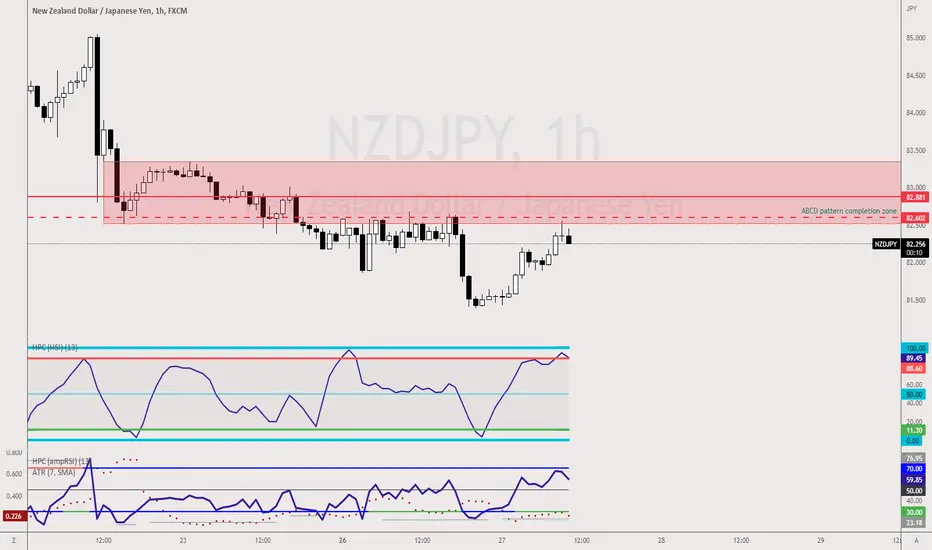
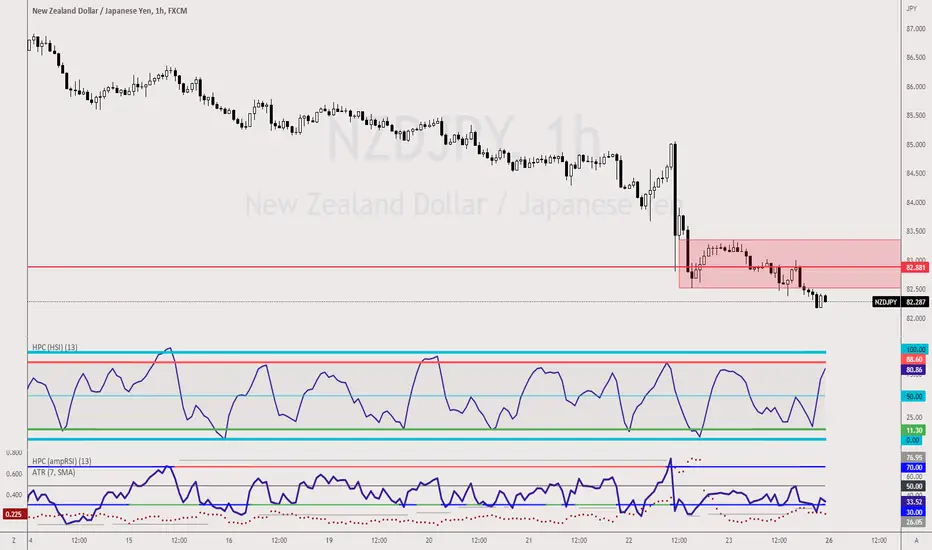
Episode577 NZDJPY - Resistance Level 82.16 is an important level of NZDJPY on the daily chart; that's the support level of the Bullish Flag setup.
While some traders are non-believer of the Flag Pattern, 82.88 provide a good level for the trend traders to head in for a shorting opportunity in advance of the move.
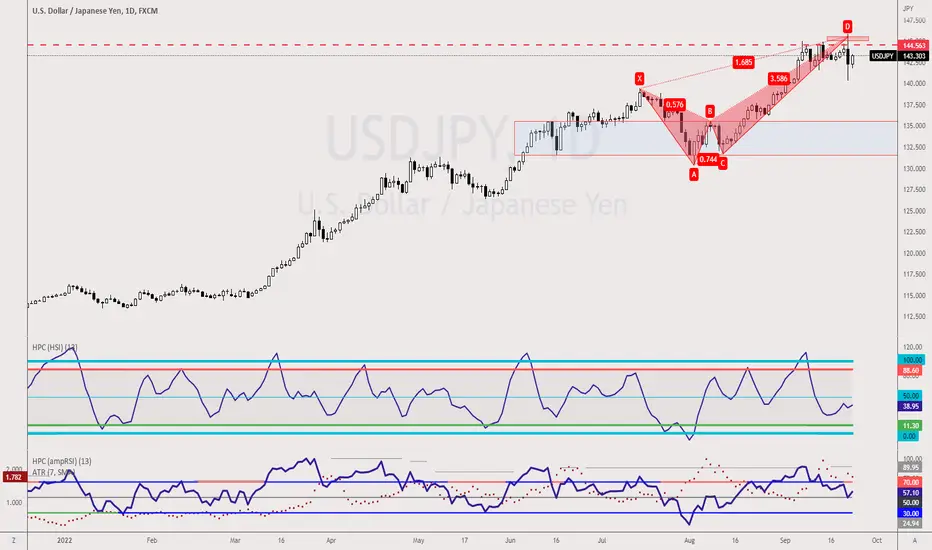
USDJPY - Bearish Crab checkbackA Bearish Crab Pattern has been completed. I'm waiting for the USDJPY to checkback at 144.56 and wait for a shorting opportunity. This could give counter-trend traders and opportunity to jump onto the trade.
GBPUSD-Weekly Market Analysis-Sep22,Wk5GBPUSD is on a bearish trend; you may wonder if GBPUSD will hit parity with the dollar. The next level of support is at 1.0554, the market has to break and close beyond the level before we talk about Pound Parity with the US. The immediate resistance level that I'm waiting for a shorting opportunity is at 1.1212.

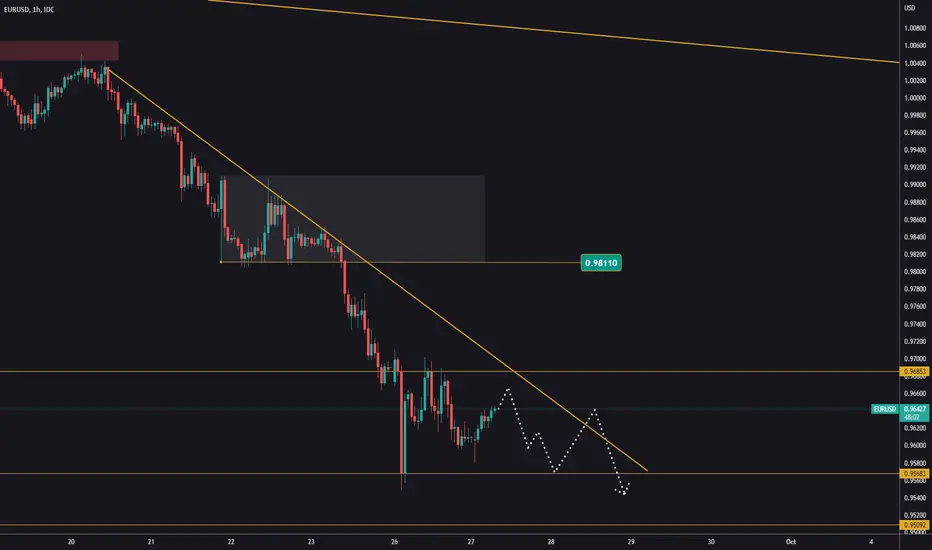
EURUSD-Weekly Market Analysis-Sep22,Wk5EURUSD is on a Bearish Trend, trend traders and trend continuation traders can wait at 0.9813 when the market retest the Key Resistance level for a trading opportunity.
Fed Meeting, War tension and recap of week 38Week 38 has been very eventful to say the least. On Wednesday we had the Fed raise interest rates by an expected 75 basis points for a third consecutive time. This created uncertainty within the markets which provided us traders with volatile conditions.
SPX went down 6.2% after the meeting on the 21st however the dollar gained even more strength which is continuing its increasing strength compared to main currieries such as the EURO and the GBP.
EUR/USD is now at 2002 levels (20 year low) and the dollar gains more strength over the Euro due to the uncertainty which is happening in Europe with the Russia/Ukraine War tensions growing even thinner this week.
Oil has also continued its downturn in price with a further 8% drop this week in price which makes the current month down 12%.
The UK interest rates also rose 2.25% to battle with the inflation fears, currently inflation in the Uk has dropped slightly Month on Month to 9.9% (10.1% in August). There are growing concerns in the UK and the BOE this week has admitted that the UK is now in a Recession.
More doom and gloom the for High-risk equities are on the arisen.
On a positive note, here was some of the trades we were able to get in on, some trade's took longer to form than others, some trades were taken as a result of the news this week.
Natural Gas Trade - Head and Shoulder Pattern with break of neckline.
SPX Trade - Reaction of the Feds Meeting on the 21st + Continuation of a Downtrend
ETH/USDT Trade - started the end of week 37 and carried onto week 38, we exited the trade on the 19th
USD/JPY - This was a volatile 24 hours following on from the 21st, the yen gained back some power, but this could be short lived as predictions are looking towards the 1998 high
Brent Oil - We have Been bearish on Oil for the month of September, we have a symmetrical bearish pattern which is one of my favourite patterns to trade.
I am currently taking this up as a hobby/ part time work and have been in this business for 2 years, any further information which could help will be welcomed massively as my goal is to provide useful information and chart ideas.
If you like the information and would either like to seem more weekly recaps or market forecasting for the upcoming week, please leave a like and a comment and I'll be sure to answer all questions provided.
Enjoy the rest of the weekend and all the best for week 39 see you soon!!
AUD/USD LONGAs market price drops through key areas of support, we reach an important support level at 0.658. With Further bullish confirmation and a rejection of this level we look to enter on our 15 minute time frame and target the 0.670 region.
