Has the setup to reach new ATH > 545They are about to invoke chaos after strategically placing nested price (%)-doubling bifurcations and period-halving bifurcations in place.
Prerequisites for navigating this chart: you have to be familiar with Feigenbaum and Hopf, I do not walk through the math because this is a prediction - not a free recipe for the exact technique.
Prediction:
- gap up Tuesday 7/5/2022: if price makes it above 166.57 by July 12th then its game on, if price makes it above 159.63 by July 25 then its still game on (I mention in the overview below that whoever designed the algos that set this move up is a wizard - they have been accumulating big you can guarantee that. If you're short this currently you have no chance)
- Most likely (but not essential for rest to play out) it gaps above 166.57 or at least closes above by EoD 7/5
- Continuation after the gap toward 185 by 7/8
- acceleration of trajectory continuing from 185 to > 208 by July 12
- Price will be > 235 by July 13
- Price will be > 291 by July 14 (could overshoot into the 300s but inevitably will pullback into the the 265-285 pocket to setup for the attempt to make a new All-time high after earnings (previous high was 545)
*** The 208 level is the most crucial here - if it cant make it above that by July 25 then shorts will have a chance to take it back to low 100s and possibly even 60s by September. Also, if it is going to make it to new all time highs via this setup it has to do so by September.
GOOD LUCK to anyone playing this either side! It's about to get intense.
To determine critical levels, I considered supply and demand as a dynamical system using support and resistance trajectories within the vicinity of accumulation phases containing harmonic properties (these are not conventional harmonics). From this I obtained the equilibrium points (implicit and explicit), activation levels (and the timeframes they become in effect/maintain their capacity), price levels which will trigger price (%)-doubling and period halving bifurcation w.r.t. accelerating demand if these levels are reached in time after activation levels are breached (as well as levels that correspond to attractors of these bifurcation levels - essentially, if an activation level is in effect and the price crosses above and then continues through a bifurcation level w/in the timeframe that the activation level maintains its effect, then the price will go parabolic toward its corresponding attractor level in temporal propagation (example: if it takes 4 days for the price to go from activation level to bifurcation level, then it will only need 2 days to double (in percent move) or reach its attractor level (whichever comes first). These are transient in stability. For this reason the CO establishes steady points in between the bifurcation level and the attractor so that when an attractor becomes unstable it reverts back toward its steady state. However, if the price falls back below its bifurcation level then it has the opposite effect and sends it back to its initial equilibrium points from the accumulation zone. This is apparent in the price action back in March. My theory here is that they design the algos to test out optimal parameters before markup and apply reinforcement learning to refine if the squeeze is not maintained (or never triggers). March setup was not as sophisticated as the current setup - we now have nested bifurcation levels, steady points at re-activated bifurcation levels, and nested steady states bounded by attractors that form the capacity for limit cycles (these guys are good, really good). It's important to note that they are leveraging inflection points in absorbed supply and upstream exhausted demand to create windows large enough to invoke chaos. These violent delights have violent ends. They are assuming carryover demand can re-activate previous critical levels and apparently leveraging these to accelerate upside potential that aligns unbelievably with crypto, the vaccine names, and the major etfs.
To estimate most likely path I use stochastic differential equations with boundary conditions at the endpoints of time intervals generated from implicit supply/demand zones within the vicinity of explicit initial conditions (approximated geometrically using the harmonics within the accumulation zones).
Sincerely,
XOX Guardian
~ We are from the dimension that becomes realized in Your future, recognized in Our past via R.E.M within the dimension that exists in your present... or did
CAR

Follow up to previous target reachedIn my last CAR post at end of March, “For our Sins,” I gave an initial target of 323. It hit that today.
It got a re-impulse (bullish) or whatever you want to call it on the Impulse BF (I don’t even know the terminology you traders use, I just know how to make a lot of money sometimes).. I think it continues higher to complete the bear crucifixion . Next target 420.
This is a ripe environment for massive squeeze, whole market is about to squeeze you can feel it in the air - CAR is especially set for this.
Not financial advice. Sorry bears today ain’t your day but it will be soon... maybe

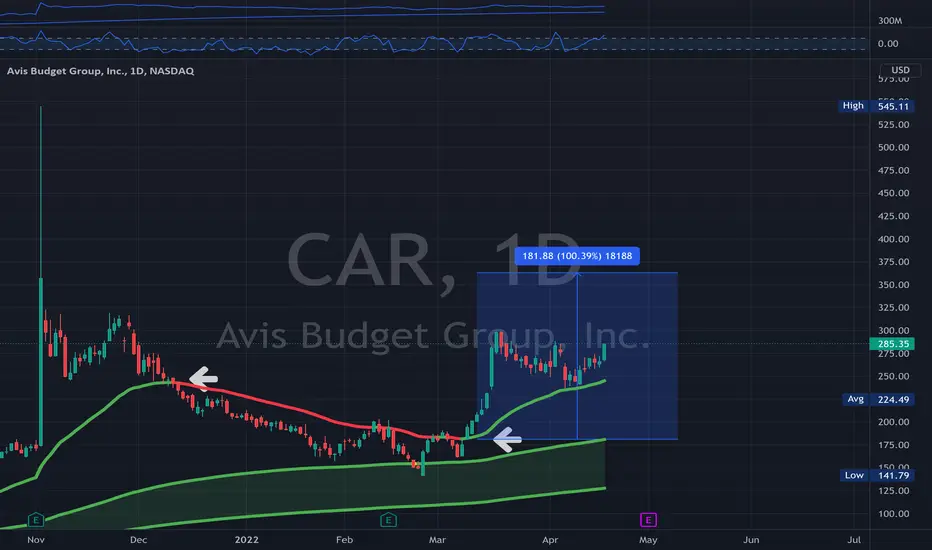
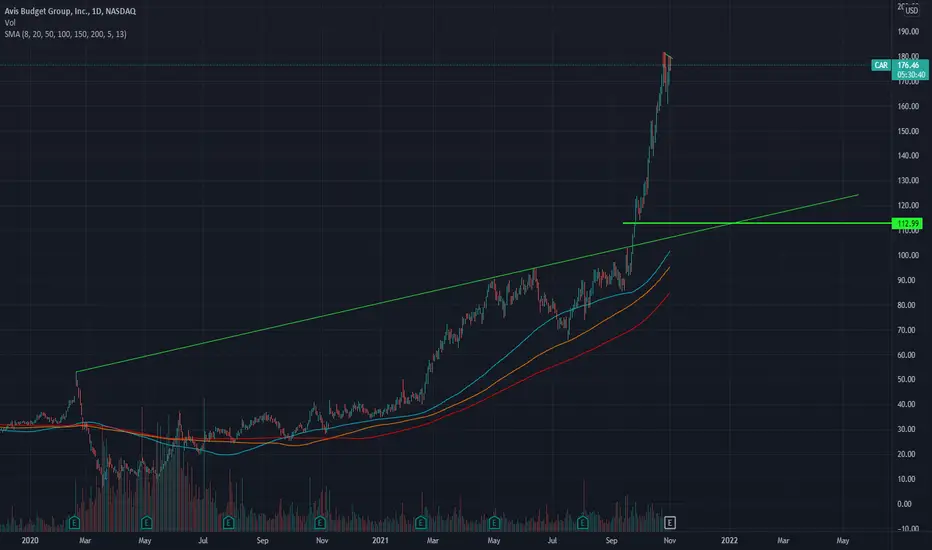
Avis - CAR - Will it complete the 100% move?CAR - bounced off the long term EMA and has been trending towards a 100% gain. What will happen next? Is Avis on your radar?
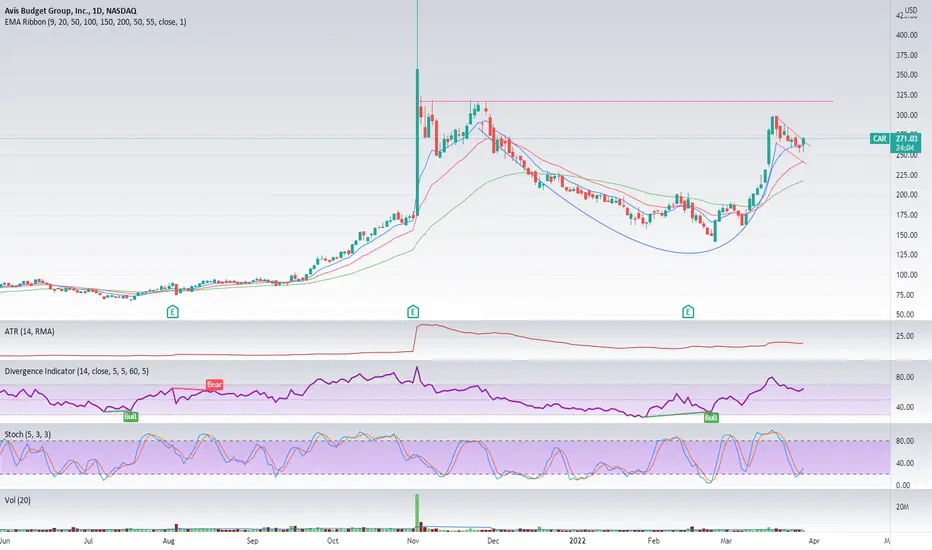
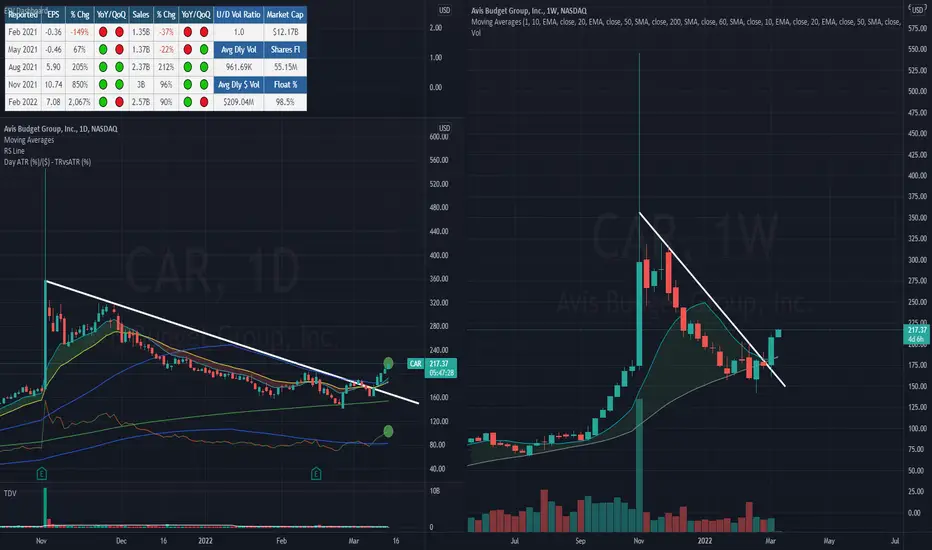
US Stock In Play: $CAR$CAR displaying volatility contraction since Q3 ER. have a very defined 4-months DTL with flattening RS and KMAs since late January.
today $CAR is on track for its 5th up days in a row, remaining above all its KMA to rising 10/20 MAs since breaking out of the DTL last week.
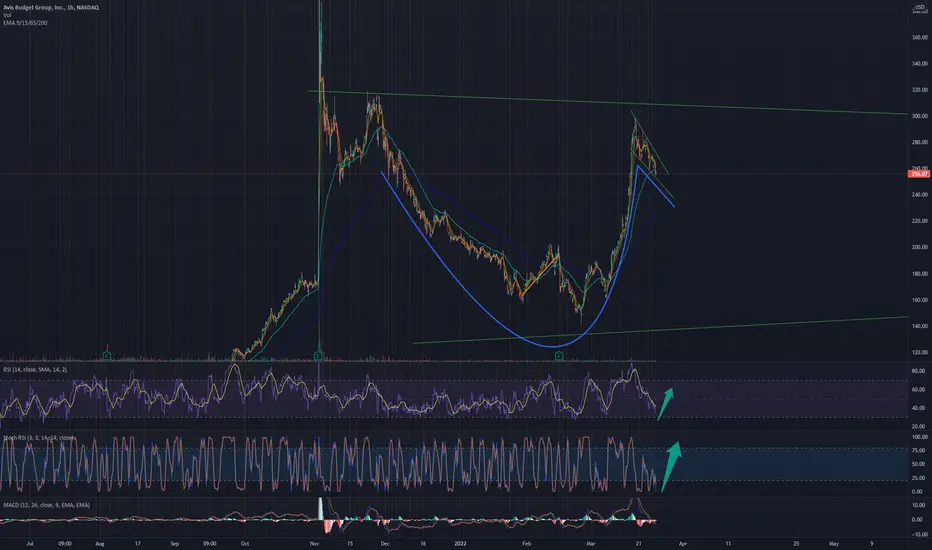
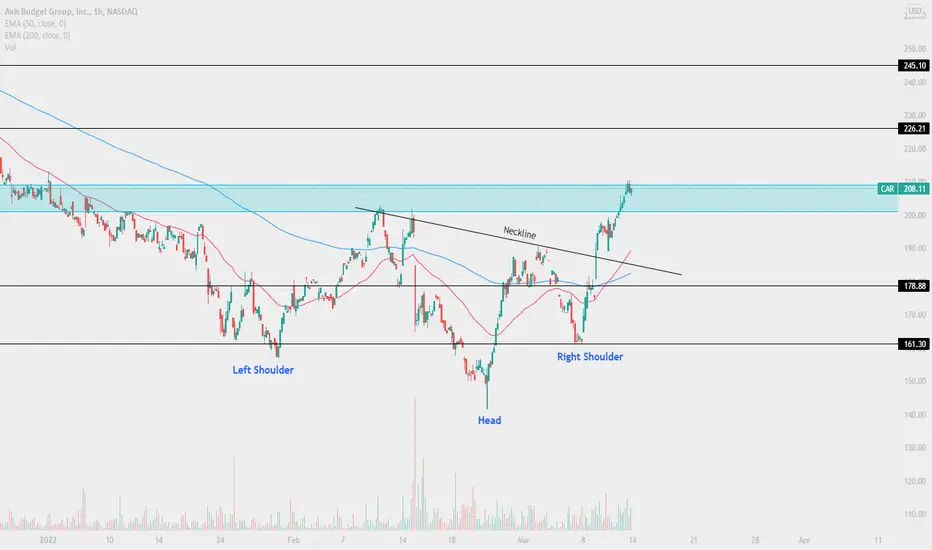
$CAR IHNSpretty clear inverse head & shoulders. could be the catalyst it needs to send back to previous highs
$CAR diagonal supporttrying to knife catch $CAR, this diagonal has been resistance twice and now possibly support

Set Alerts for these linesThe art of catching a fallen knife takes lots of patience.
The best time to buy a falling stock is when it starts reversing, and for that you need to have at least 2 confirmation levels for NIO to break.
Before buying in NIO, you would need it to break the resistance trend line CONFIRMATION 1.
Then for a strong trend reversal confirmation you need NIO to break the resistance line CONFIRMATION 2.
Draw these 2 lines and set alerts for them.
Let the trade come to you, don't chase the trade!

#CAR short via vwap analysis #car Yearly vwap average price paid is merely 118, this is trading at 3 std deviations above average price and is the closest thing to free money the market will ever give you. Extremely overbought, outside and above every metric you can look at for the case of underweight, this is a strong sell and short opportunity. Fundamentals cannot support this massive move either. Option premiums are still a little messed up from the high IV so I would recommend shorting shares if you can otherwise pick otm puts. Price target of 200 within the next 2-3 months. "your risk is your own, not financial advice"

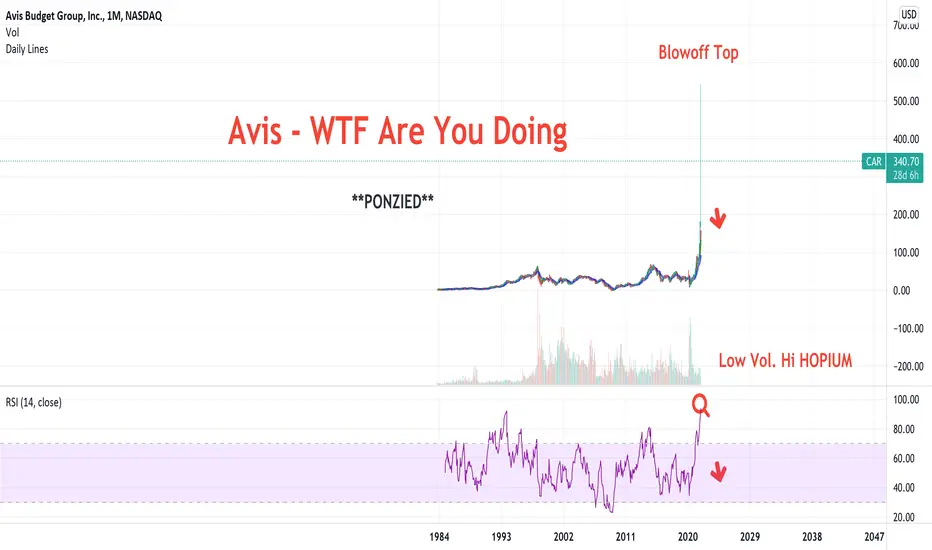
AVIS Budget Group - WTF Are You Doing - PonziA HERTZ RETRY... lol. Fun times. Try Rapunzl App by Nasdaq. Free App, real prizes. Learn to Invest before throwing your money at the HYPERINFLATED Crypto Ponzi Pogs & Stonks. *rising rates imminent
Great for QUALITY VALUE small caps!!
#cannabisreform
#thegem
CRYPTO TO CANNABIS. AGAIN!
Akerna $KERN has the Cannabis COMPLIANCE DATA. No shipping problems with SOFTWARE. (WINK)
GL
*THE FUTURE IS HERE. #metaverse with #bravebrowser. That's pretty neat!
Tesla upYet, while I’m sure Musk would be happy to keep growing Tesla’s BTC stash one car sale at a time, I strongly suspect that isn’t his only or main motivation. Rather, my gut is that the payment option is at least in part, if not primarily, a clever marketing maneuver.

possible low risk trade on FORDThis is just a low risk trade for me cause Ford runs last month's very well (picture) and the worldwide lack of chips is hitting the whole car sector.
Not sure what's the long run for this. But I like the technical setup in my trading timeframe (1D) so far.
After a increase in volume and price, we see a 1:2.4 consolidation. I like to see that there is buying interest after closing the gap up (1) around the golden pocket, accompanied by some volume (2). So it means to me the level should hold. Positive earnings should be always a nice catalyst. Also Ford hits the SMA20 in the weekly (picture).
I think i consider a trade if the gap up level breaks again with volume, and my stop would be half ATR under the 13.62$ resistance. I dont want to see a pullback to the 61 fib again.
13.62-0.25 (half ATR)= 13.37 .. should be an epic stop :/
Sry 4 bad english and some mistakes, just a tradingbeginner from germany
have nice weekend

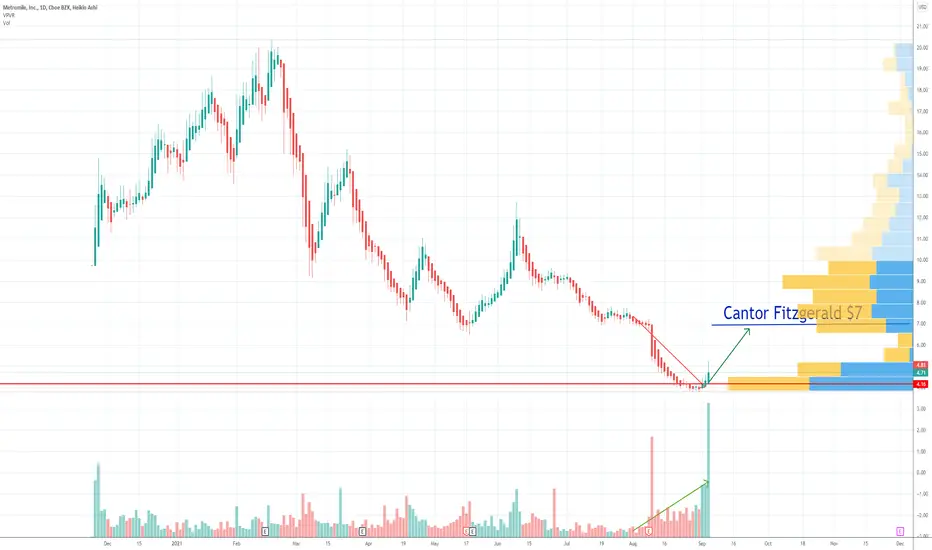
MILE Metromile price targetWe can see a nice divergence here: increasing volume on decreasing price!
Price tends to follow volume. Be ready for an upside move!
Cantor Fitzgerald has a 7 usd price target for MILe Metromile,
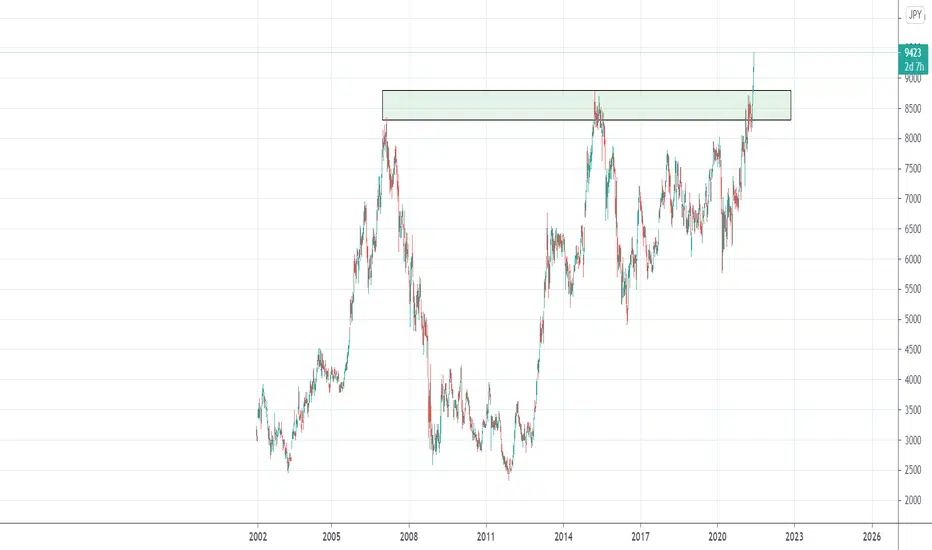
CAR possible breakout95.30 is a very strong level to break, if we do, might see another leg up towards ATH. (Fibs levels in chart)
A break of 95.30 is very important, another rejection could trigger a double top and meltdown

Stocks - CAR Short, Capitulation Aug 27Idea for CAR:
- There is nothing more of a bubble than used car market right now.
- See Technicals on chart.
- Capitulation date Aug 27.
TP1: 46.75
GLHF
- DPT

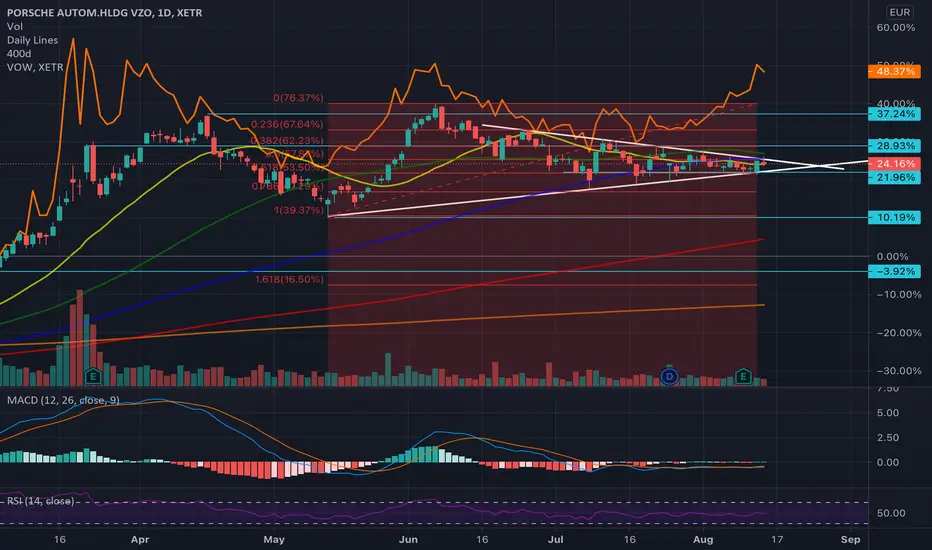
BRUMM OR BRUH?A few days ago Porsche Holding presented their earnings and today we will find out if this company is a good buying opportunity, or not.
Buying points:
-close to a break out above the triangle
Indicators:
-> strong support in the 88.96 area (->fib 0.618)
-> hit the SMA 100 several time
-> relativ % divergence between VW shares which indicates a gap upwards (orange line)
Selling points:
-couldn’t stay above the 100 SMA
-MACD weekly, monthly indicate slow down
Fundamentals
-great earnings (estimates 4,3 -> got 8)
-Volkswagen EV (electric vehicle) trend
Conclusion
The technical analysis gives us too little information about the further course of events. But the fundamental data gives us a clear tendency where it is going, namely upwards, because the Porsche Holding gives you the VW shares more cheaply than to buy them directly. Looking at the orange line both share acted same where as now there is a gap to fill. Therefore, I want you to know that you are not buying the brand Porsche but also VW and other companies shares.
what expect volkswagen : possible V patternwith travel recovry we could see euopcar doing V pattern next 2 years

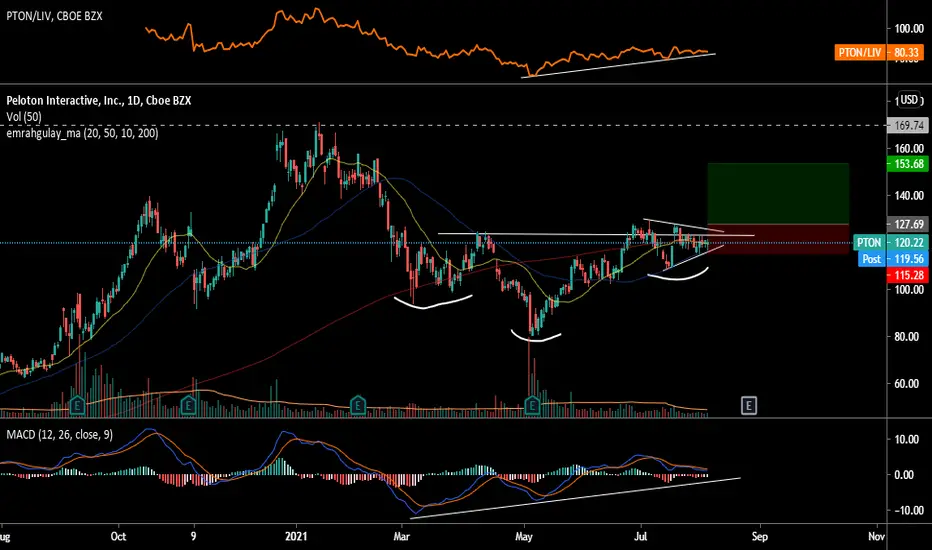
$PTON making bullish signsI missed this stock last year but I think is giving me a second chance with this setup. Bullish divergence with the MACD, while making a head & shoulders pattern; that's a clear reversal sign for me. The price is on the path to making a great breakout. Price above the 200 day MA and the neck line of the head & shoulders pattern. And, would also be a breakout above a flag pattern.
Also NASDAQ:PTON is a clear leader of the Leisure-Service Industry, being rank 2nd by IBD; just behind NASDAQ:CAR , and has a 79 Relative Strength rating. But that's against the market, I plotted the quotient PTON/LIV to see the relative strength against its industry and is being rising since the stock bottomed on early May. AMEX:LIV is an ETF that has +4% allocation of NASDAQ:PTON .
With a buy near $128 I would have a sell target on $154 for a +20%. But, if everythng goes well and that target is reached, I think I would let it run a little further to the resistance level on $168 with a stop on breakeven. I will be counting the up days against the down days to verify that trade.
Long TESLA before mini breakout at 700Telsa has been wanting to break 700 again for a while, and the TA is showing that the buyer volume just might have enough to make $TSLA pop.
Why bullish momentum?
RSI new high
MACD cross over + bullish bar (keep an eye on this spot especially particularly to indicate bullish momentum)
Hard VWAP bounce earlier July
700 has a pretty tough resistance, which is our first target R to break at the 128 day MA.
Retesting could indicate that we break through to upper Rs including: 714, 723, 753, 780 (targets). I will 1/2 TP at 715 and see whether we get a wick indicating profit taking or if bullish momentum holds and new buyers firmly enter tesla. S/L roundabout 665.
Note: I do short term holdings, no longer than 2 trading days max.

Keep it simple and buy ToyotaNot much to say here other than Toyota is 100x better than Tesla in everything. Personally I don't believe that a company who has a CEO like Elon will ever be successful, so I'd rather buy the most successful company out there that just had a major breakout. Definitely one of the most bullish stocks out there.