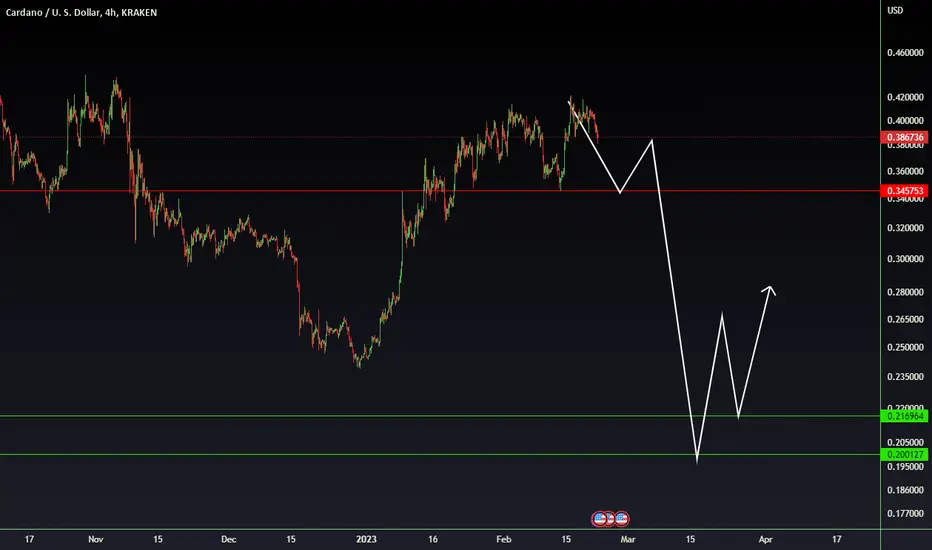
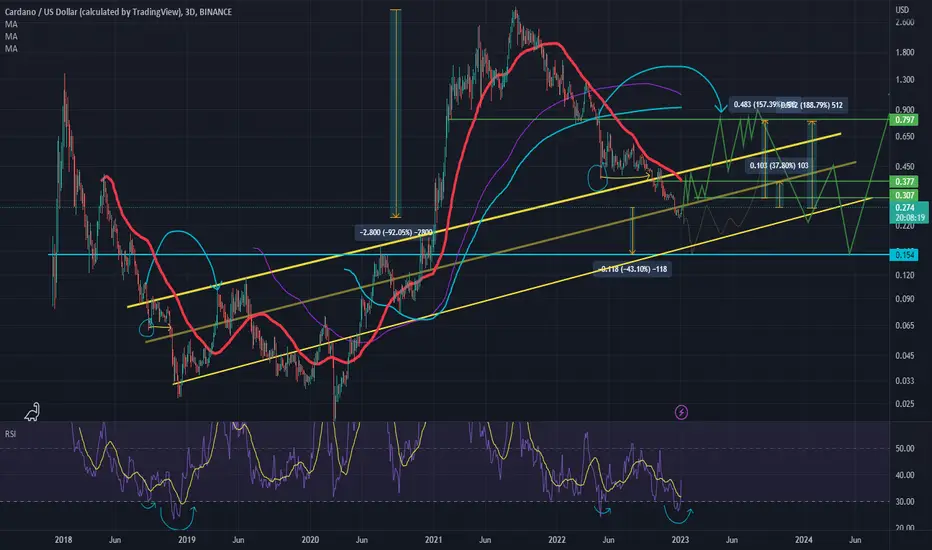
Cardano shortCardano bounced off the 0.618 Fibonacci retracement level. Bearish movement is likely to continue and reach the 0.222.
Cardano

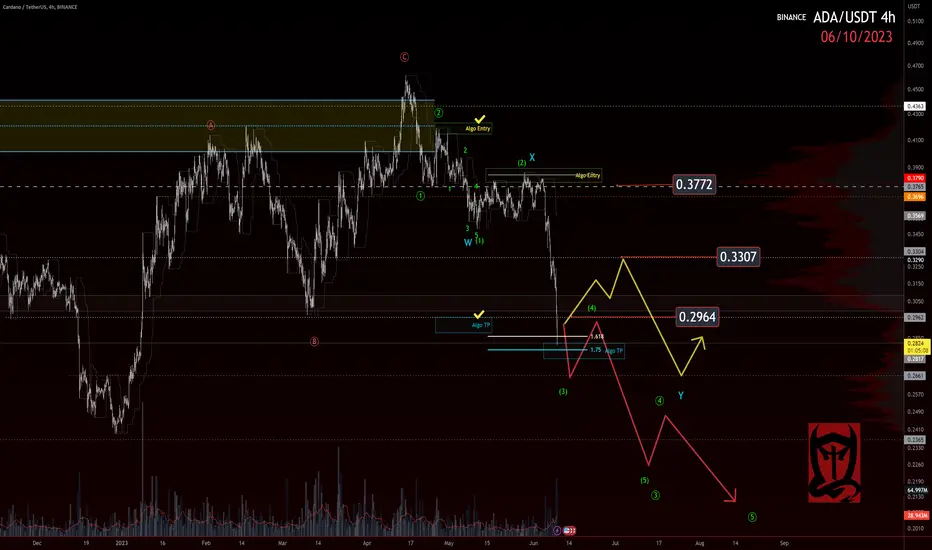
💥ADAUSD 4H-TIMEFRAME ANALYSIS💥ADAUSD 4H-TIMEFRAME ANALYSIS
💗Hello ladies and gentlemen
This is my new idea for 💥Cardano
I hope my idea is clear
Support me by like and share thank you
Stay Safe💯💲💲💲
Good luck💰😍
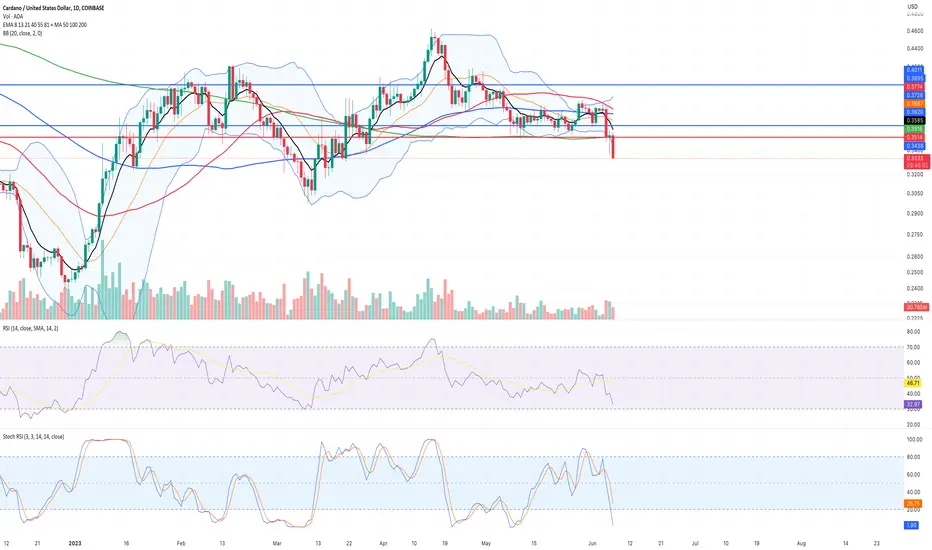
Cardano in free fallHi guys, let's look at the current situaition on Cardano on 1D price chart.
In my previous idea I indicated strong support line at 0.3018 but I expected that the price at least will test this line first and only after that will break it.
In any case, that support was broke and there is another one at 0.249 which at the moment also seems to be broken but I expect some correction from here.
It also important to look at volume on 1D timeframe. Today, there is extremly high volume and for me it's good indicator that from current level will be some correction. But I don't expect big correction though.
If this post is useful to you, you can support me with like/boost and advice in comments.

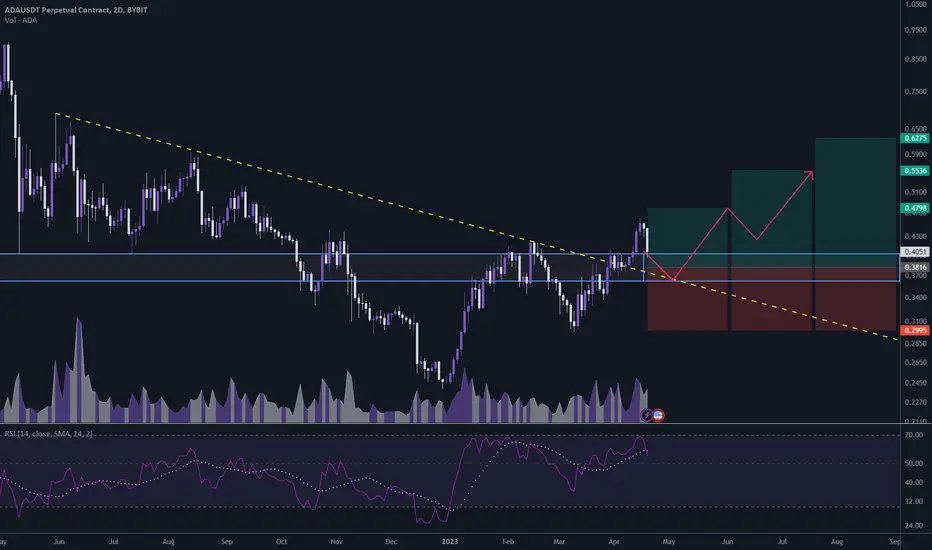
$ADA/USDT 2D (#Bybit) Descending trendline breakout and retestCardano is pulling back to 50MA support and seems to be done with the downtrend, let's prepare for mid-term recovery.
⚡️⚡️ #ADA/USDT ⚡️⚡️
Exchanges: ByBit USDT, Binance Futures
Signal Type: Regular (Long)
Leverage: Isolated (2.0X)
Amount: 4.6%
Current Price:
0.4051
Entry Zone:
0.4014 - 0.3618
Take-Profit Targets:
1) 0.4798
2) 0.5536
3) 0.6275
Stop Targets:
1) 0.2995
Published By: @Zblaba
CRYPTOCAP:ADA #ADAUSDT #Cardano #PoS #L1
Risk/Reward= 1:1.2 | 1:2.1 | 1:3.0
Expected Profit= +51.5% | +90.1% | +128.9%
Possible Loss= -43.0%
Estimated Gaintime= 3-4 months
cardano.org
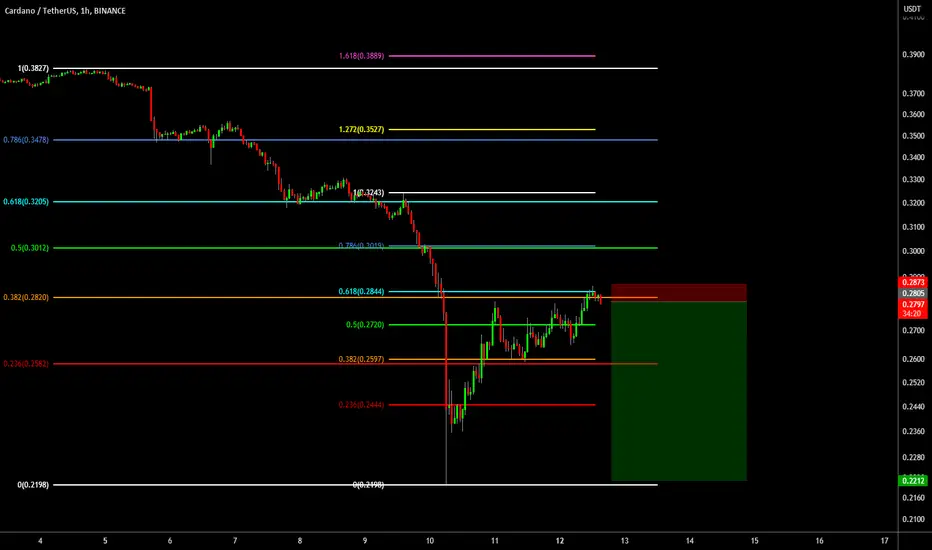
🔥 ADA Double Fibonacci Reversal In Anticipation Of Huge WeekOf all the major alts, I'd argue that ADA has seen one of the biggest drops. However, ADA has regained around half the value it lost over the weekend.
As seen on the chart, ADA is currently experiencing heavy resistance around the 0.283 level, which coincides with both the 0.382 (June high) and 0.618 (last Friday) Fibonacci retracement levels.
With a very heavy macro week incoming (CPI & interest rates), I wouldn't be surprised if ADA will see another drop soon.
Target at the recent lows, SL over the local high. One could take partial profits around 0.26
I Cannot Short This !!!The ADAUSDT is in a Bullish phase by strong bullish rejection.
The price shows a strong bullish rejection from the PRZ ZONE.
⬆️Long if we break the 0.236 fib level
🌟 Bullish signals are:
- strong bullish rejection
- PRZ ZONE
- Bottom of bollinger band
⭐ Note if the PRZ is broken downwards with the strength of Bearish candles , this analysis of ours will be failed.
✅If this post was useful for you, like it ❤️ and if you think it is useful for your friends, be sure to send it to them.
_ _ _ _ _ _ _ _ _ _ _ _ _ _ _ _ _ _ _ _ _ _ _ _ _ _ _ _ _ _ _ _ _
🌍Thank you for seeing idea .
Have a nice day and Good luck.

ADA - CARDANO - in charles we trust ; the neverending story IVADA - CARDANO - in charles we trust ; the neverending story IV
Ok, this ship looks to me to be turning.
its all there on this blessed chart. which i diligently read the tea leaves for you to succeed in this casino.
cardano did 100x+ TWICE. from the same frigin price point in two different cycles. iam pretty sure she goes for a third. does it all play out exactly the same? maybe, prob not, but i bet it will be pretty similar.
key points here;
check that momentum signature at the bottom there. the same shape. same levels basically. maybe we get that second option for another nuke 40% or so but my money (irl) is on that relief bear market pump first. then some black swan to wipe everyone out again and thats when cycle 3 begins.
this will be my last ADA chart for awhile. think ive been over doing it. now we've had some interesting price action it was time to do this last one and sit back and see what happens.
I AM ACCUMULATING
lfg. take me to the promised land charles.
SOL, ADA, LINK,NEO,TEZOS AND FILECOIN analysis for JuneLast Saturday gave us multiple entries on multiple coins. And as I always say ,price will hit your entry zone mostly during bad news (in this case the lawsuit against Coinbase and the attack of SEC on some coins like ADA and SOL).
Disclaimer: This is not a financial advice and please do your own analysis before investing and only invest what you can afford to lose.

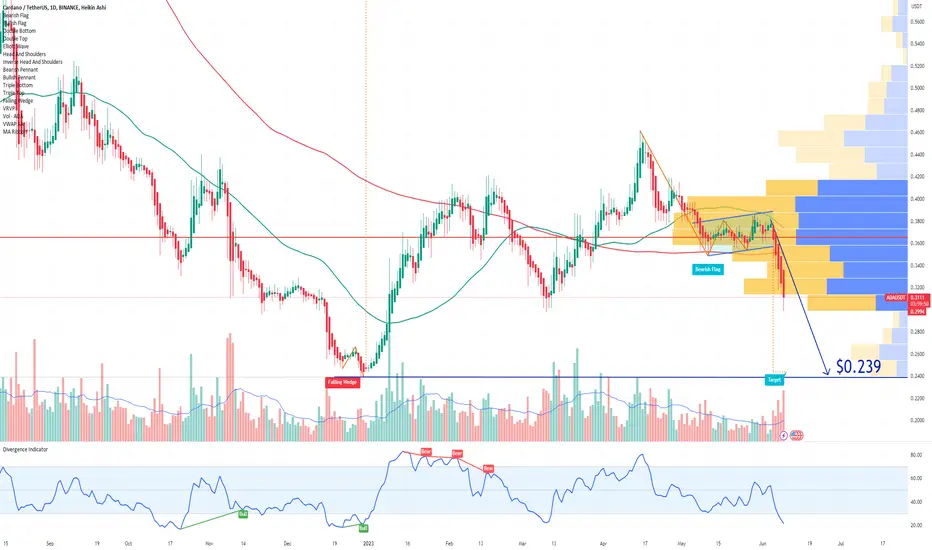
Robinhood to delist ADA Cardano If you haven`t sold ADA here:
Then you should know that Robinhood, the well-known trading platform, will discontinue its support for three cryptocurrencies implicated in SEC lawsuits against Binance and Coinbase.
Effective from June 27, 2023, Robinhood will no longer provide support for Cardano (ADA), Polygon (MATIC), and Solana (SOL).
In My opinion ADA will test the support of $0.239.
Looking forward to read your opinion about it.
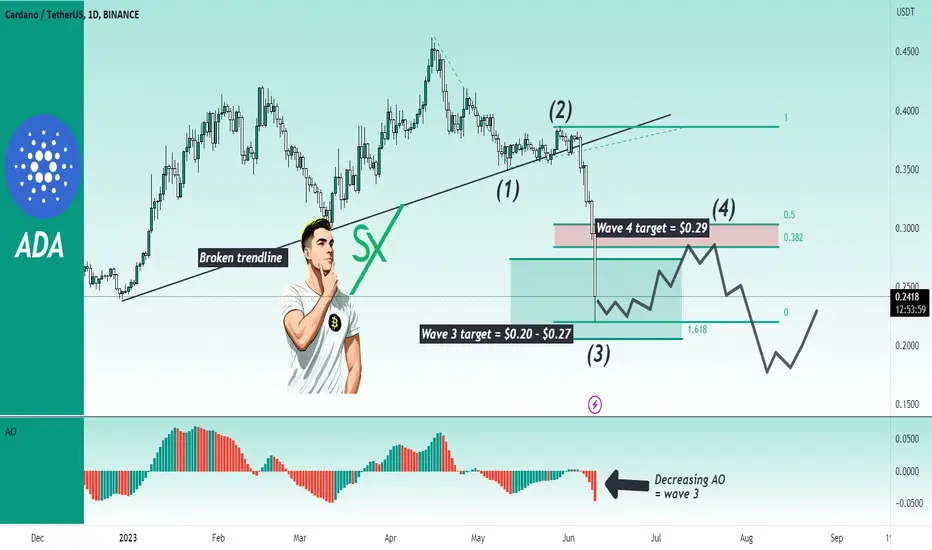
Cardano (ADA) will finish bear market!Hello, everyone!
Now it's time to talk about my favorite altcoin BINANCE:ADAUSDT . Couple of weeks ago I told you that the huge rapid dump in wave 3 is anticipated. The forecast was almost correct. The only one thing, I assumed that bull trap in wave 2 will be a little bit higher, but anyway $0.22 price target we have seen today.
To understand what is coming next let's take a look at the price chart. After the bullish rally which we have seen in the first half of 2023 BINANCE:ADAUSDT has started it's last bearish impulsive wave. Wave 1 touched the support trendline. After the consolidation in the wave 2 we have seen the huge impulsive breakdown. Wave 3 had two targets $0.27 and $0.20. The area between these two prices is the target area which has been reached today.
Awesome oscillator is also increasing the momentum to the downside, which confirms my assumption about the wave 3. If we assume that wave 3 has been finished or almost finished we have the clear target for the potential bounce where our automated trading strategy close the accumulated on this dump positions. The target is 0.38-0.5 Fibonacci retracement which is approximately $0.3.
After the bounce I expect the last bearish wave 5 inside the last bearish wave in the entire bear market. It's too early to measure the target for the bear market bottom. We need waves 3 and 4 to be completed, but anyway I am ready for the upcoming bull market in the nearest future for Cardano. At the same Bitcoin can dumping, but BINANCE:ADAUSDT can show the sideways or even recovery during this period. If you ask me about my personal feeling about target price - I think $0.17 is gonna be the bottom.
Best regards, Ivan
_____________________________________________________________
🔥Please, follow me and smash the rocket🚀 button to support me🔥
ADA...not this way! Not like this!If you find this info inspiring/helpful, please consider a boost and follow! Any questions or comments, please leave a comment! Also, check out the links in my signature to get to know me better!
This swift move down does not look great for the coin. Broke some pretty clear yuge levels, MO. So now for me its the waiting game. I could see either of these play out. But in the end I will be waiting for an nice impulse up and an internal retrace before an attempt at a long on this asset, I stll have my bags... wont be adding anymore to them atm.
Cardano is going to $0.02 (2 cents)Cardano is going to $0.02 (2 cents)
The bear market has not begun. Charles Hoskinson is a scammer. The FED confirmed this and 99% of other cryptocurrencies as securities.
There is no hope left. Abandon all hope!!
ADA Head & Shoulder PatternHello Guys, Hope you are doing fine.
ADA is making a bearish head and shoulder pattern
We wait for the break-down of the neck-line with high volume for aggressive entry or if with low volume then a conservative entry on retest of the neck-line.
If you like the idea then don't forget to hit the like button and follow for more easy trading setups.
Post your comments below.
Thanks

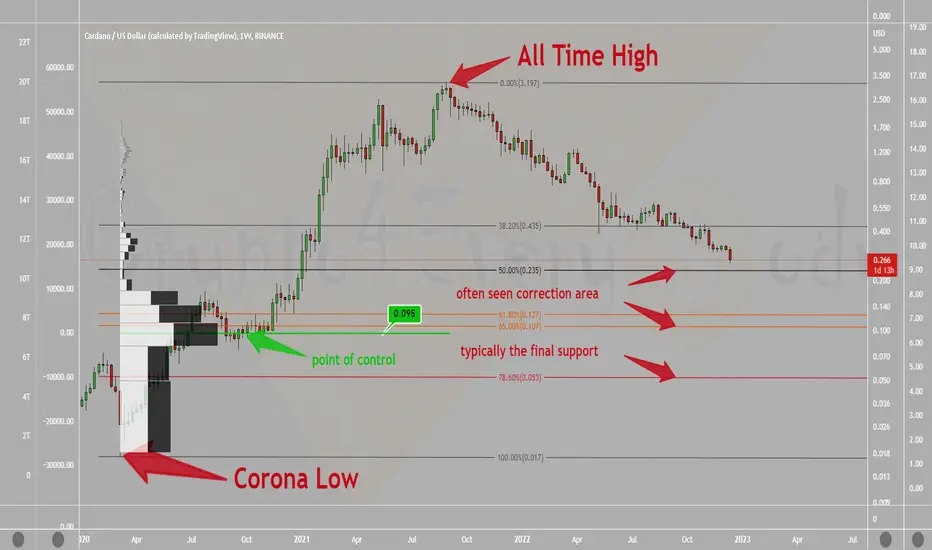
Cardano non popular chart 💔Update:
Cardano non popular chart 💔
I HODL ADA for long-term
Looking on weekly chart without emotion and bias...
ADA might correct🔻much lower dear Crypto Nation
Even $0.095 or $0.053 would not be the end of future price gains - just Log-Fib
Let me know your thoughts in the comments🤗
⬇️⬇️⬇️
Likes and Follow for updates appreciated🤗
Disclaimer:
Not financial advice
Do your own research before investing
The content shared is for educational purposes only and is my personal opinion
ADAUSD Rejected Three Attempts to Break Key Support#ADAUSD bulls holding strong at the $0.38 demand zone after three consecutive attempts to break below. But that's not all, a recent breakout above the downtrend trendline has added fuel to the bullish pattern. This is a clear indication of complete bullish domination, and we're excited to see where it goes from here.
But we're not jumping in just yet. We need to see a daily close above the current resistance before making our move. And when that happens, we'll be on the lookout for a buy trade setup, targeting a potential 10-15% profit.
Stay tuned for updates on #ADA and other exciting coins as we continue to monitor the market for potential trading opportunities. This is a time to be bullish, and we're ready to ride the wave!

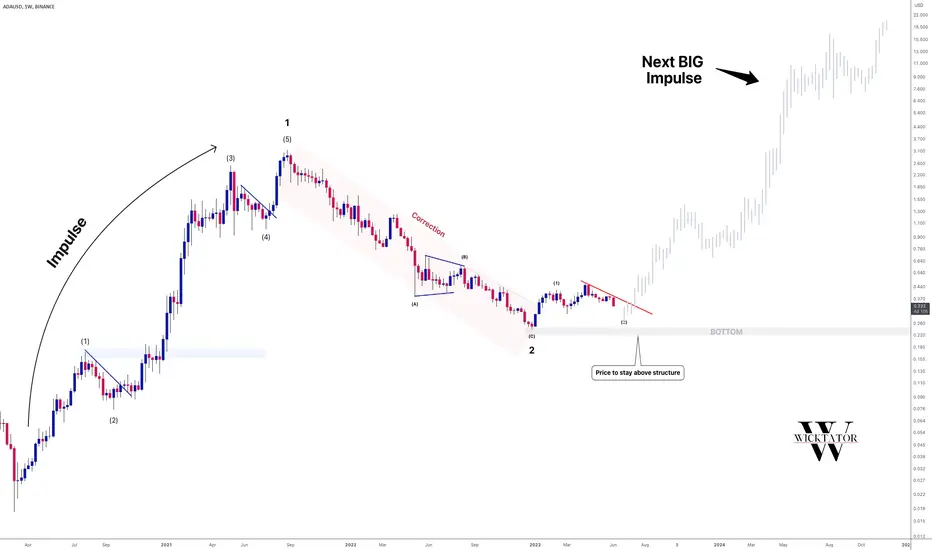
CARDANO - Catch This BIG Impulse!Cardano is setting up for a big impulse. We've recently seen the completion of wave 2 correction and broken out of that correction. We are now in bullish waters and seeing a nice deep retracement which is great news for us as we've got the bottom in place. This means the lower it goes, the better.
Trade idea:
- Safe entry on break of red trendline
- Stops below the bottom
- Targets: 1, 3, actively manage rest
Goodluck and as always, trade safe!