ADA bullish divergencePlease feel free to share your view on this pair down below in the comment section. I'm more than happy to be challenged and have an interaction on this idea.
Also make sure to leave a like as it helps me out a lot!
------------------------------------------------------------------------------------------
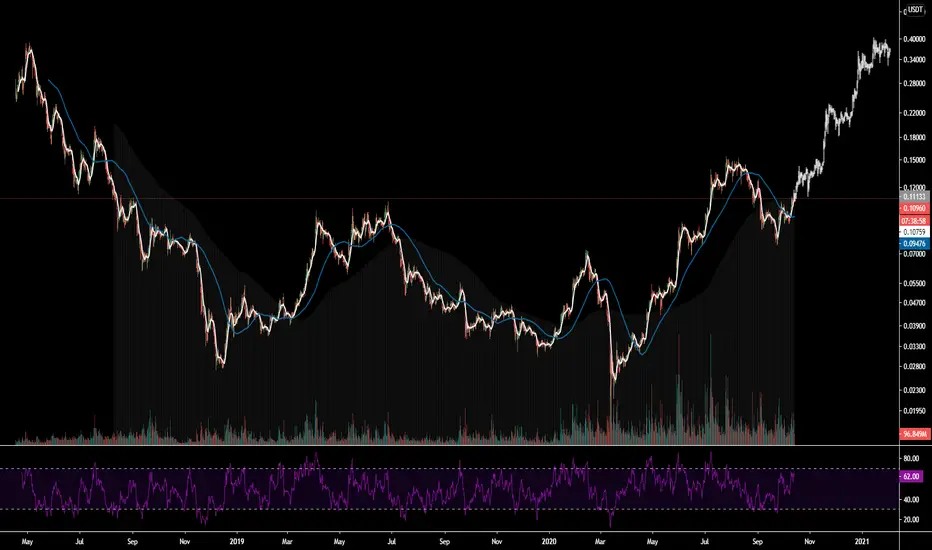
Cardano is looking interesting. Finding support on the range it was in for over almost a year. With a bullish divergence on the RSI.
When it touched here in november we saw a nice 50% rally towards the resistance at 936.
If Bitcoin retraces and fulfills its blow-off top, we could see Cardano move further toward the 1200 level.
What do you think about ADA? Long term hold? Or just a trade?
CARDANOADA

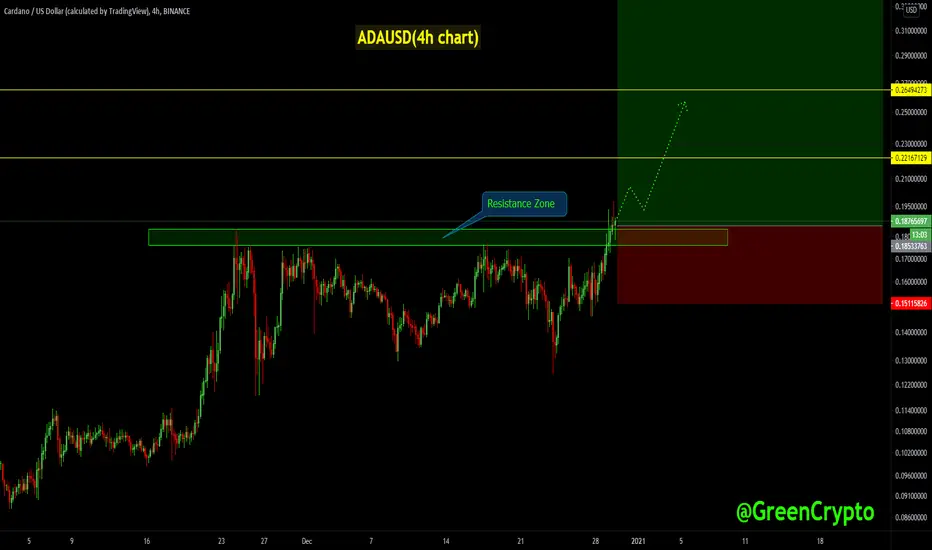
ADAUSDT (Resistance Zone Breakout)#ADUSDT Technical Analysis Update
Resistance Zone Breakout
ADA/USDT currently trading at $0.186
LONG ENTRY level: $0.183 - 0.190
STOP LOSS: below $0.150
Resistance level 1( Target 1): $0.220
Resistance level 2 ( Target 2): $0.265
Resistance level 3 (Target 3): $0.40
Max leverage: 3X
ALWAYS KEEP STOP LOSS...
Follow our Tradingview Account for more Technical Analysis Update, | Like, Share and Comment your thoughts.
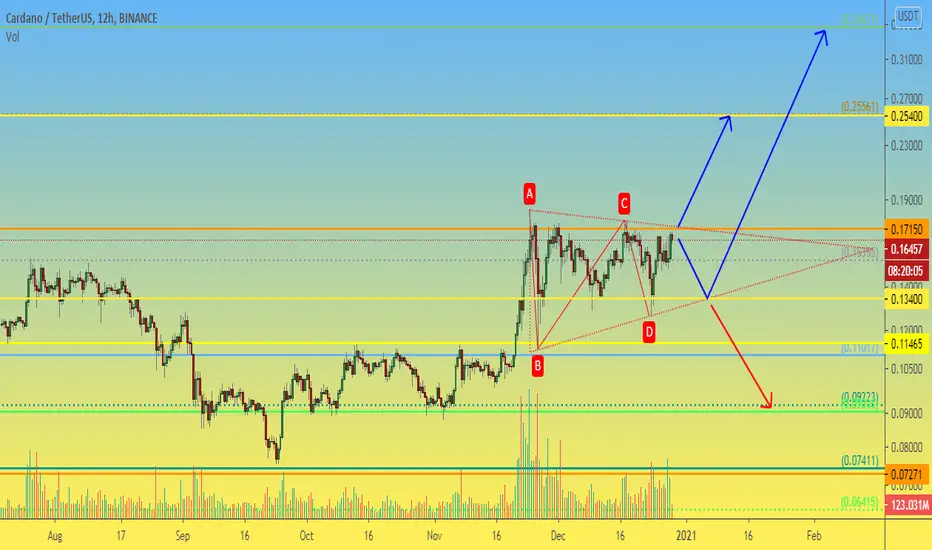
ADA 12h still can shoot wellAlmost a month has passed since the publication of the previous ADAUSDT global idea.
Since that time, the critical level of $0.17150 has withstood a hit from the bottom for the third time, and a low of the trade was $0.12630 with the forecasted $0.12000.
ADA has not yet responded to the phenomenal BTC growth like altcoins can, and it looks like ADAUSDT rapid growth is included in buyers' plan soon.
Fixing the price above still unbreakable level of $0.17150 will give a green signal for massive purchases, and accordingly, growth to $0.25400 and maybe to $0.34600.
However, it is worth mentioning that BTC closed yesterday's daily candle with a bearish pinbar.
It is not yet known for sure how Bitcoin will be fixed: in fiat or they will start transfer it into altcoins.
Therefore, one more the ADA price decline to the level of $0.13400 should not be overlooked.
Below this level, a breakthrough to $0.09300 may happen.
_______________________________
Since 2016, we have been analyzing and trading the cryptocurrency market.
We transform our knowledge, trading moods and experience into ideas. Each "like under the idea" boosts the level of our happiness by 0.05%. If we help you to be calmer and richer - help us to be happier :)
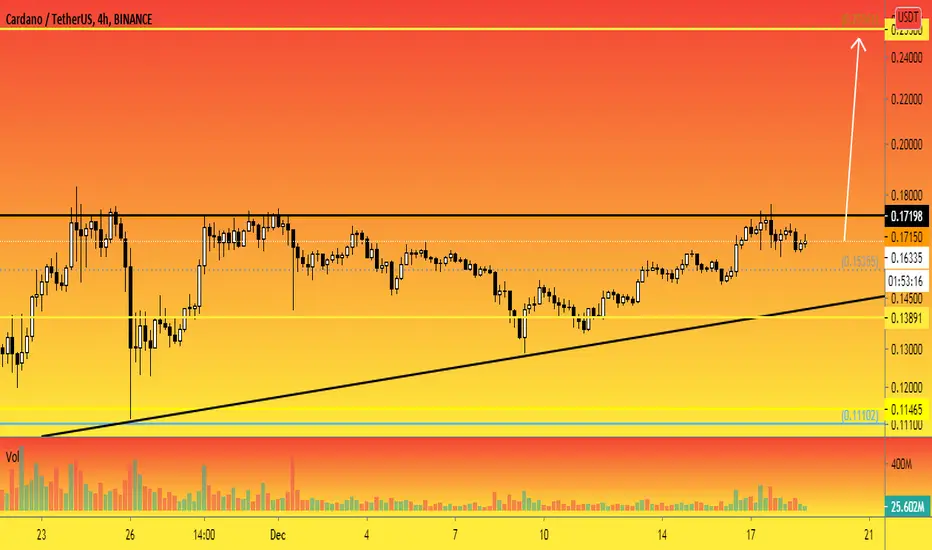
ADA-4h. The next target - $0.255.Any event in the world does not pass without consequences.
A sharp ADA growth by 60% since November 20 has provoked the formation of a global triangle. The price is still traded within its limits.
The critical point - $0.14 . However, the probability of breaking the triangle up is much higher.
The problem of breaking the $0.17 mark is a long history, dating back to 2018 . However, there is no time to delve into the details of this problem - because it is a short-term idea!
The next important target of buyers is $0.255. That's where we will wait for the price after fixing above $0.17.
____________________________
We create both short-term ideas (for a local understanding of the market situation) and medium-term forecasts of price movements.
Subscribe to us and get daily concise analytics!
CardaNOOOOOO Go Go Go Need to bounce at the Mid Range a.k.a 0.618 of the fib, turn it to support and here we go ! btw is the lower Band on the Bollinger things and is it a inverse Head and shoulders Sir ?
Let's do it or Die together, Plz Mr Charles Hoskinson My family need this money ;)

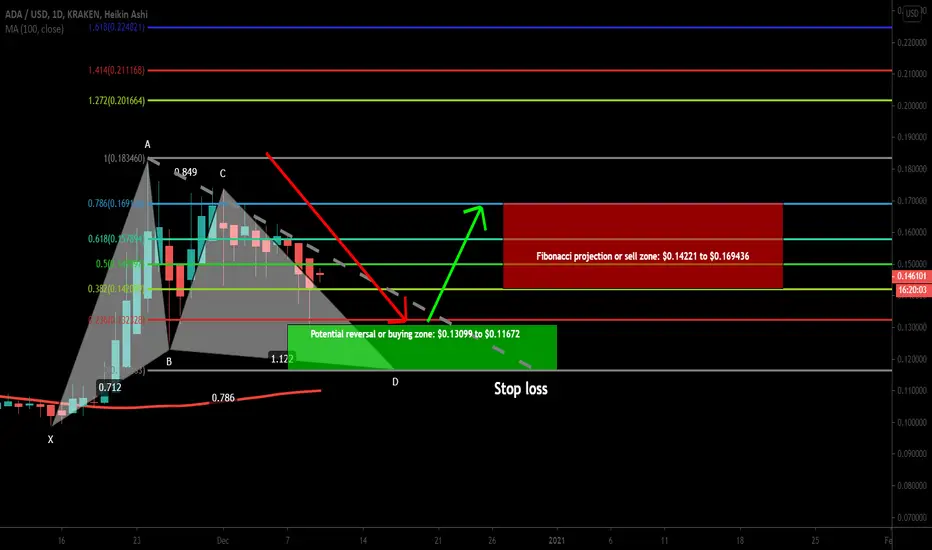
ADAUSD formed Gartley | Upto 45% move expectedOn daily chart, the price action of Cardano has completed bullish Gartley pattern and spiked in the potential reversal zone. It may give another chance to catch it from the PRZ level. There are also 100 simple moving average support below the potential reversal zone.
Buying And Sell Targets:
The buying and sell targets according to harmonic Gartley pattern should be:
Potential reversal or buying zone: $0.13099 to $0.11672
Fibonacci projection or sell zone: $0.14221 to $0.169436
Stop Loss:
The potential reversal zone area that is up to $0.11672 can be used as stop loss in case of complete candlestick closes below this level.
Possible profit and loss ratio:
As per above targets this trade has a profit possibility of 45% and as per the above-mentioned stop loss, the loss possibility is 11%.
Note: Above idea is for educational purpose only.
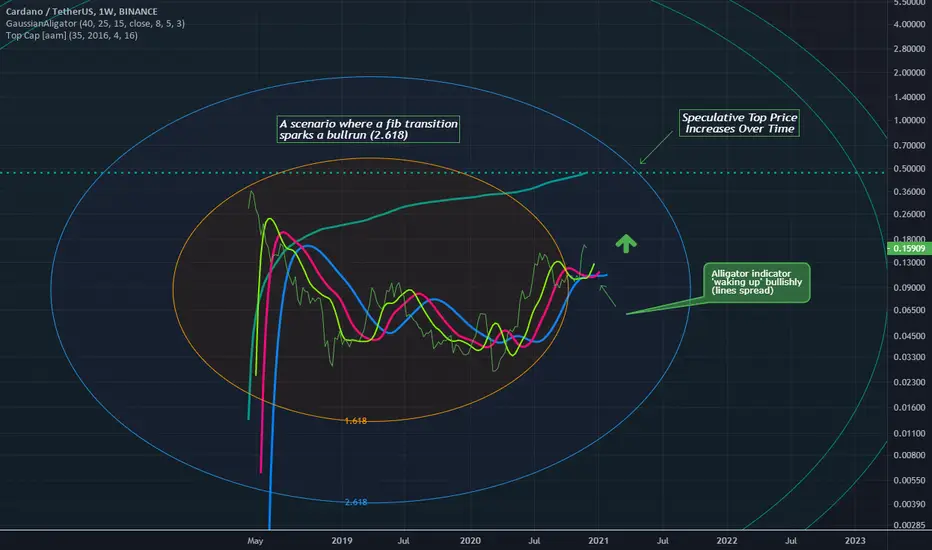
Cardano ADAUSDTUsing fib circles we can see a clear transition.
This sparks the bull move.
Also using the alligator indicator to see this bullish opening.
The Top Cap indicator is speculative and im not sure it applies to alts, but ive applied circumstances that fit ADA.
I am neutral on this one, (its not in my portfolio) however im sure the bulls will outpace.
There seems to be a large disconnect between crypto and potential bearishness of SPX.
Cheers,
Bixley
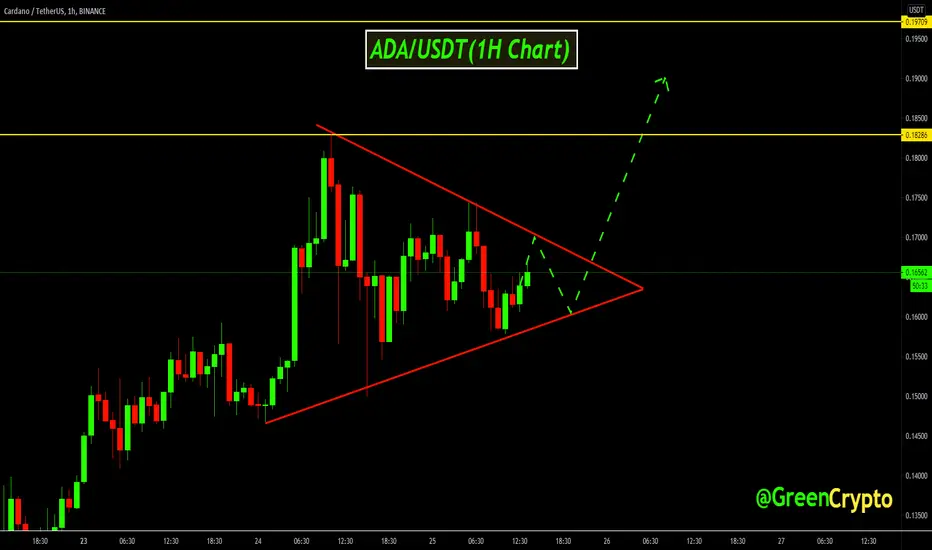
ADA/USDT (Cardano) SYMMETRIC TRIANGLE BREAKOUT#ADAUSDT (1h Chart) Technical Ananlysis Update
Symmetric Triangle
ADA/USDT currently trading at $0.68
LONG ENTRY: Only enter long after Symmetric Triangle Breakout in 1 h chart
STOP LOSS: I will update soon
Resistance level 1( Target): $0.182
Resistance level 2 (Targe ): $0.195
Resistance level 3 (Target ): $0.235
Max Leverage: 10X
ALWAYS KEEP STOP LOSS...
Please Follow our Tradingview Account, Like, Share and Comment your thoughts
Cardano - Daily Update Bottom Line: Watching for evidence the wave ii of (i) correction ended.
Outlook: Expecting $ADA to recapture its 0.1542 high and beyond.
Analysis: Cardano has been in recovery mode. A break of 0.1542 is the next upside objective for the bulls. Higher in a subdividing wave iii patterns. The bulls are in control while 0.0756 stays intact as support. This is Key support for our outlook.
Key Levels:
Above 0.1140; 0.1279; 0.1542
Below 0.0882; 0756

My 3 targets to reach up in Cardano!!! All revelead!!!The price of Cardano it's approximately at $0.10 cents and it's so cheapest to buy. At the moment, one of the best strategy if to goes to a crypto broker to buy 10,000 ADA contracts. The best strategy it's to have a lot money to recover losses if Cardano make their devaluation. So guys, in general, Cardano it's my favorite cryptocurrency and it's my top #2 crypto to invest and inject more Cardano to re-accumulate and benefit of their adoption.
I show you this model on what Cardano make. Guys, the question it's could Cardano make to reach up these targets??
I have these 3 targets in psycological point to sell or to continue hold it.
If you want to buy Cardano, you can to going to a crypto broker to buy it as leverage, but be secure to have a enough capital to recover it and don't over-leverage!!!
So guys, this is it, I will going to continue update Cardano tomorrow check out the weekly timeframe and Daily to find up good bullish movement!!!
Guys, I invite you to check my Cardano fundamental analysis and my top 8 cryptos to invest in 2021

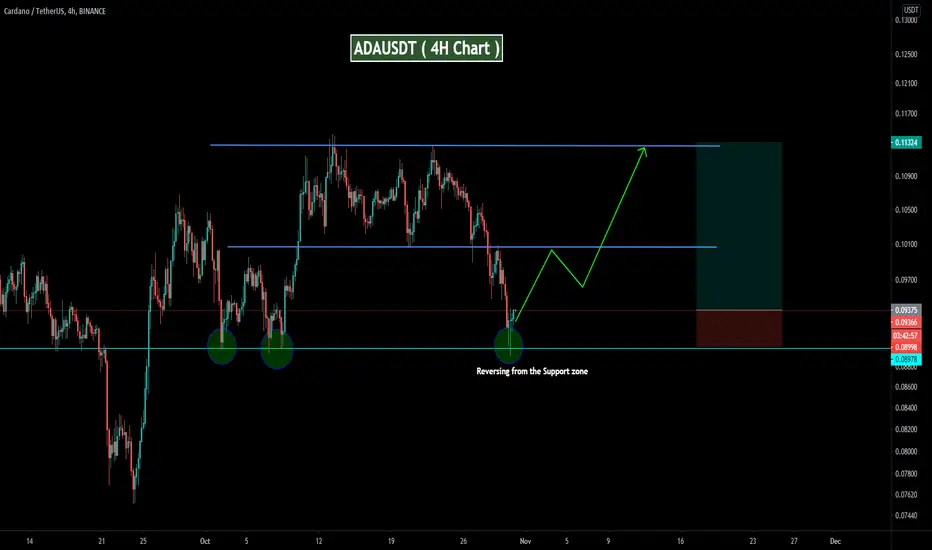
ADA/USDT (Reversing from the support line)ADAUSDT : Strong support at 0.089 and Now ADA started reversing from the strong support level.
Entry level : 0.089 - 0.093
Resistance level 1: 0.100
Resistance level 2: 0.113
Resistance level 3: 0.128
Resistance level 4: 0.153
Stoploss: below the support line (0.089)

ADA Cardano Inverse Head & Shoulders on Double Bottom NecklineGiant double bottom on weekly
Daily inverse H&S on the neckline retest

ADA Has Surged More Than Any Top Coin And Still Has PotentialHey friends, hope you are well and welcome to the new update on Cardano.
As per my previous idea the ADA turned bullish from the potential reversal zone of bullish Butterfly and recovered more than 14000% and became the most strong bullish coin among top cryptocurrencies. Now the price action has found firm support above 0.786 Fibonacci projection of A to D leg of this bullish butterfly and re-testing this level as predicted.
Previous bullish Butterfly idea:
Priceline is retesting the 0.786 Fib projection after execution of idea:
On daily chart the price action is at the support of up-channel. The volume profile is showing less interest of the traders below the resistance and high interest of traders even below the support which is bit critical but the priceline of ADA has also strong support of 200 simple moving average below the support as well.
On the long-term weekly chart the price action of Cardano is trying to breakout the $0.105 resistance level. If this resistance will be broken out then it has next resistance at $0.14. But in case of rejection by this resistance of $0.105 the priceline of ADA has next support at $0.085 then $0.065 and $0.027 respectively. In the meanwhile the priceline is likely to form an up channel and at recently it has bounced from the support. The stochastic also has given bull cross.
Conclusion:
As the priceline of ADA coin is at the resistance of $0.105 and having previous support at $0.085. Therefore if it will be rejected then there are strong chances that it will be moved up from there because the pric action also has strong support of 200 simple moving average on daily chart almost at the same support level of $0.085. However we can expect that the priceline won’t break down the support of expected channel on weekly chart.


ADA.USDT (Y20.P3.E5).Looking for the next longHi All,
Observations:
> Looking at the structure, it makes plenty of sense that we have likely hit the top on this impulse being point 5
> The indicators on the Daily show a bearish divergence and the chart below showing the downward pressure
> Target 1 equates to the height of the Triangle
> We have had an upward parallel channel with a upward wedge on the last section, indicating a squeeze at the top
> The 21/50 EMA acting as support for ADA's upward trend
The following chart below demonstrates , with a possible wedge to demonstrate the squeeze to the top before dropping to the 0.5 or 0.618 fib retracement level.
8 HRLY chart > Downward pressure on the indicator
My thoughts:
Stay away from ADA going long at this point until we have further confirmaitons;
Please give me a like or tick for this post
Regards,
S.Sari

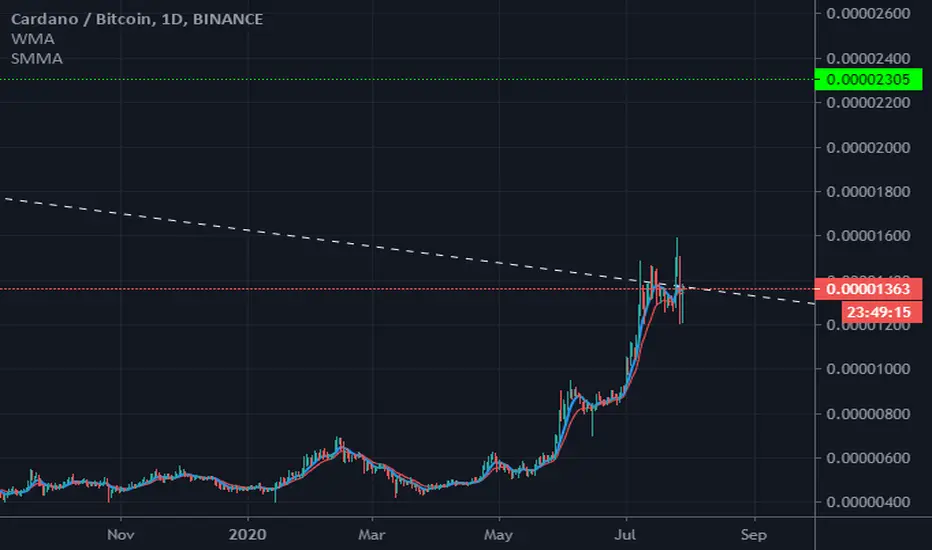
ADA/BTC: Assessing ADA's Insane Parabolic Move 2D (Jul. 27)X Force Global Analysis:
If you find our analyses to be helpful, make sure to support us by dropping a ‘like’
Parabolic moves are extremely common among cryptocurrencies, as there are no market brakes like the stock market. In this analysis, we analyze ADA's insane parabolic move through the parabolic curve model, and assess its probable next moves.
Analysis
- Firstly, a parabolic move is normally consisted of 4 bases, or phases of consolidation
- It starts with the asset consolidating and breaking out, only to consolidate at higher levels
- This step continues as the asset keeps breakout out to higher levels during shorter periods of time
- Eventually, this leads to the formation of a parabolic trend
- In the case of ADA's BTC pair chart, we can see that it has already gone through four phases of consolidation, marked by base numbers
- At the end-point of base 3, the asset is normally most likely to double.
- ADA has seen a 80%+ move from the end-point of base 3.
- As the parabolic trend extends, not only does ADA have a hard time reaching new highs, it also has formed a massive extended bearish divergence
- The bearish divergence shows higher highs on the price and lower highs on the Relative Strength Index (RSI)
- The Moving Average Convergence Divergence (MACD) shows a potential death cross as the bullish momentum weakens
What We Believe
We believe that ADA had a phenomenal bullish rally. However, considering the nature of parabolic trends, it's important for traders to wait for further confirmation for a bullish trend negation.
Let us know what you think in the comment section below
Trade Safe.

ADABTC - Resistance can't hold foreverCardano price respects levels pretty nicely, but I'm still waiting for the breakout and 1704 satoshi. At resistance again and it was tested a lot.
If BTC continues to be bullish I most likely will see 1704 sat, otherwise we're going to test 1208 support again (placed bids there).
Hit the "LIKE" button and follow to support, thank you!
Information is just for educational purposes, never financial advice. Always do your own research.

Watching for Smart Money in the Daily Perspective for ADA/USDHello everyone,
Hope all is well. Thought I would expand on the topics yesterday by looking at the daily perspective of ADA/USD. As I am looking wide and starting to hone in. The recent uptick causes excitement for some life. It is important to layout what is ahead of ADA. Where are the decision points for smart money. To help people plan on important price point battles on either direction.
What did I do:
• Drew horizontal rays for resistances/supports
• Drew date ranges
Setting:
I will be pointing out the different resistance/support lines in order by date as we saw a descend in the market from ‘18 and on. Makes it easier for me to report it.
January 4th, 2018 – Resistance $1.39
May 3rd, 2018 – Resistance $.3878
July 18th, 2018 – Resistance $.1963
Dec 7th, 2018 – Support $.02704
June 26th, 2019 – Resistance $.1070
March 13th, 2020 – Support $.01801
July 7th, 2020 – Support $.1070
Test:
Our nearest test is to the test our support of .1070. As ADA has made the recent jump to turn the resistance level into a support level. Some encouraging signs. Our next big daily test seems to be at the $.1963
Ideals:
Bullish Idea: Healthy support bump from .1070 to give confirmation of its support. Then attack round figures in similar fashion that ADA did between March 13th to July 7th.
Bearish Idea: Failure at this support would cause a fear as it would need to find a new support. There support is at the 1-2 cent range as they show reversal in direction of the trend.
As always, I am only a small prey in this jungle. History will help us prepare for the future.
Happy Friday! Enjoy yourself, take a walk, read a book, drink a beer, enjoy family or friends or hobbies.
