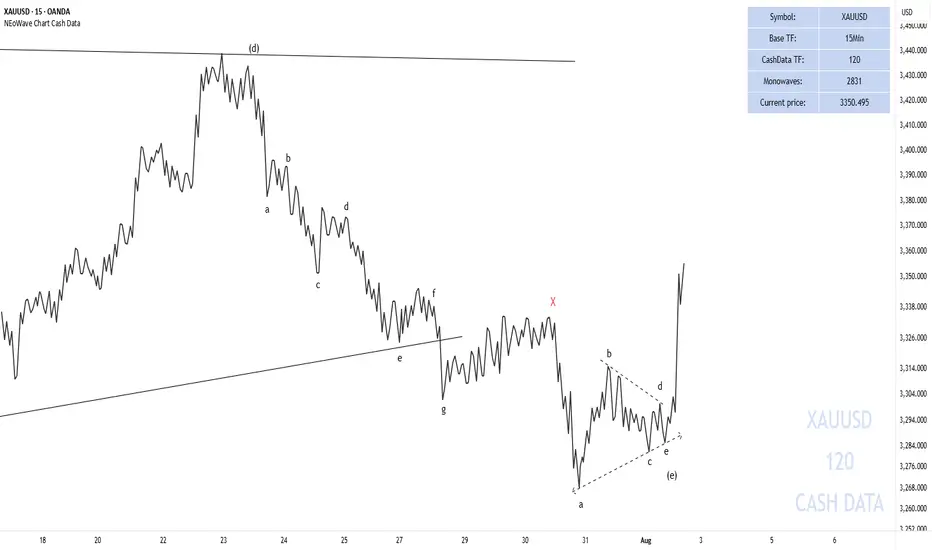
End of GOLD correction#GOLD #XAUUSD
UPDATE
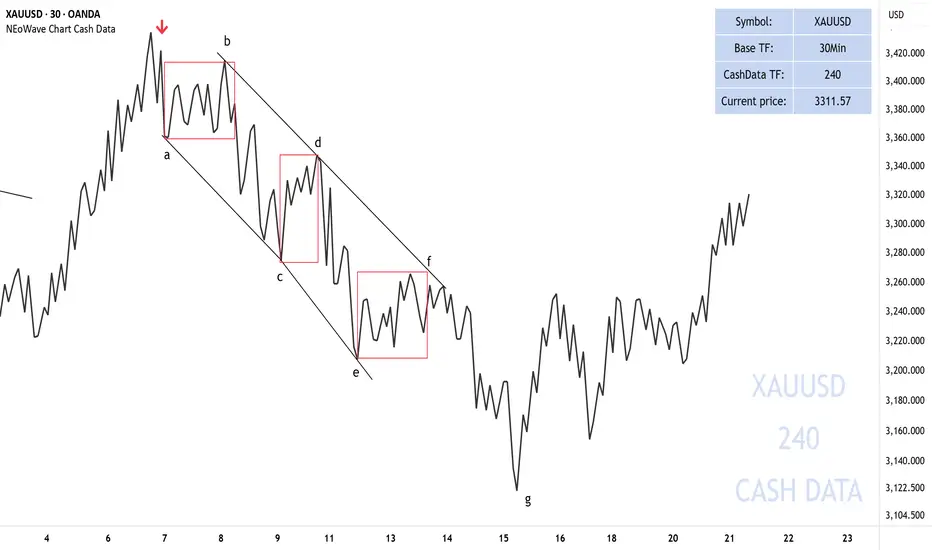
As I mentioned earlier, gold was forming a contracting triangle.
The wave-(e) of the triangle has formed a double pattern diametric-X-triangle and has moved beyond my expectations (the post-pattern movement has passed ), breaking the trendline of (a)-(c). However, since it did not exceed the end of wave-(c), the contracting triangle has not been invalidated.
We expect gold to gradually rise from this range and surpass $3,500.
Good luck
NEoWave Chart
Cashdata
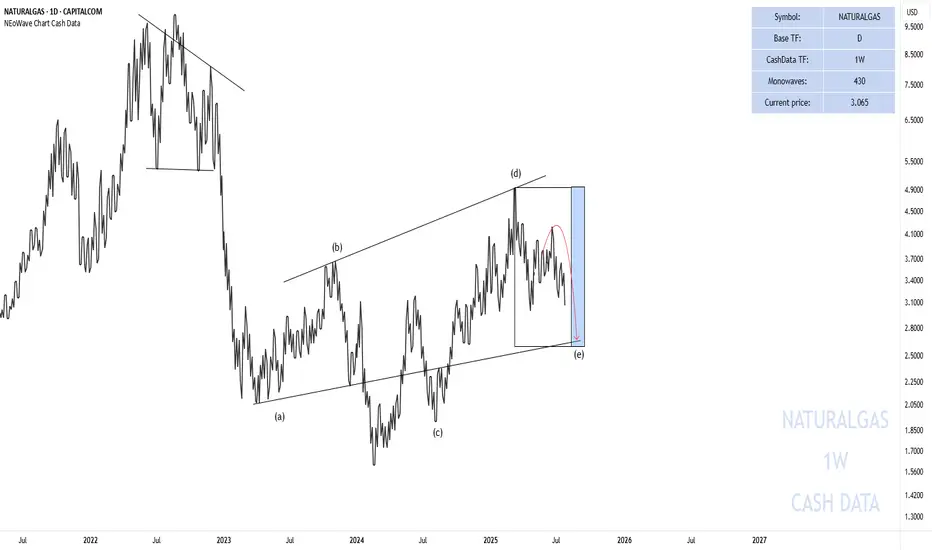
End of the Wave-(e) Natural Gas
In the previous analysis I said that:
Currently, wave-(e) is forming and I do not expect a strong upward movement until August 12-September 12 and this wave can take time until the time range I specified for it.
In the picture you can see that the price has started to decline again exactly from where we specified and has fallen by 27% so far. The price is not necessarily going to fall to 2.66 but time must pass and the price must enter the specified time range.
Good luck
NEoWave Chart
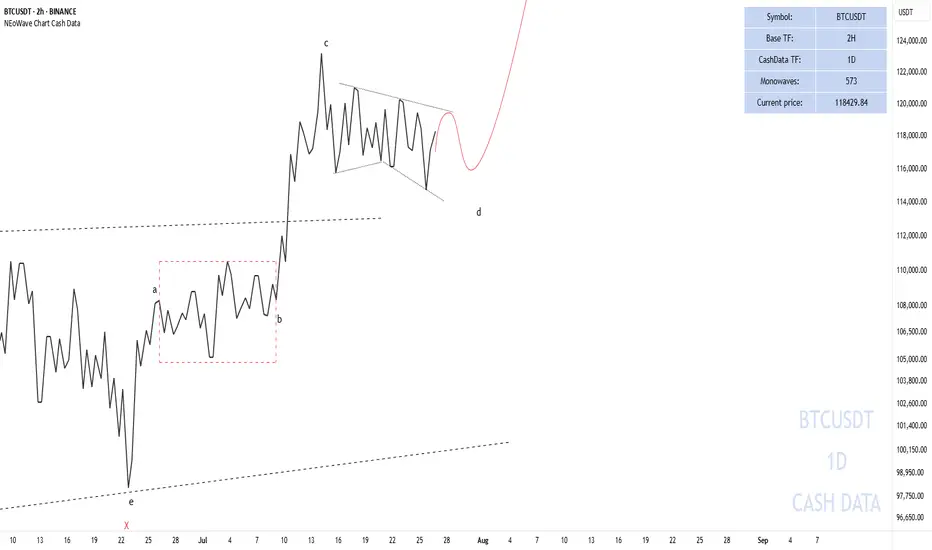
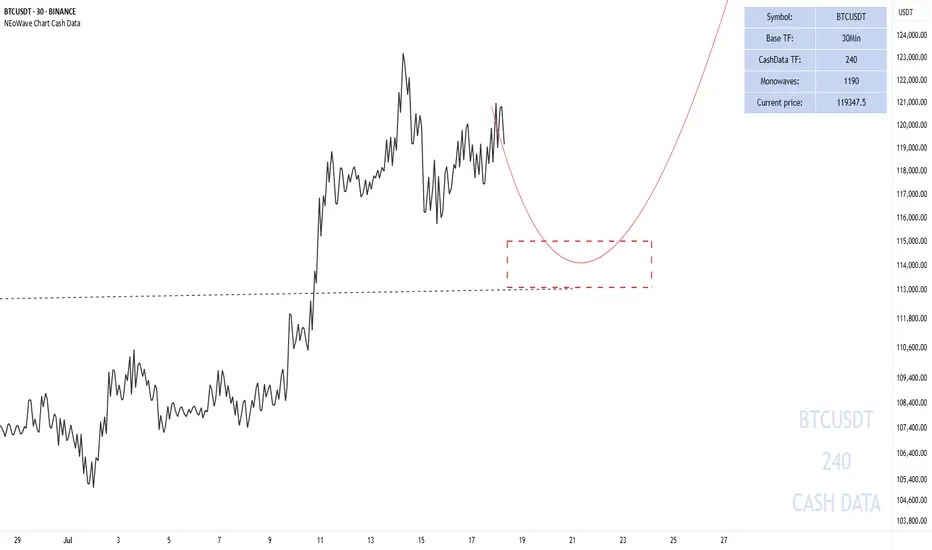
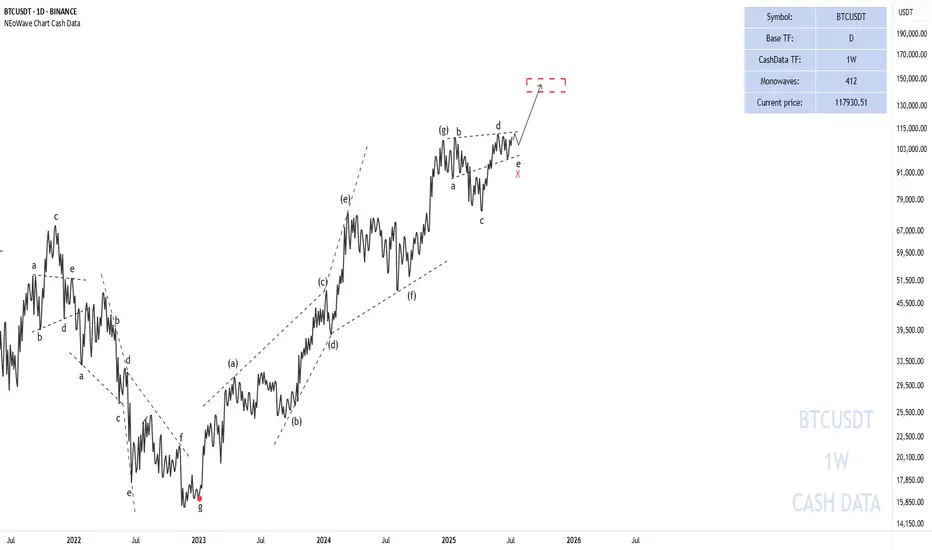
Pessimistic scenario for BITCOINAfter Bitcoin touched the price of 123,218, it entered a corrective phase. According to previous analysis, we expected the price to touch the range of $115,000-113,000. With the formation of more waves, it seems that the recent correction that started on July 14, 2025 is a diametric (bowtie) where waves f and g of this diametric are not yet complete and this pattern is part of a higher degree diametric and after this pattern is completed I expect a move towards the range of 140,000-150,000
Pessimistic scenario:
The pessimistic scenario is that this wave becomes a double pattern and enters the price range of wave-b (marked with a red dashed line) of the higher degree diametric. The probability of this scenario occurring is low and I consider the first scenario more likely, but we must be prepared for all market movements.
Good luck
NEoWave Chart
Short-term BITCOIN analysisShor-term
In my opinion, Bitcoin could make a move towards $113,000-115,000 and then start moving upwards. In any case, according to previous analysis and apart from short-term fluctuations, it could touch the target of $140,000-150,000.
Good luck
NEoWave Chart
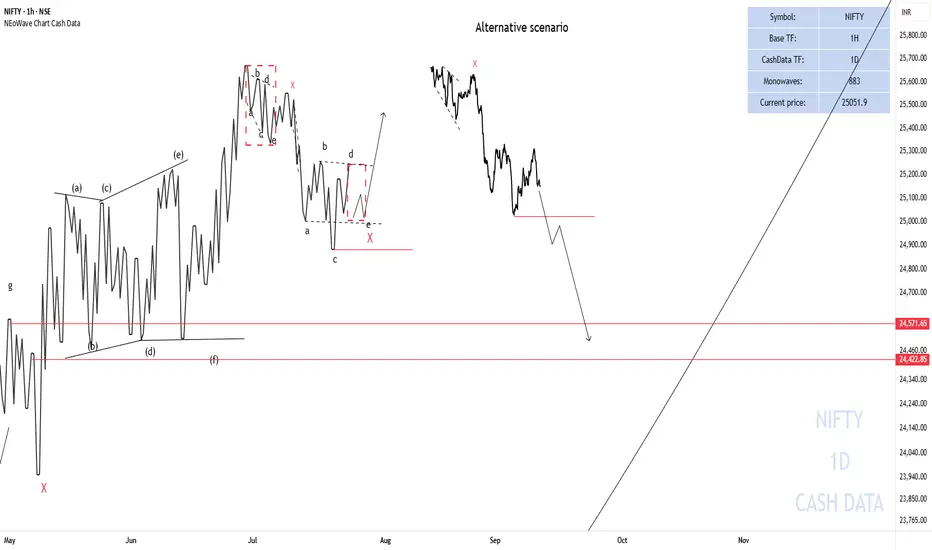
NIFTY50 Analysis ScenariosNIFTY briefly went below 25000 points but could not consolidate so a possible scenario is that X- wave is forming, triangle - X - triangle and then the upward movement starts.
Alternative scenario
If the end of wave-c of the reverse triangle breaks (red horizontal line), NIFTY could decline to the specified range.
Good luck
NEoWave Chart
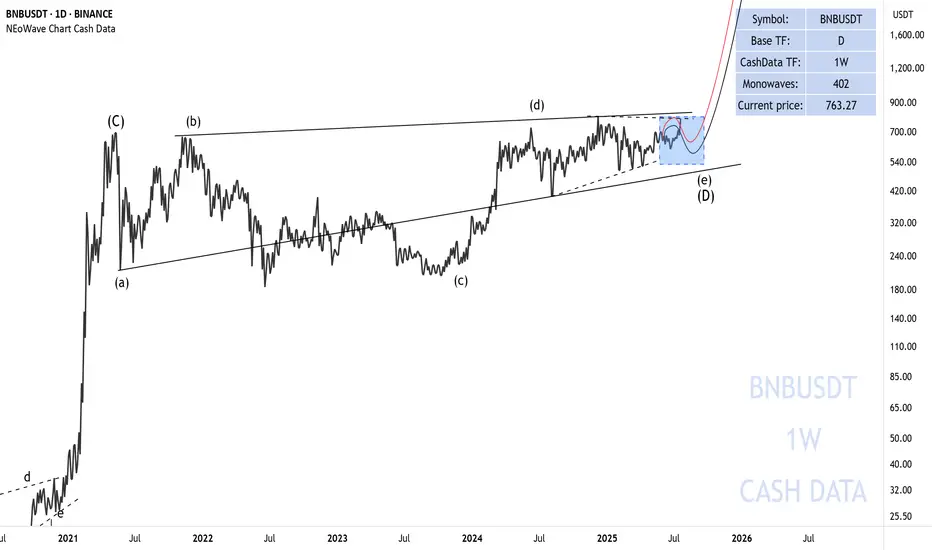
BNB is getting ready to riseThe first bullish move I was expecting for BNB has taken place and it looks like we should be waiting for the formation of wave-e of (e).
After the completion of wave-(e), we expect a big rise for BNB.
Good luck
NEoWave Chart
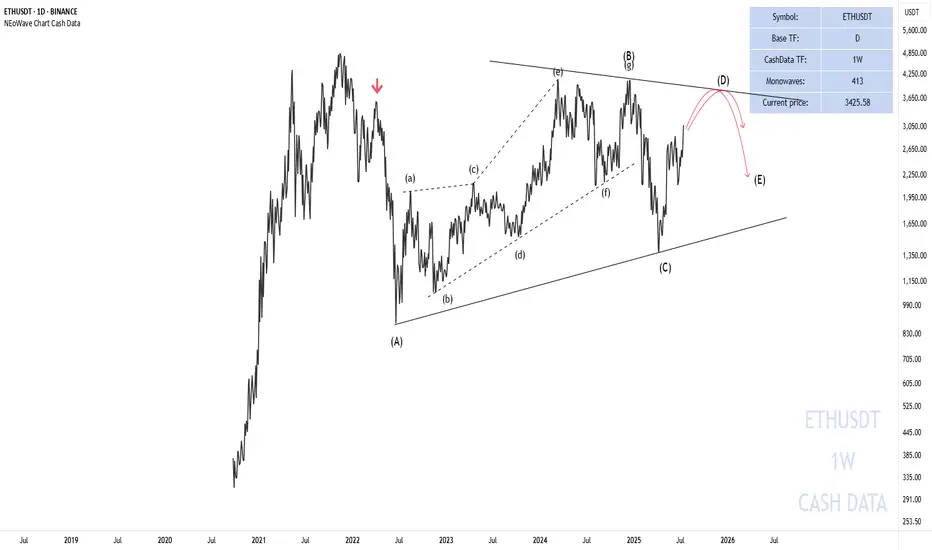
NEoWave Analysis of Ethereum 2025 Cash data chart shows that Ethereum is in a corrective phase and the wave structure from (A) to (C) has been completed. Initially, we expected a flat pattern to form; however, the wave structure-(C) was not an impulse and the flat was not confirmed.
As a result, given that the wave structure (A)-(B)-(C) is corrective and the waves differ in time, it seems that a contracting triangle pattern is forming and we are currently in wave-(D) of this triangle. Furthermore, wave-(D) could rise to $3630-3880 and end. Then a price correction in the form of wave-(E) may occur. This correction could end between $2900-3086 and if this range is broken downwards, wave-(E) could decline to $2000-2230, after which the main bullish move for Ethereum is expected to begin.
Good luck
NEoWaveChart
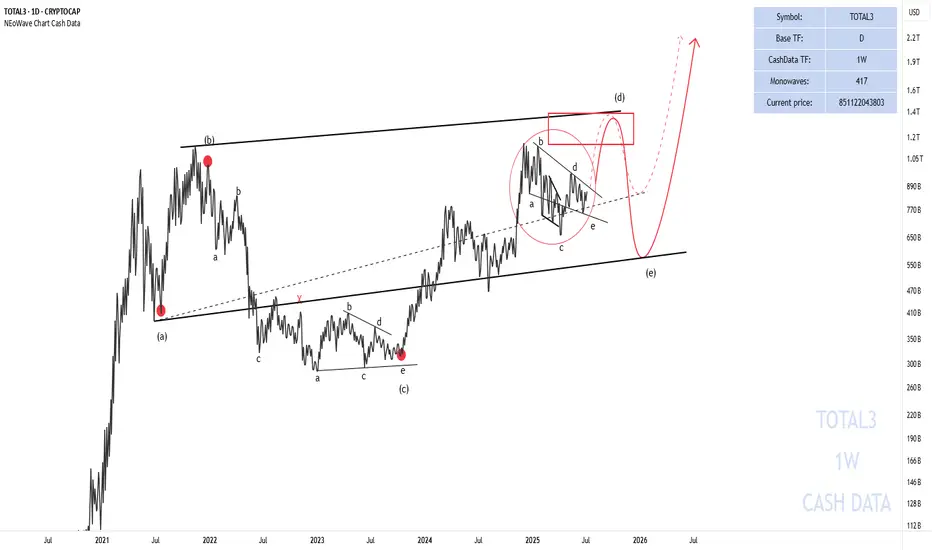
Has the Alt Season Started?Total 3 seems to be forming a neutral triangle (marked with a red circle) and will soon move towards the red box to complete wave-(d) of the higher degree triangle.
The price path is marked for you on the chart.
Good luck
NEoWave Chart
Gold is getting ready to rise.Gold has been resting too long and the neutral triangle is no longer valid in terms of time and a contracting triangle seems to be forming.
In any case, there is at least one more bullish wave left for gold.
Good luck
NEoWave Chart

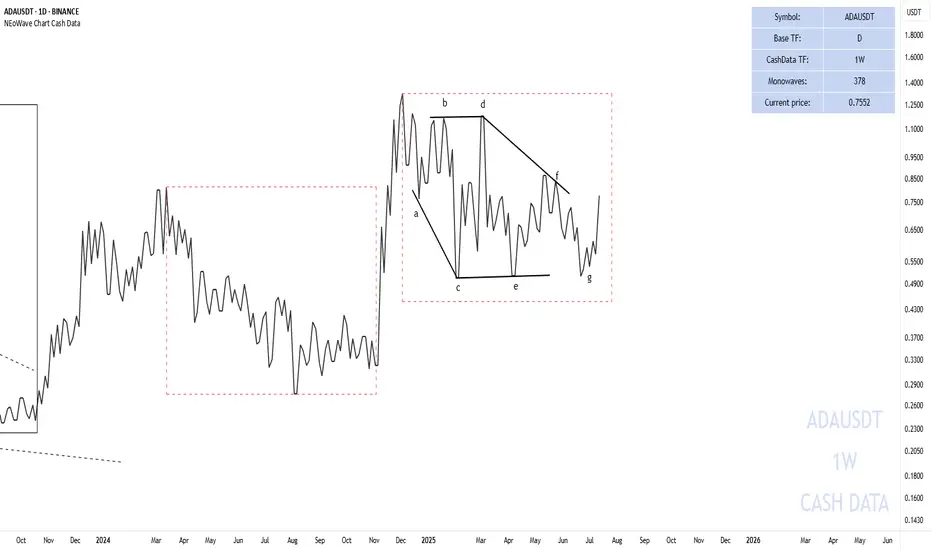
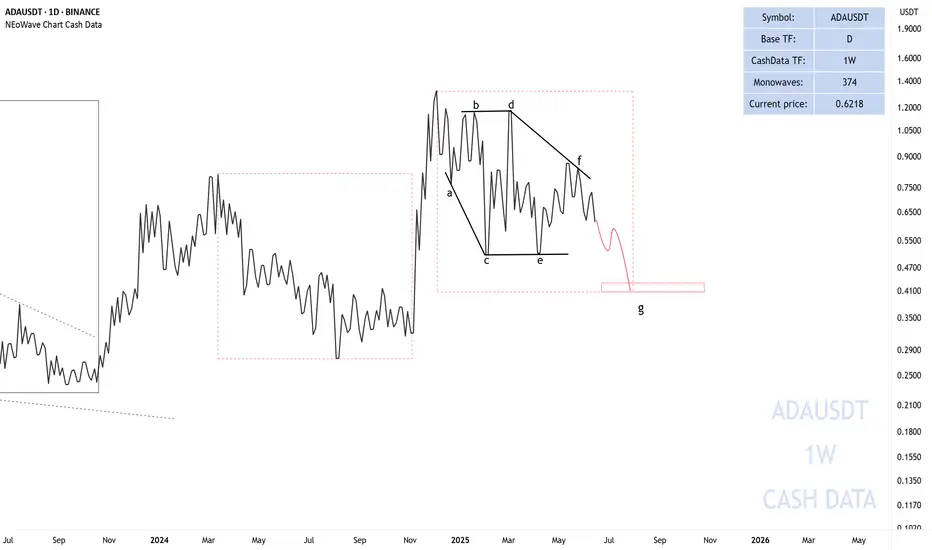
CARDANO WILL BE $2!Our first downside target was touched, but then it failed to reach the second target and the g-wave ended at 0.54.
Based on past price movement, we can expect the price to reach $1.5-$2.
Good luck
NEoWave Chart
BITCOIN =140-150kThe X-wave has formed in the form of a neutral triangle pattern, and eventually Bitcoin could once again touch $106,000 and move towards $140,000-150,000 with the completion of wave-e.
Good luck
NEoWave Chart
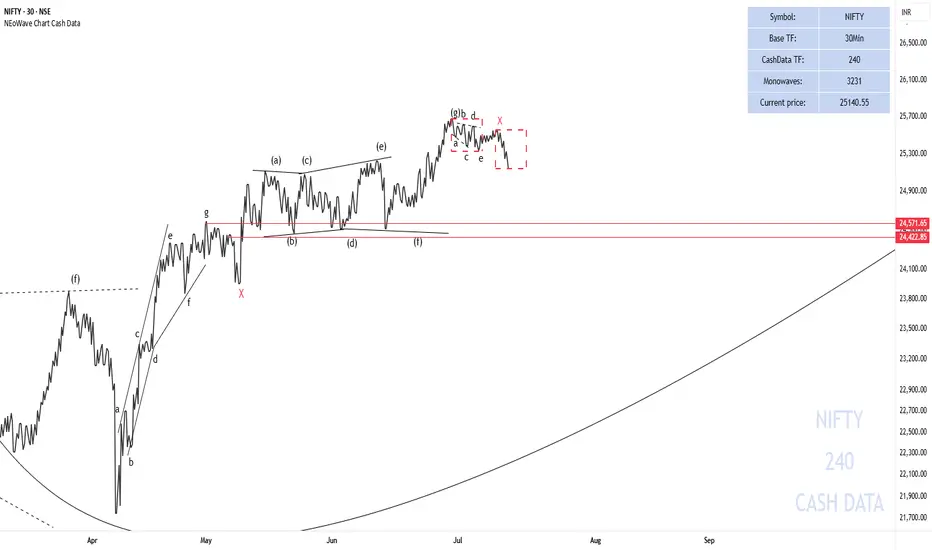
Will NIFTY make a price correction?
My first scenario is still valid and I think it is more likely to happen. It seems that Wave-g has ended from the second pattern and I think NIFTY50 will decline at least to the price range of the X-wave and there we need to check the waves again to see what pattern is forming. To confirm this scenario, a break below the key level of 25000 is very important.
I have also proposed a second scenario that this correction may be an X-wave and after that the price can eventually grow to 25680-26133 and spend time there to complete the third pattern. This scenario is also valid as long as the price remains above the level of 25000.
The price correction that is forming can be a double combination pattern like triangle - X - diametric or triangle - X - triangle.
Good luck
NEoWave Chart
Good luck
NEoWave Chart
Cardano and Diametric Pattern
We are currently in wave-g of the Diamond Diametric and it could continue to 0.43.
After the completion of the Diametric, if the Double Combination pattern does not form, we expect an uptrend to form. (The post-pattern movement will show us whether the Diametric has completed or not).
Good luck
NEoWave Chart
BANKNIFTY is moving towards 59000The monthly Cash Data chart is forming a diametric pattern. Waves (a) through (f) have completed and we are currently in the middle of wave (g) of the diametric pattern.
This wave is moving towards 59,000

Silver correction is nearing its endSilver is completing a bow-tie diametric pattern, currently in wave-f. After the diametric completes, there is a potential for an upward trend to form.
Good luck
NEoWave Chart

Will Natural Gas Prices Increase?Weekly Cash Data shows a sharp downtrend that stopped at 2.05 and then formed a sideways trend. Given the size of wave-(c) and the time of the waves, it seems that a reverse contracting triangle pattern is forming.
Currently, wave-(d) has ended and wave-(e) has begun. Under normal circumstances, we expect this wave to decrease to the point indicated by the red arrow, and in terms of time, this wave can continue until the time range of August 12-September 12 unless a political or geopolitical event occurs that causes wave-(e) to be shortened.
So, to trade, you must have a strategy along with analysis.
Good luck
NEoWave Chart

Diametric pattern was completedThe diametric pattern was completed and the post-pattern movement also confirmed the diametric✅
A new wave is forming.
Good luck
NEoWave Chart
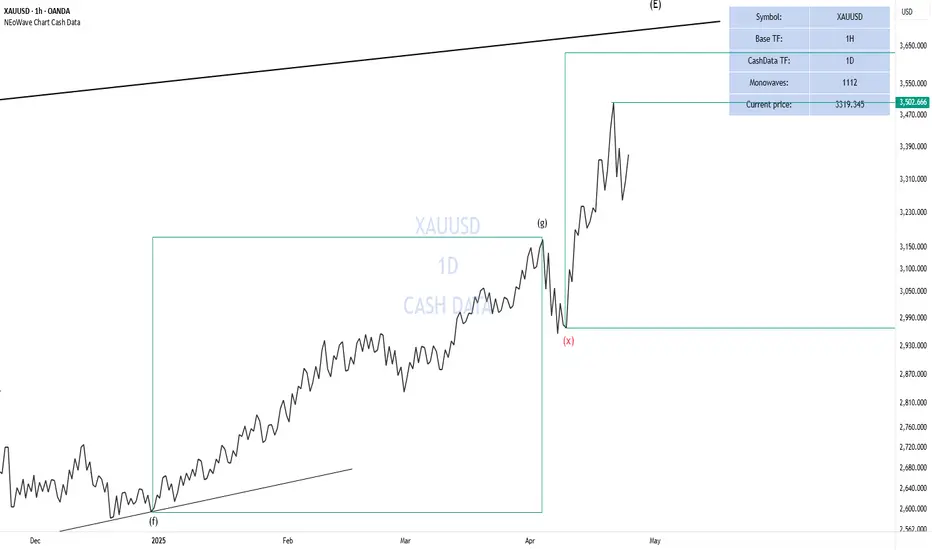
Start of Wave-(b) and Neutral Triangle As I said in the second paragraph of the previous analysis, wave-(a) ended at 3500 and the gold price fell by 7% (over 2000 pips) and now wave-(b) has started.
1M Cash Data Chart
I think that a neutral triangle or a reverse contracting triangle is forming, with the completion of wave(b) we can somewhat understand which pattern is forming.
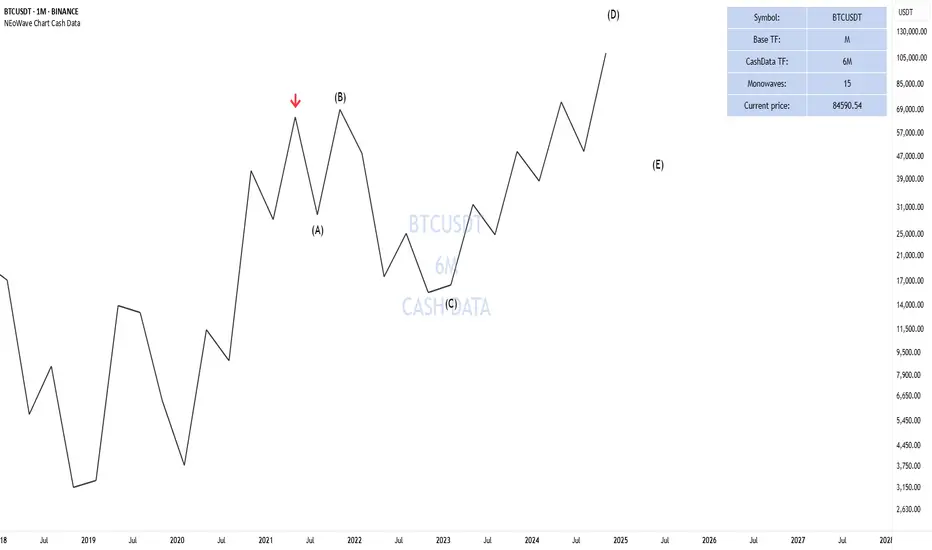
Bitcoin NEoWave Analysis Based on 6M Cash DataCash Data 6M
In the 6-month cash data for Bitcoin, it appears that a Running Neutral Triangle is forming and we are currently in wave-D of this triangle. Based on the previous mid-term Bitcoin analysis, as long as Bitcoin’s price remains above $70,000 there is potential for the price to rise to $150,000. Therefore, wave-D of the neutral triangle could expand and grow larger.
Until wave-D is complete, we cannot accurately predict the endpoint of wave-E( The label-E shown in the image is not precise and will likely change) However, after wave-D concludes, the price will experience at least a 50% correction to complete wave-E of the triangle, followed by a strong upward move in Bitcoin.
The analysis will be updated once wave-D is complete.
Good luck
NEoWave Chart
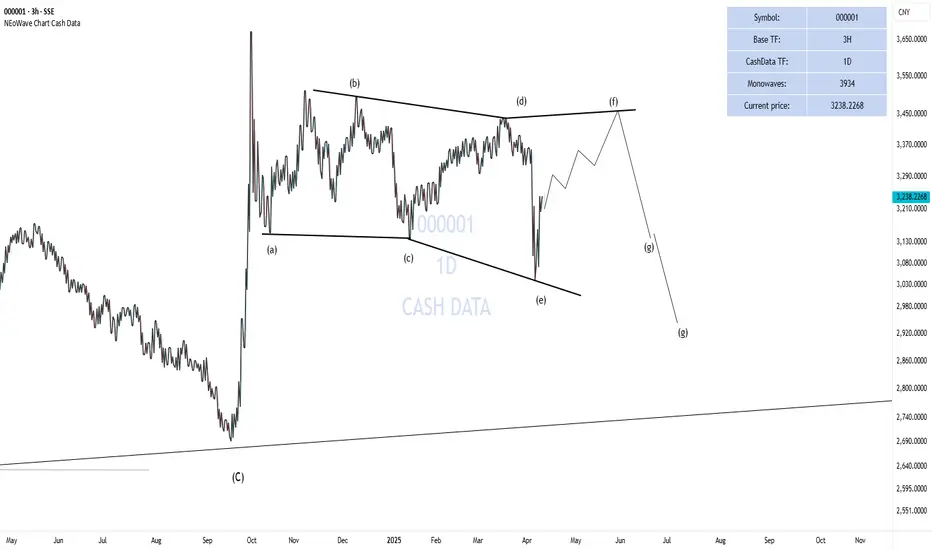
SSE Composite Index CorrectionThe SSE Composite Index, the primary index of the Shanghai Stock Exchange, reflects the performance of diverse companies across various industries and serves as a gauge of China’s economy. It is calculated based on the market value and stock prices of these companies.
According to daily Cash Data (1D), the SSE Index, after a 36% rise from September 18 to 30, 2024, entered a corrective phase that has lasted about 4 months.
Based on the time and price similarity of the waves, it appears the correction is forming a diametric pattern. Wave (e) is likely complete, and wave (f) has begun. Wave (g) may end at 3,138 or 2,945, though the completion of wave (f) will allow a more precise prediction of wave (g) endpoint.
This diametric pattern will likely take another 2 to 3 months to complete..