CAT $CAT Continuation LongCAT $CAT Continuation Long. TP and SL on chart. Move SL on TP. After TP2, trail with 0.5ATR step and 1.5ATR offset.
CAT

Let's pounce on some shorts with $CAT🔸️Ticker Symbol: $CAT timeframe: 4 Hour 🔸️3X Bear Pattern 🔸️Investment Strategy: Short
TECHNICAL ANALYSIS: $CAT making a double top , with price near a few key levels. From the Top, we are sitting right at the 50% retracement , our money momentum is peaked at the red band; which means we are due for a pullback. $CAT is poised to drop over the next few weeks, with a bottom target as low as 181! Lets make some money together and pounce on some shorts with $CAT.
🔔 Follow for daily stock, crypto and forex technical analysis .
⚠️ Trading is risky, and I understand nothing is guaranteed. Proper risk management should be in place at all times to minimize losses. Please consult a financial advisor before trading. All Inclusive Trading LLC is not a financial advisor and may not be held liable for any losses which may occur.

Caterpillar is dropping. CATGoals 200, 179. Invalidation at 262 .
We are not in the business of getting every prediction right, no one ever does and that is not the aim of the game. The Fibonacci targets are highlighted in purple with invalidation in red. Fibonacci goals, it is prudent to suggest, are nothing more than mere fractally evident and therefore statistically likely levels that the market will go to. Having said that, the market will always do what it wants and always has a mind of its own. Therefore, none of this is financial advice, so do your own research and rely only on your own analysis. Trading is a true one man sport. Good luck out there and stay safe

Caterpillar - Great Stock for 2022 - Bull RunHey all,
CAT Caterpillar, Inc, why does it look like a good stock to buy right now?
NYSE:CAT
Earnings - Highest ever reported revenue / Second highest ever margin percentage and value
Price - Currently 185.81 / 12 month low = 167.08 / 12 month high = 237.90 / Great prospect to rise to near the 12 month high due to record breaking earnings and margin.
Dividend - 2.44% paid annually
A great prospect for holding for 6 months / Warning: keep an eye on the economy regarding the recession and possible job losses, this could drive the stock down rapidly.
Let me know your thoughts.
Many Thanks
Matt
NYSE:CAT

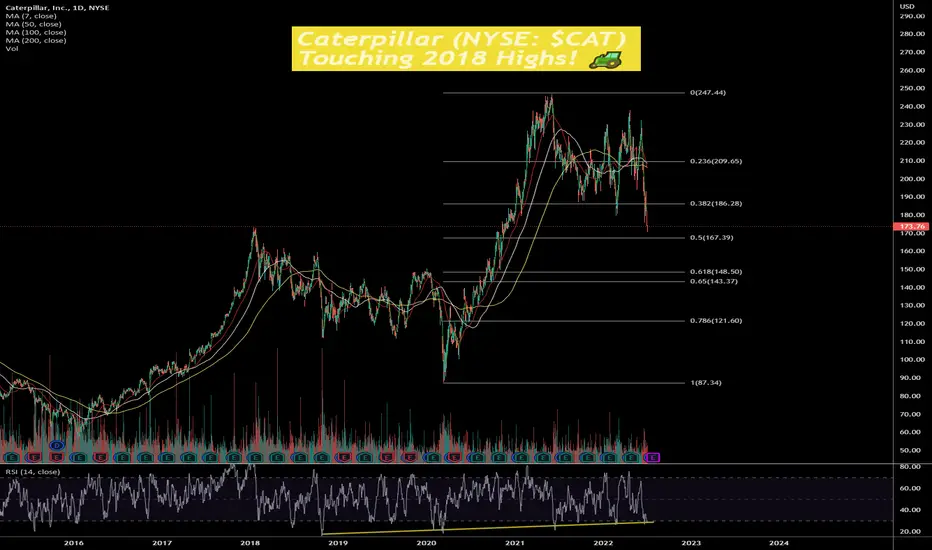
Caterpillar (NYSE: $CAT) Touching 2018 Highs! 🚜Caterpillar Inc. manufactures and sells construction and mining equipment, diesel and natural gas engines, and industrial gas turbines worldwide. Its Construction Industries segment offers asphalt pavers, backhoe loaders, compactors, cold planers, compact track and multi-terrain loaders, excavators, motorgraders, pipelayers, road reclaimers, site prep tractors, skid steer loaders, telehandlers, and utility vehicles; mini, small, medium, and large excavators; compact, small, and medium wheel loaders; track-type tractors and loaders; and wheel excavators. The Resource Industries segment provides electric rope shovels, draglines, hydraulic shovels, rotary drills, hard rock vehicles, track-type tractors, mining trucks, longwall miners, wheel loaders, off-highway trucks, articulated trucks, wheel tractor scrapers, wheel dozers, fleet management, landfill compactors, soil compactors, machinery components, autonomous ready vehicles and solutions, select work tools, and safety services and mining performance solutions. The Energy & Transportation segment offers reciprocating engines, generator sets, integrated systems and solutions, turbines and turbine-related services, remanufactured reciprocating engines and components, centrifugal gas compressors, diesel-electric locomotives and components, and other rail-related products and services for marine, oil and gas, industrial, and electric power generation sectors. The company's Financial Products segment provides operating and finance leases, installment sale contracts, working capital loans, and wholesale financing plans; and insurance and risk management products for vehicles, power generation facilities, and marine vessels. The All Other operating segment manufactures filters and fluids, undercarriage, ground engaging tools, etc. The company was formerly known as Caterpillar Tractor Co. and changed its name to Caterpillar Inc. in 1986. The company was founded in 1925 and is headquartered in Deerfield, Illinois.
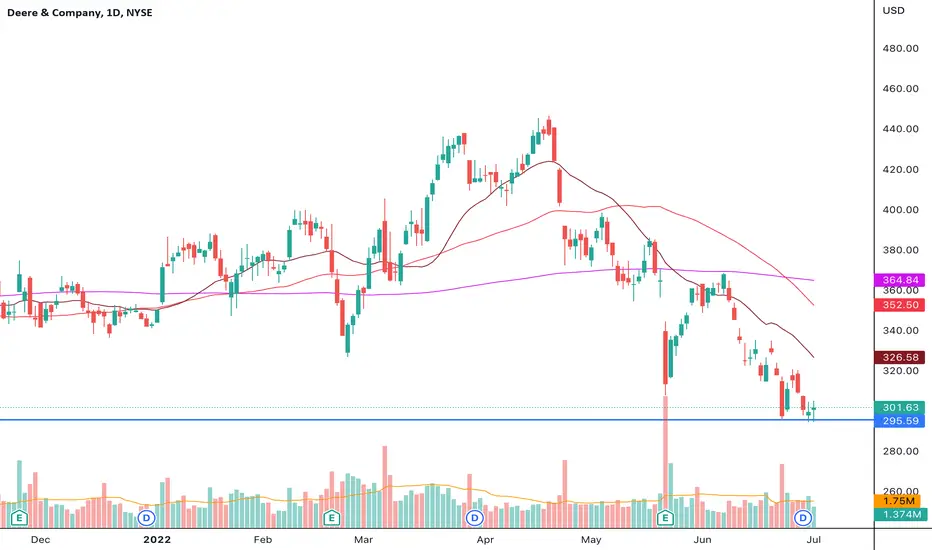
DE short farm machinery manufacturers like CAT and DE been really weak last few days with big volume on gap downs. DE has been closely tracking XME since last year or so which doesn't look too good either.
Also, if we overlap IWM chart with DE, it looks pretty close to IWM chart before the break down.
if it breaks 295 again or if it can get to 305-306.
DE 9/16 280P
PT's : 280.70
SL : 301 and 311 respectively
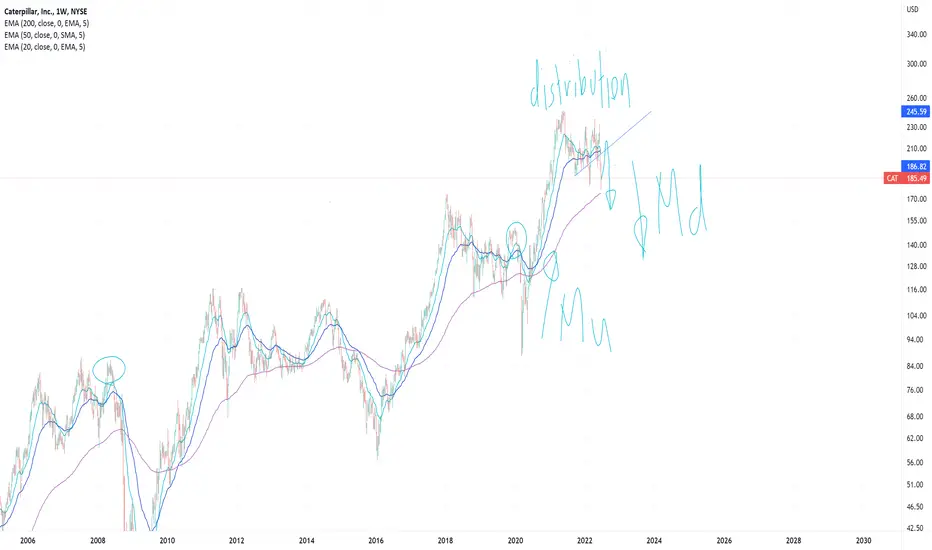
DEAT CAT BOUNCEHey guys,
I went back in the chart and circled what I considered to be similar situations to where we're at right now. I think over the next month, there is an extremely high chance CAT has a fakeout rally that could very well reach $225/share. That being said, I don't expect it to breach ATH's, and I expect the rally to be an incredible shorting opportunity before a potentially violent markdown phase. The agriculture sector is still relatively high up, and when you look into it, it is fresh off of distribution and primed for a markdown(made obvious in names like DE, CF, and MOO). I am currently waiting on CAT to rally, hopefully up to $220-230/share before selling my position and flipping entirely short on the stock. I expect this stock to see the low $100's well before year-end.
Disclaimer: I was previously short CAT, and am currently long CAT at $180/share in anticipation of a dead CAT bounce(ha)
CAT - Bullish Above Major Trend Line Similar chart formations can be seen along this uptrend that has formed on CAT
The similarities become closer when you look at the white rectangles highlighted
This is the period before growth begins
The green circle furthers this, pinpointing where we are in a comparable price movement

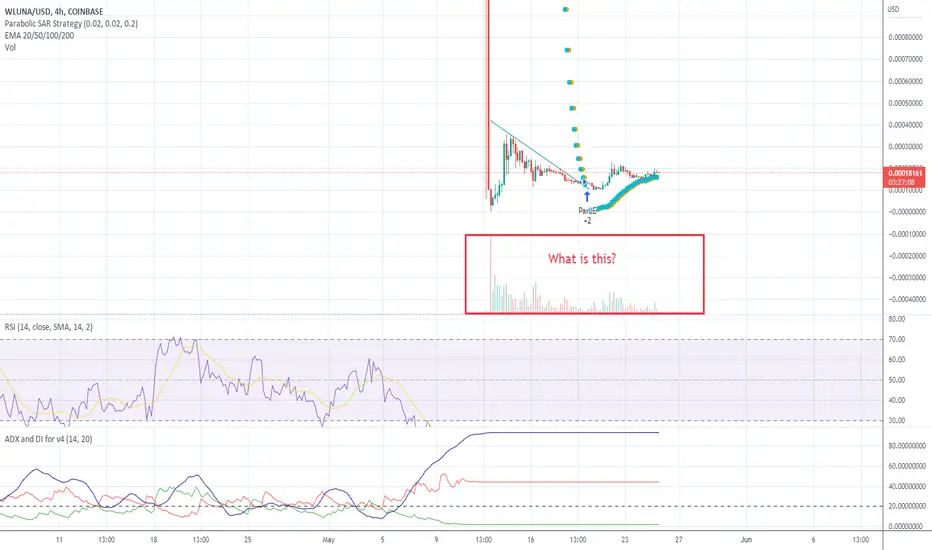
What's with the Volume on this coin?
Looking at WLUNAUSD, the one thing that I'm seeing is that the Volume of trading on this coin seems to be exponentially greater than what it was when it was at even it's greatest value, or at any time before it crashed.
Is this basically vulture trading, looking to take advantage of the resulting volatility at the bottom here? Or is this some sort of accumulation? The volume spike happened maybe a day after this coin hit its theoretical bottom.
XAUUSD (GOLD) price actionGold showed a dead cat bounce after hitting a fresh three-month low at $1810.
Technical:
The near–term support is around $1800, a breach below targets $1750.


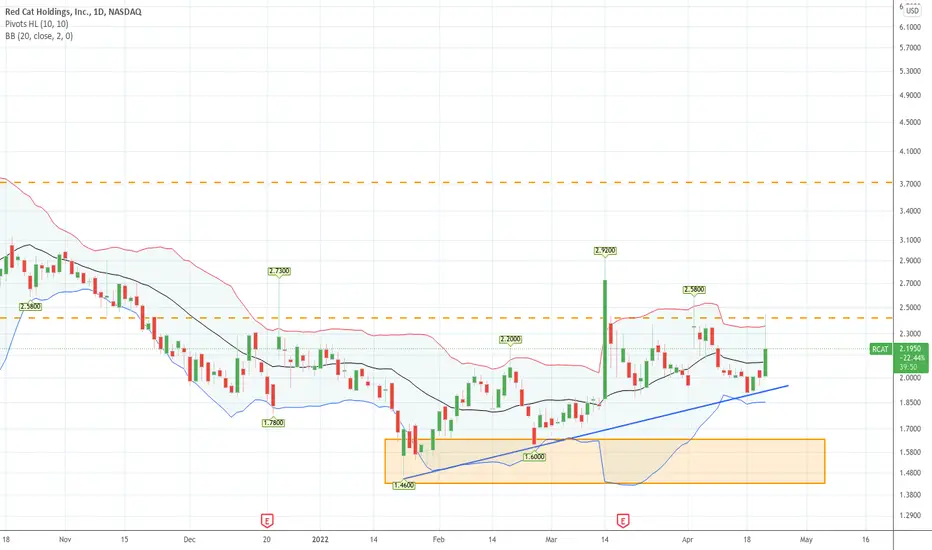
RED CAT : my current favorite stock ready to buy big steaki m very long on drone maker RED CAT , TEAL drone are used by DOD and currently use in Ukrain, stock quotes near key support ready to spike join us on red cat adventure
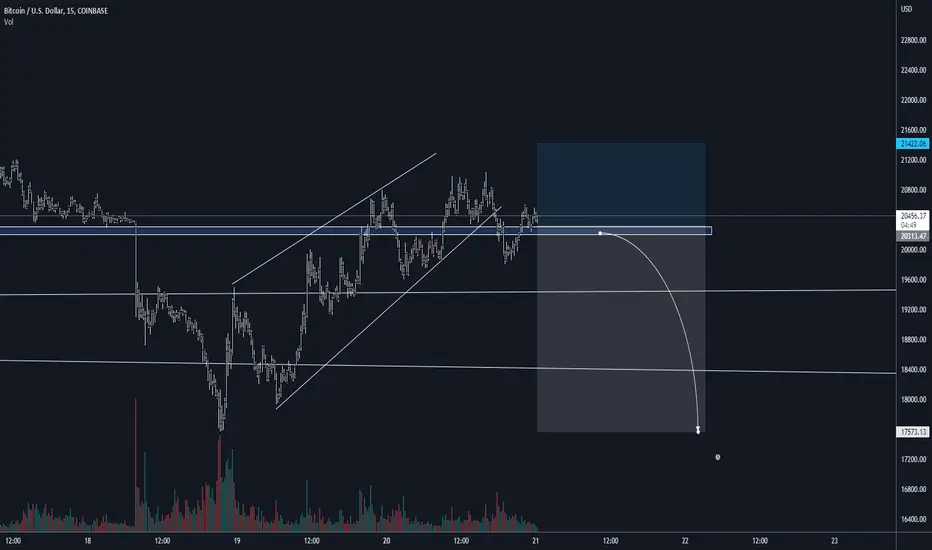
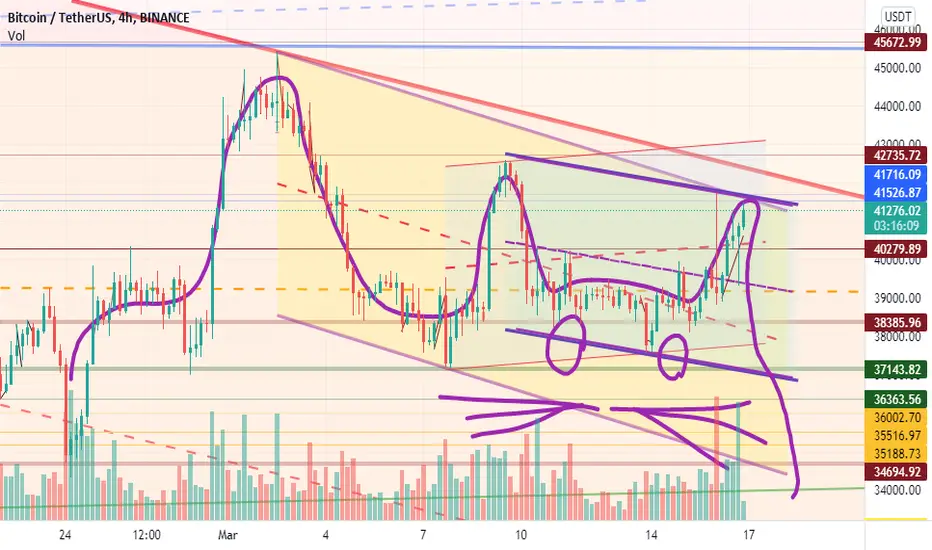
BTC SIDEWAY IN THE LONG WEEKEND
Hello Everyone!!!
I just checked a very interesting scenario in the Hourly Time Frame. Seems like we moving in an Ascending Channel/Bearish Flag Pattern, and I think we're going to have a big move soon, perhaps in the New York Session even though it's long weekend.
Please leave me your thought about my opinion, and if you guys like to, maybe I will create YouTube channel for English language.
**BTC Idea**
This is not change my Daily perspective on BTC, recently I posted about BTC Moon Cycle, and so far almost in every Full Moon Phase, we had a nice rally.
But, still we can't ignore the lower time frame, and as a Trader, there's so many opportunity to look out on the lower timeframe.
In the 1-Hour Timeframe, right now I see a potential SHORT Opportunity, only if BTC can Breakdown very impulsive against the Trendline here.
A couple things that make me think that, this is a good opportunity to SHORT is a potential scenario for Dead Cat Bounce Pattern and also Head & Shoulders Pattern.
Although H&S is more preferable in the Uptrend, because of the characteristic of H&S that changing the Direction of the market.
Still, I'm considering the same situation right here, and looking the recent Resistance as potential Lower High for BTC price movement.
This is not a financial advice, it's just my humble opinion and I could be wrong somehow.
I also have the alternative Scenario in case you guys want to see.
Good luck for you guys!!
And I'll be waiting for your reply on your thoughts.
God Bless and Cheers!!!
tradingview.sweetlogin.com
CAT ,a gauge of economy, may retrace to 200 for a RS; TP=288CAT may be finishing the head of a head & shoulder pattern up to the 237 Resistance zone( also upper side of the green Megaphone). Then it may go down to 200 to make the RS this coming May. Measured target of this H&S will be 288 which is also 1.618 Fibo of the whole wave IV.
179.67 may already be the low of wave IV Megaphone pattern. The final wave V might be in 2023 where a BIG ABC correction may come to reset the market. (Recent yield curve inversion signals a recession within 1 or 2 years)
Not trading advice

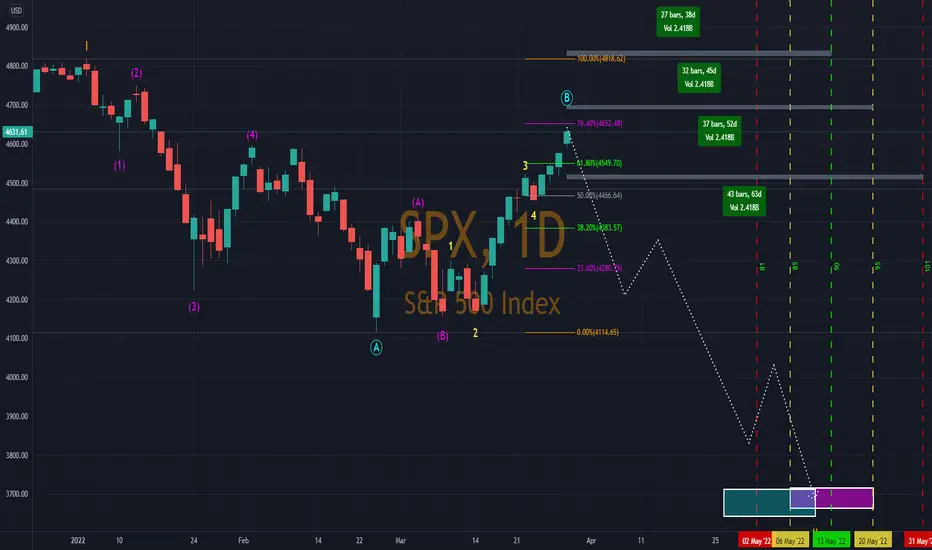
SP500 either topped, will top, or flying high for yearsMy patience is being tested right now. I am running out of possible days of length and price targets. I have the market in Sub-Millennial wave 1 (began June 1877), Grand SuperCycle wave 5 (began March 6, 2009), SuperCycle wave 3 (began March 23, 2020), Cycle wave 2 (began January 4, 2022), Primary wave B (began February 24, 2022), Intermediate wave C (began March 8, 2022). The shorthand for this wave is 1532BC which is based on wave letters and numbers combined. Right now, Intermediate wave C (if we are still in it, we cannot be for much longer) is:
1) 1) 15 days long
2) 2) Gain of 479.43
3) 3) 300% the length of wave A
4) 4) 172.99% the move of wave A
5) 5) Accounts for 65.22% of the larger wave’s (Primary B) length
6) 6) Makes up 91.73% of the larger wave’s (Primary B) move
This also makes the stats on Primary wave B look like:
7) 7) 23 days long
8) 8) Gain of 522.65
9) 9) 65.71% retracement of Primary wave A’s length (35 bars)
10) 10) 74.24% retracement of Primary wave A’s movement (dropped 703.97 points)
1-My models only forecast 15, 17 and 27 days in length for wave C. Most of the model agreement was below 10 days.
2-The move is not necessarily a factor by itself but the additional data will use this. The price forecasts below the current high is 4633.725. The next set of price points tops below 4700 are: 4637.45, 4652.15, 4653.96, 4657.99, 4664.74, 4665.448, 4673.78, 4674.76, 4675.68, 4676.19, 4681.05, 4689.68, 4697.24. These prices begin to have more gaps than the prices below this point. There is a 4 point grouping in the 4670s.
3-Intermediate C waves rarely exceed the 300% length of wave A which is where the index is based on today’s high. Intermediate C has moved 276.92% (wave ended C2C, we are 2BC), 281.25% (2BC), 466.67% (C2C), 517.39 (54C).
4-Intermediate C waves ending in BC have a median move which is 127.13% of Intermediate wave A and an average of 123.72%. Intermediate C waves ending in 2BC have a median move of 152.47% and an average of 142.60%. The maximum is 242.75% of intermediate wave A’s movement. We are above the normal in the current case.
5-In the three wave structure of Primary wave B, Intermediate C waves ending in BC have a median contribution of 31.25% for Primary wave B’s length and an average of 33.46%. Waves ending in 2BC have a median contribution of 49.45% and average of 44.22%. The highest contribution so far is 64.29% for 2BC and BC waves.
6-Likewise regarding the contribution to the overall wave, BC waves make up 68.74% as a median and 70.32% on average. There are four occasions above 90.49%. Waves ending in 2BC have a median make up of 90.49% and with a maximum at 95.12%. The current contribution is still acceptable, and quite common for 2BC waves.
7-The forecast days from my models at and above the current length are 26, 28, 32, 40, 51, 52, 59, 63, and 70 days in length. Strong agreement at 26 and 28 days.
8-The price forecasts for the end of Primary wave B have a few tight price target pockets which are: 4637.365, 4637.588, 4645.7, 4645.874, 4654.17, 4654.2, 4654.525, 4658.71, 4658.962, 4659.03, 4659.04, 4659.691, 4675.203, 4677.57, 4677.81, 4687.6, 4687.61, 4688.36, 4688.39.
9-Typical Primary waves ending in 2B match 25% to 400% the length of Primary wave A. Waves ending in 32B usually retrace around 55-70% with an outlier at 400%. We are in the smaller window now, but only for a day or two more at most.
10-Typical Primary waves ending in 2B move 41 to 88% of wave A’s movement. Waves ending in 32B move 54-77% which we are also nearing the high end of this window.
To conclude, 1) the market has either topped today and we finally began Primary wave C downward with the final 15 minutes of trading today; 2) the market can rise for 2 more days at most before a reversal; or 3) We are not in Primary waves B or C and instead we ended all of the downward movement on February 24. If the latter is the case we are in the early stages of Cycle 3 which will see massive upward momentum for possibly 2-3 years. If option 1 remains valid, the chart below shows early signs of where movement will take us. Regardless of option 1 or 2, we will find a bottom and then begin Cycle 3 with the same aforementioned results. I am bullish long-term, but remain bearish in the short-term until we either break above 4818 or move below 3900.
Taking profits and aiming for shorts I’m currently selling small parts because I think we can go way lower. When the upper arrow may come and the price action is right I might also look to take a short. We’ll see.
Reasons:
-trendline didn’t had a retest
- market structure broke bullish so a channel is can very good be formed
-simple fib retracement
-broken resistance didn’t had retests
no financial advice, I don’t even know if I have to say that haha ;)

$CAT LONG IDEA$CAT KITTY KITTY KONSTRUCTION looks great as it is approaching the top of its channel with some nice green volume. I'd look for a play to ATH following a 4hr smash through $225 level. HIGH WATCH SEND IT!!!

SPX and NQ - looking bearishTime to be careful as there are more technical signs that all is not well:
1. dead cross firmly on the Nasdaq since 28 Feb (impending for SPX)
2. Toppish head and shoulders pattern seen on both
3. no signs of sustainable upward momentum yet (need to see a breakup of the near term downward channel for a start)
Hence, do not be too eager to bottom fish and when we do (yeah, itchy fingers happen), cut losses fast if wrong (unless one is a long term investor who is ok to dollar cost average on stocks with proven long term fundamentals).
The strong sectors right now are in the oil, metals, defence and utilities. The rest could continue to mostly languish or enjoy only short term bounces from oversold conditions.
On the fundamental front, rising oil/commodity prices and high inflation of above 5% is always a precursor to a recession (thou it could still be months away but markets tend to be forward looking).
Perhaps this could turn out to be yet another short term steep correction (like the many in the past decade), be flexible and nimble. It's ok to just let the technicals tell us what to do even if we are noob on macro economics.
Stay safe and good luck.
Disclaimer: TA is about improving our odds of a successful trade (not a guarantee). This is just my own analysis and opinion for discussion and is NOT a trade advice. Please your own due diligence and trade according to your own risk tolerance and don't forget that money management is important! Thank you.

would it make a cat's ears pattern?if this falls, it would make the right ear,,,, you could expect a big dump... let's see
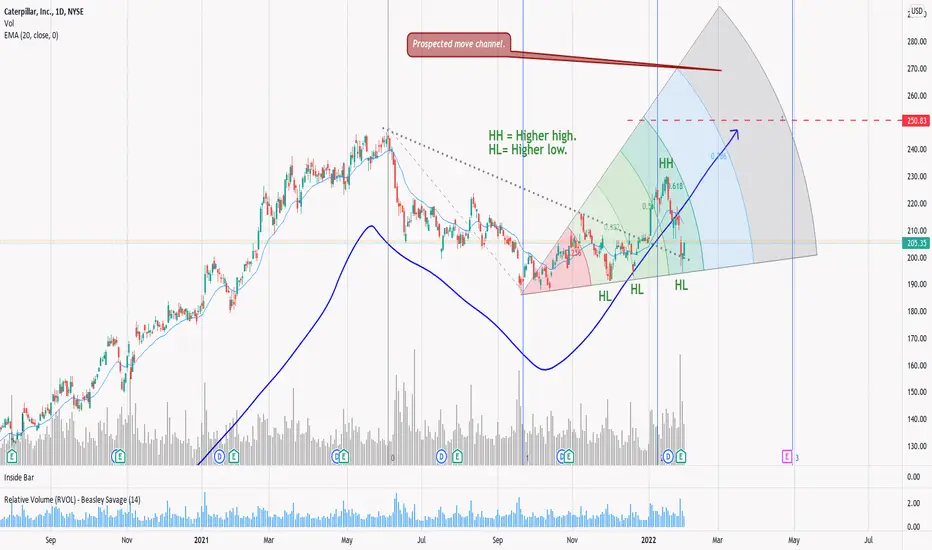
Cat is going for $250 with the market . +25% prospected move.Cat is going for $250 with the market . +25% prospected move.
A clear new trend is forming with multiple HH's and LL's with a monthly strong uptrend, thus we have a high probability of a prospected move ahead.
Target is $250 which is the 52WH .
TSLA: These are the KEY POINTS we must watch for now.Hello traders and investors! The movements on TSLA have been so technical and precise, and it is behaving according to our technique. Let’s update our thoughts. Remember, the link to yesterday's analysis is below this post, as usual.
First, in the 1h chart, TSLA is still bullish, as we expected, as it is still doing higher highs/lows. Is there any bearish structure around that could indicate it will do a sharper pullback or even reverse the trend? No.
In fact, TSLA is trying to break the previous top at $ 922, which is another good sign. To me, TSLA is inside a huge Ascending Triangle made by the black line at $ 943 and the purple line which connects the previous bottoms. This tells us that our next stop is the $ 943 again. What will it do from there? We don’t know, but we don’t have to know in order to trade well. Trading is reactive, not predictive.
All we must know is that TSLA is still bullish, and pullbacks to the 21 ema and to the $ 896 are expected, and wouldn’t be a reason to panic at all.
In the worst case-scenario, I see it retesting its purple line again, but I don’t see a technical reason to work with this scenario right now.
In the daily chart, we see many support levels (the retracements), and this is another reason why it wouldn't be too easy for TSLA to drop from here. However, as we expected, the 21 ema is here to annoy us. Probably this week, we’ll have our answer if this is a Dead Cat Bounce or not.
I’ll keep you guys updated every day on TSLA, so remember to follow me to not miss my daily analyses.

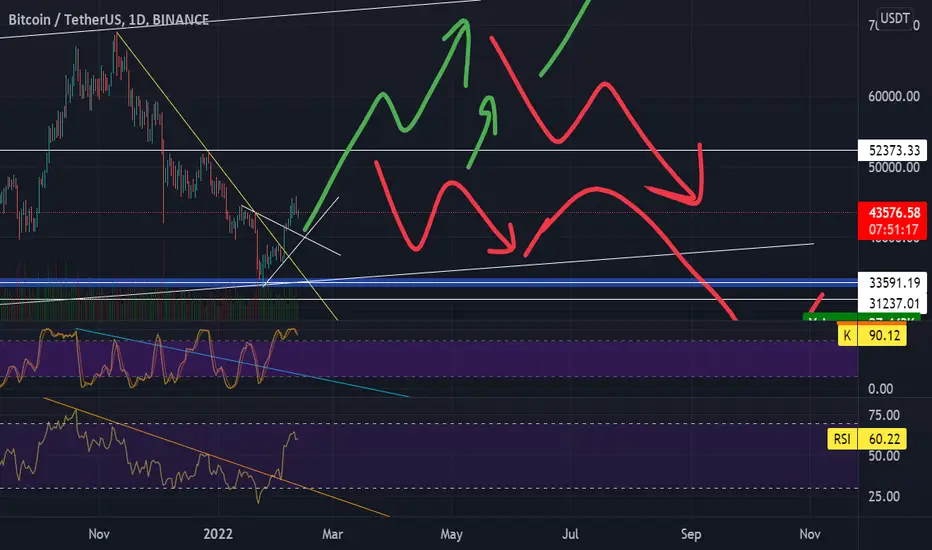
30% chance of ATH soon for BTCIn this theory, there seems to be 3 equally weighted scenarios that may play out in the short term. Regardless, I believe the long term is still a slow trend to the upwards side. However, this could become a more exponential growth if 1 of these scenarios plays out, which has a 30% chance of occurring.
Continuation to ATH: 33%
"Dead-cat bounce" with a head and shoulders forming in the $48K-55k range: 33%
Immediate rejection around $48k-52k, then a drop down to the $30k range: 33%
Yea..."it could go up down or sideways"... I get that, however this is my "more detailed" version of that here.
A healthy movement on the RSI over the next week or two will be the best indicator here for the bullish scenario, and an over correction of the RSI will most likely signify the bearish scenarios.