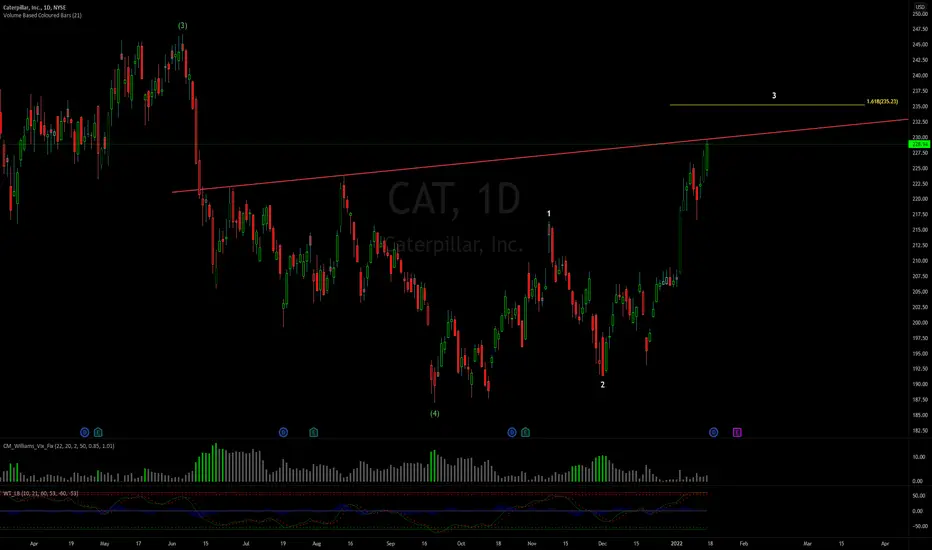
$CAT | WEEKLY WATCHLIST 1/18Room to $235 above to complete wave 3 if we can clear the resistance TL.
CAT
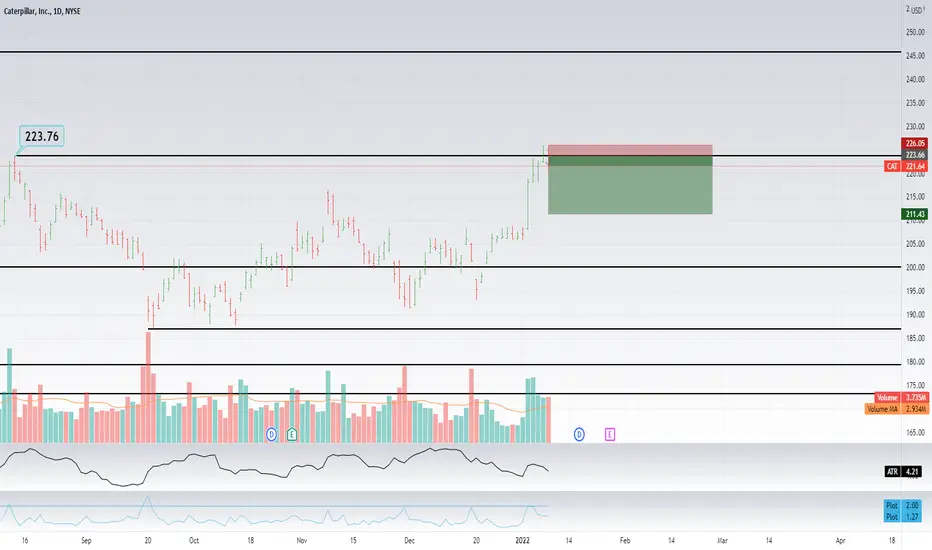
CAT looks like it don't have power to go higher. Hi everyone, Yurii Domaranskyi here. Let's take a look at the chart:
1. Horizontal Price levels are working good
2. globally downtrend, locally uptrend
3. the price level confirmed by a touch
4. that was a near test, but we see week close under the level
5. approached the level sharply
6. the move was with no rollbacks
7. no accumulation
8. no rollback
9. we see that 1 bar closed above the level and 2nd opened above and closed below
10. level of a rollback
11. enough room for a move with r/r 1 to 5.1
12. no model of ascending lows
13. no news in the last 10 days
14. the price came from above, and we see that it can't go higher
15. we have enough room for a move
16. the report on January 27
Potential risk/reward ratio = 1 to 5.1 meaning that potential risk 100$ with the possibility to make 510$
If you find my work valuable, please, press a thumb up! 👍
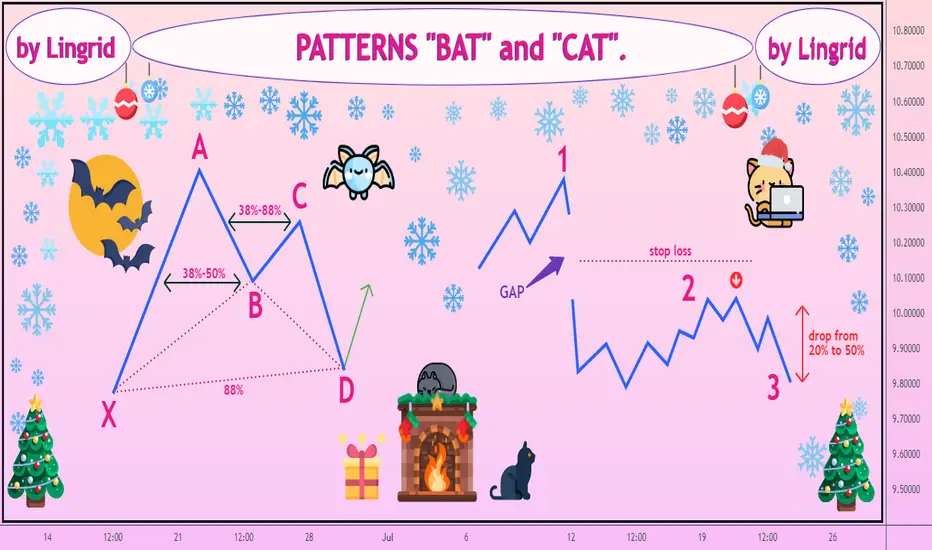
PATTERNS "BAT" and "CAT".Strange as it may seem, but not only bulls and bears can be found on the market, but also a couple of cats and even a bat!
But don't be afraid, these animals have come to help you get rich in the new year.
Let's go!
The Bat pattern.
The bat is a 5-point pattern that can indicate a bullish or bearish breakout.
What does it look like?
The pattern consists of five points:
X is the beginning, from this point the price makes a significant movement;
A - here the price unfolds, forming the first vertex;
B is a pullback, which can be from 38% to 50% of the X – A movement.
C is the price movement, which can range from 38% to 88% of the A – B movement. It is worth noting that C should not go above the point A.
D is the price reversal, after movement C. The shortest movement of all other points. At this point we are looking for an entry into the transaction, you can use the Fibonacci lines. The movement from point D can be 88% of the movement of X-A, and can go above point A.
Risks
The stop loss can be set below the D point, but not below the X point.
The CAT JUMP pattern.
This pattern is characterized by a strong downward movement and, with proper trading, can bring huge profits.
How to find it?
The pattern appears in situations of strong movement, usually caused by bad news.
The following pattern will be observed on the graph:
1. A sharp drop in price, sometimes with a gap;
2. Rollback to the bottom line of the gap;
3. After which there is a long and strong fall.
How to trade?
To begin with, you need to find a strong drop with a gap, as correctly accompanied by a strong volume.
After that, we are waiting for a pullback to the bottom line of the gap and a reversal – this is where you can enter into a deal.
Risks
The stop loss is placed above the lower gap line.
It is worth noting that from time to time the price may go above the lower gap line.
In rare cases, the price reaches the upper level of the gap, and then falls.
It is important to note that the fall lasts from one month or more, which is why this pattern is used by long-term traders.
Important
It is worth recalling that there are alternative patterns: an INVERTED CAT JUMP and a BEARISH BAT PATTERN.
Both models work the same way, only in the opposite direction.
These figures are very profitable, with proper trading.
For example, a fall after a gap and a rollback can be 50% or even 70%, in the CAT JUMP pattern.
Whatever pattern you trade, I wish you good luck and a lot of profit in the new year!
Traders, if you liked this idea or if you have your own opinion about it, write in the comments. I will be glad 👩
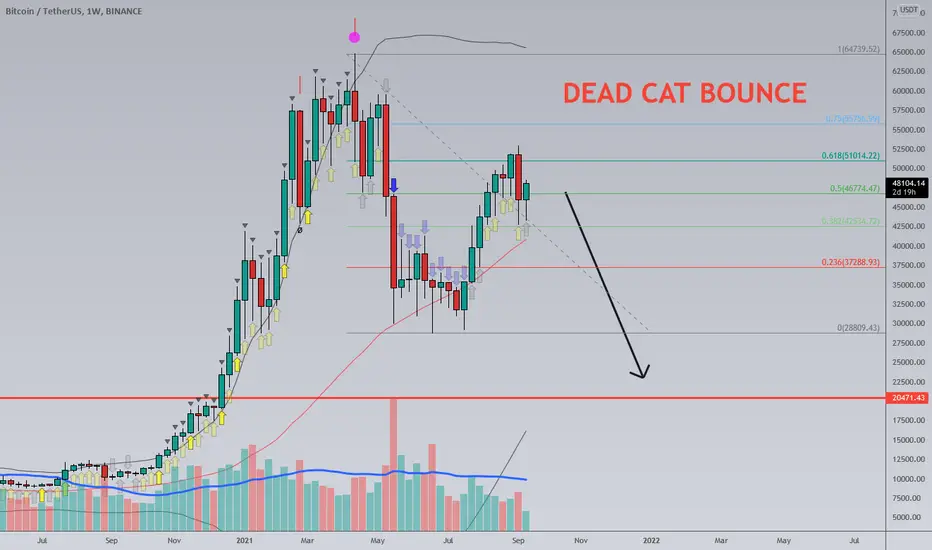
Bitcoin Fibonacci Based on Area - DeadCat Bounce Scenario!Hi guys, Please take a look at my chart. It's pretty basic and let me know how I can improve it. I'm looking to see if Bitcoin can have one last move higher to the mid 50s to complete its "dead-cat bounce scenario." RSI is too oversold and we have majors supports in the 46.5k region. 200 SMA is around the .50 Fibonacci. Thanks.

BTC ETH LTC: Dead Catch Bounce ScenarioHello friends, today you can review the 1H charts for Bitcoin (BTCUSD), Ethereum (ETHUSD) and Litecoin (LTCUSD).
#CryptoPickk notes the following:
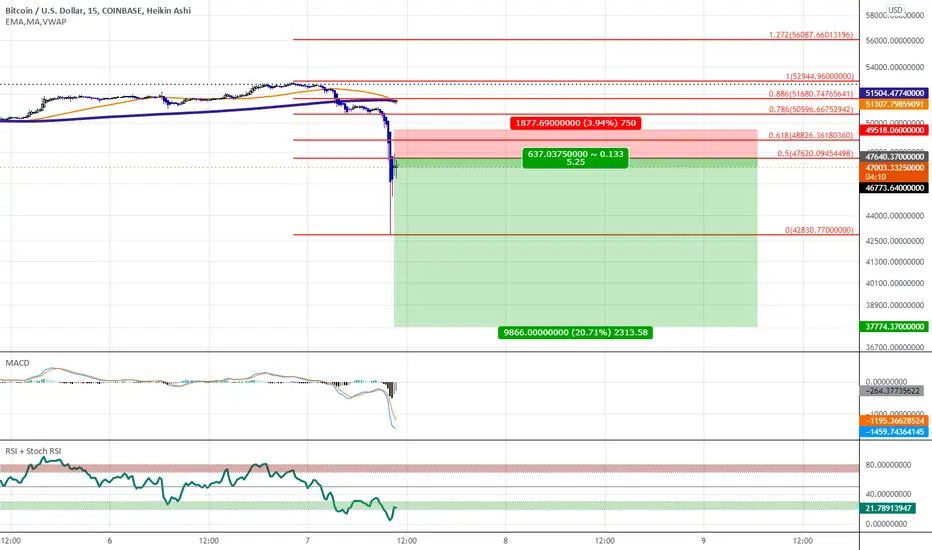
1) As the entire crypto market fell drastically, the potential for a move upwards is very possible. In these scenarios, a Dead Cat Bounce Pattern is very possible.
2) For anyone that doesn't know what a Dead Cat Bounce it, please refer to the Investopedia article for further details: www.investopedia.com .
3) Using the Fibonacci Extension, taking the price from the drop start point to the drop end point, the 0.618 - 0.786 levels may be potentials for where the Dead Cat Bounce may happen and the price drops further from that point.
4) Remember one thing that has helped in trading: When a wick happens, the candle body close is surely to follow. Not financial advice of course. Do your own research.
What are your opinions on this?
If you enjoy my ideas, feel free to like it and drop in a comment. I love reading your comments below.
Disclosure: This is just my opinion and not any type of financial advice. I enjoy charting and discussing technical analysis. Don't trade based on my advice. Do your own research! #cryptopickk

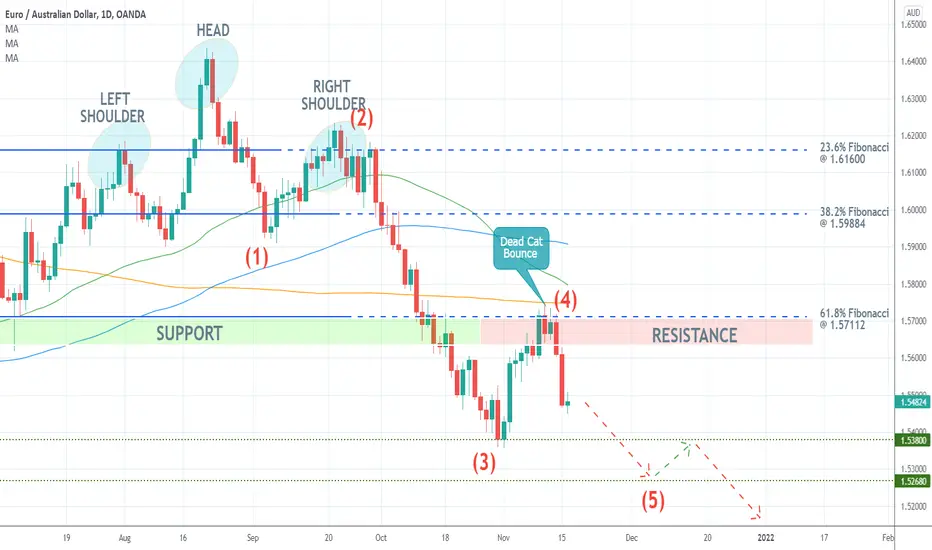
Chance to Join EURAUD's Downtrend The downtrend of the EURAUD, which commenced following a reversal indicated by the Head and Shoulders pattern, looks poised to continue sliding lower. This was indicated by the recent Dead Cat Bounce from the 61.8 per cent Fibonacci retracement level at 1.57112.
The price action is now likely to head towards the previous swing low at 1.52680. This is part of the establishment of a broader 1-5 impulse wave pattern, as postulated by the Elliott Wave Theory.
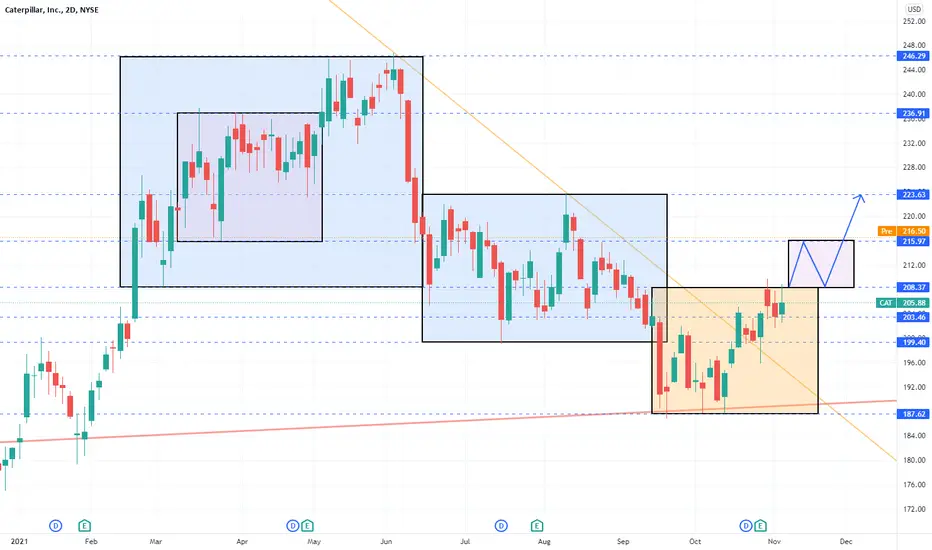
$CAT is moving! Macro analysis + technical with boxes.Hi everyone,
On Saturday US government finally agreed to pass a huge $1 trillion infrastructure bill.
What does that mean?
Utilities, communication, transport and industrial companies will receive subsidiaries for expansion.
So why NYSE:CAT ?
The biggest construction equipment manufacturer in the world. They will benefit indirectly as companies buy/lease their machines/services for infrastructure construction.
Now the chart.
NYSE:CAT is already up almost 5% in premarket after the Saturday news.
It has broken out of the box at 208 and now gapped up deirectly to the next minor resistence level at 216 .
I expect the stock to temporarily trade in a small box before the surge to 223 level.
Long NYSE:CAT :)
Let me know what you think.
What other stocks are going up on this news in your opinion?
Trade wisely and good luck!
-----------------------------------------------------------------------------------------------------------------
Disclaimer!!!
This is not financial advise.
CAT - 220/225 then going shortWith the gap higher this morning I had to re-evaluate CAT. It is trading within this megaphone pattern and on the smaller timeframes it should be looking to complete a minor 5 wave sequence into 220/225. From here I will be looking to get short as I believe it has another wave lower towards 180 range.

CAT breakout, $223 incoming CAT, breaking out of a flag, MACD is looking to crossover on the weekly chart. Long Term Price Target = $223.19

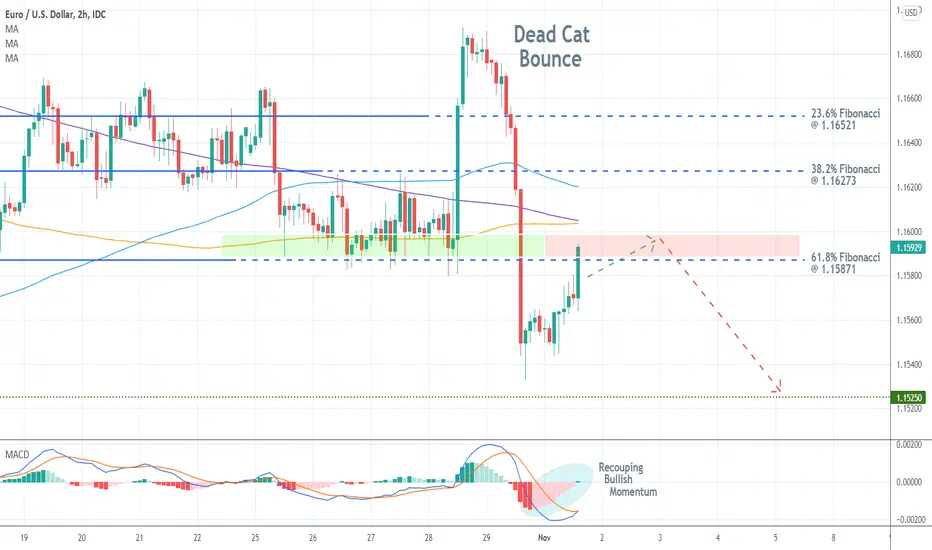
EURUSD Completed a Dead Cat Bounce Following the completion of a Dead Cat Bounce, which is a type of pattern that indicates strong bearish pressure, the price action of the EURUSD is currently pulling back to the 61.8 per cent Fibonacci retracement level at 1.15871 from bellow.
Once the pullback is completed, the broader downtrend would likely be extended lower towards the previous swing low (at 1.15250).
#ANKR 4HR Chart - DCB Possible?Ankr just had a nice run up but it looks like a Dead Cat Bounce (DCB) may be at play comparing it to the last pump. Remember the 786 fib line with a DCB.
What are your thoughts? Comment below and hit the like please. Thank you!
Disclosure: This is just my opinion and not any type of financial advice. I enjoy charting and discussing technical analysis . Don't trade based on my advice. Do your own research! #cryptopickk #bitcoin #altcoins

10/17/21 CATCaterpillar, Inc. ( NYSE:CAT )
Sector: Producer Manufacturing (Trucks/Construction/Farm Machinery)
Current Price: $199.02
Breakout price trigger: $203.00
Buy Zone (Top/Bottom Range): $196.00-$187.00
Price Target: $223.80-$224.50 (1st) $247.20-$248.00 (2nd)
Estimated Duration to Target: 48-51d (1st), 147-155d (2nd)
Contract of Interest: $CAT 12/17/21 210c, $CAT 3/18/22 220c
Trade price as of publish date: $4.10/cnt , $5.60/cnt

Be Ready For a Major Crash on BTCAs we can see, we fall on the 61% which is often the dead cat bounce level or the B wave in Elliott Wave.
The stock market is probably ready to make a major correction soon the Evergrande news can make it faster.
And we have to remember we have some single print in 19.8k to 21k (this is price was hit only a single time which market often retest.) without talk about unfilled CME gap which people think now it will be never filled again.
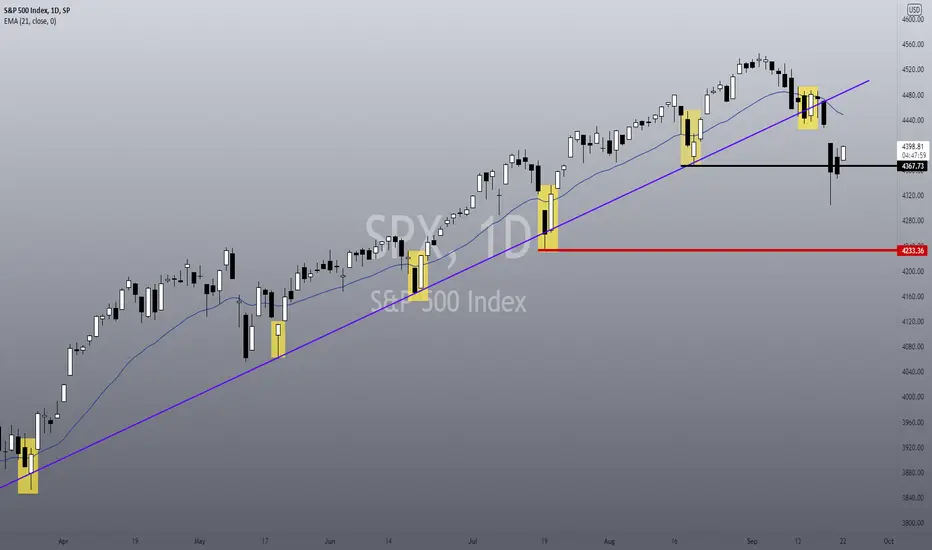
SPX: Crashing again! Time to panic?Hello traders and investors! Let’s see how the SPX is doing today!
Breaking the short-term bull trend, the index is seeking its next support levels. We lost the Pennant downwards, along with the 21 ema and the 4,394. The 4,351 is another good support candidate, which is holding the price for now.
Our last support level is the 4,305, and below this point, we might assume the index will engage a stronger bearish momentum for a few weeks.
By losing the 4,305, we’ll confirm the idea that the index just did a Dead Cat Bounce to the 21 ema and it just resumed the bear trend, frustrating the possible bullish reversal to the ATH.
Right now, the index is in a “no-man’s land”. While we don’t see any meaningful bullish reaction, there’s nothing to do. While we don’t see any bearish confirmation, we can’t say it’ll reverse the long-term bullish bias either.
In the weekly chart, we are still above the 21 ema, and we could stay there for a few weeks from now, doing many frustrating signs. Only if we lost the 21 ema in the weekly chart we’ll see something new, and the market could do a sharper pullback. However, this won't be easy, as we have many support levels in the short/mid-term to work with.
For now, let’s just calmly wait for more signs. If you liked this analysis, remember to follow me to keep in touch with my daily updates.
Have a good day.

$CAT $2.01 leaning on BOVolume starting to show up now, very light pullback volume
STT in red
Holding

SPX: Key Points you must watch from now!Hello traders and investors! Let’s see how the SPX is doing today!
The index is doing exactly what we said it would do in our previous analysis, as it lost the support at 4,435 (1h chart), turning bearish for a few days. However, it is trying to react, and this reaction came quite quickly.
Since the index lost the purple trendline we knew that the bull trend got weaker, but this doesn’t mean reversal . When this happens, we usually seek the next support level, and in this case, the 4,367 is working nicely. We did a false breakout from it this week, but today’s reaction might indicate that we’ll see a reaction, at least to the 21 ema.
The 1h chart has a bullish pivot point at 4,394, which the index is triggering right now at this moment. This might be the start of something new that will cause the rally to the 21 ema in the daily chart.
If the trend will continue or if this will be a classic Dead Cat Bounce , it is too soon to tell. Let’s just react to the next signs.
If you liked this analysis, remember to follow me to keep in touch with my daily updates, and support this idea if it helped you!
Have a good day!
Will dip further is the support break19th Sep 2021
Break below $199 will caused it to resume downtrend to $186 next

Bitcoin is confirming the next Bear MarketHello Everyone,
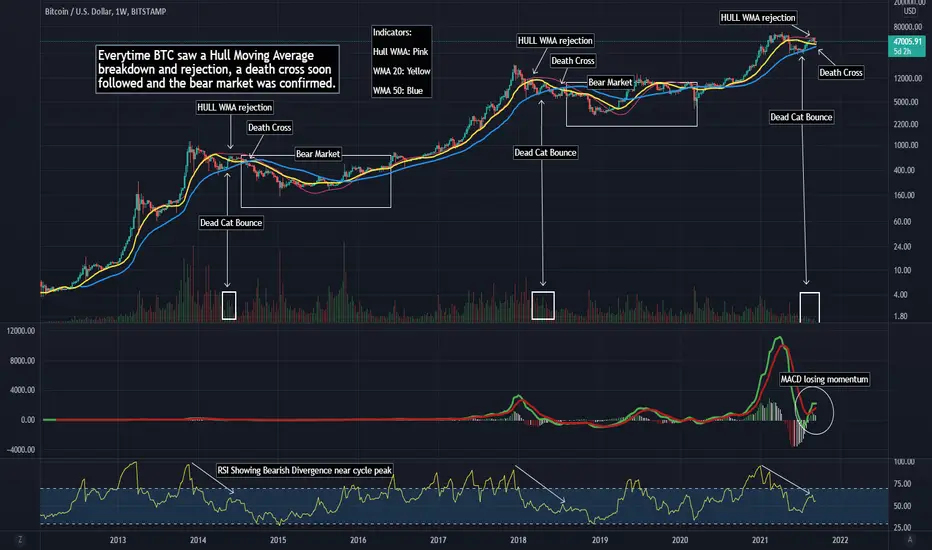
Quick post for today. After a 20x gain over an entire year, I believe Bitcoin is confirming the next bear market cycle. Here are the technicals:
1. Rejection of the Hull Moving Average: The hull moving average has been a consistent determination in whether we remain in cycle or not. In both previous cycles, we see Bitcoin lose the hull moving average then on an attempt to regain, it rejects or fails and price continues downward.
2. Death cross: After rejecting the hull moving average, there is a death cross of the 20WMA and the 50WMA. This immediately happens after rejection and is another confirmation of a bear market.
3. Dead Cat bounce: There were 2 distinct dead cat bounces right after the fall from each cycle ATH. This is noticeable with the bearish price action: low volume higher price
4. Negative RSI: RSI seems to be going down as bitcoin continued to make highs. This is a bearish indication
5. Weakening MACD: MACD is weakening as bitcoin has another attempt at the 65k all time high.
Although some of you may be discouraged, angry, or depressed the bear market is the best place to DCA and restock swing trade buys. My guess is the bottom is consistent with the 200WMA as it has been the bottom of each of the other two bear cycles.
My plan moving forward is to DCA between the 100 and 200 WMA as well as look for swing trade plays during the bear market.
As always, be patient, use risk management, and good luck trading!
$BTC rally-base-drop reversalMy view on #bitcoin non-religiously considering the simple facts.
Short-term we are going to be ranging between 200 DMA and 21 WMA, with strong rejection from 200 DMA sealing the faith of this dead-cat bounce.
From S&D perspective #bitcoin is now completing the rally-base-drop reversal pattern perfectly.
I will be saving all money I can to buy the 200 WMA.
As said in my previous publications, this is where bulls with balls are being made and the ever running $BTC bull run resumes.

Attempt to catch a dead-cat-bounce (be careful)we found a few alt coin short entries over the last few weeks and they are looking pretty good about now now BTC maybe offering us a dead cat bounce. it's a very late entry on the big coin itself but it's what we'd look for after a big move like this so expect a continuation between the 50 and 61.8 retraces
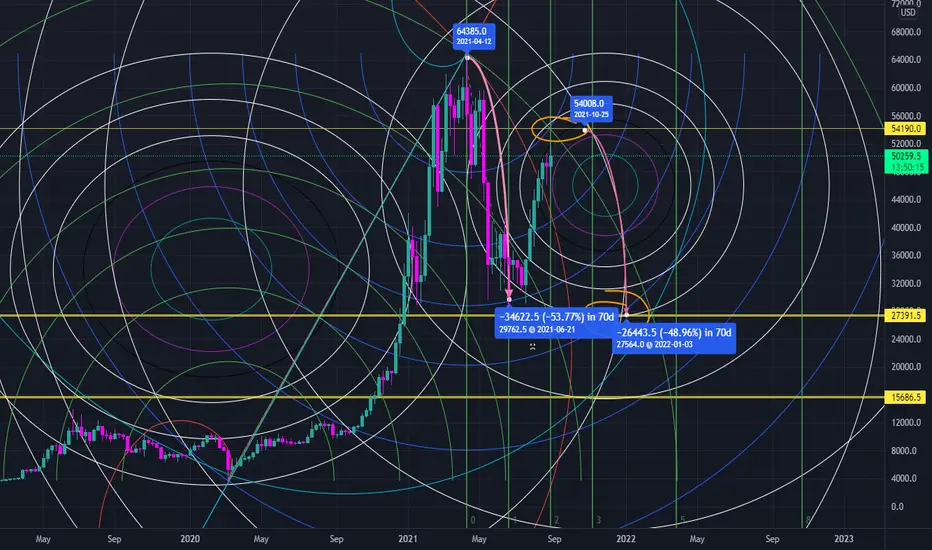
Certainty is dangerous - BTC downsideThis run up from 29k has been fast paced and well accepted by most. Most are certain downside isnt feasible at the current state as BTC is so bullish however given confluence at 54k mixed with a few other indications , i feel our current position is not going to be held for long !
Mapped out are two price ranges highlighting the drop size required to go to 27k . Notice how in the first dump we dropped 34k in 70 days and now we could be looking to dump 26k , sending us to 27k in 70 days.
Currently the dxy looks weak and is showing signs it could return to 90.This is a potentially bullish sign for BTC however that also fits in with my idea here considering we are still 4k away from 54k.
I do expect a pull back to 48k at some point within the next week if we make no attempt at 54k. 27k is still very unlikely however certainty is dangerous
-Ozwald
CATERPILLAR HAS CREATED BUYING ZONE BELOW 207There are buying pressures on CAT stock price below 207. Rejection within this zone may indicate possibility of the stock to re-test the recent swing high above 246.
N.B
- Let emotions and sentiments work for you
-ALWAYS Use Proper Risk Management In Your Trades

