CETUS/USDT 3D — Awaiting a Major Decision at Key Support ZoneCetus Protocol (CETUS) is currently at a highly critical phase, trading just above a strong historical support zone that has repeatedly acted as a key price floor. The chart reveals a tight technical formation, signaling a potential for a significant move in the near term.
---
🔍 Technical Analysis:
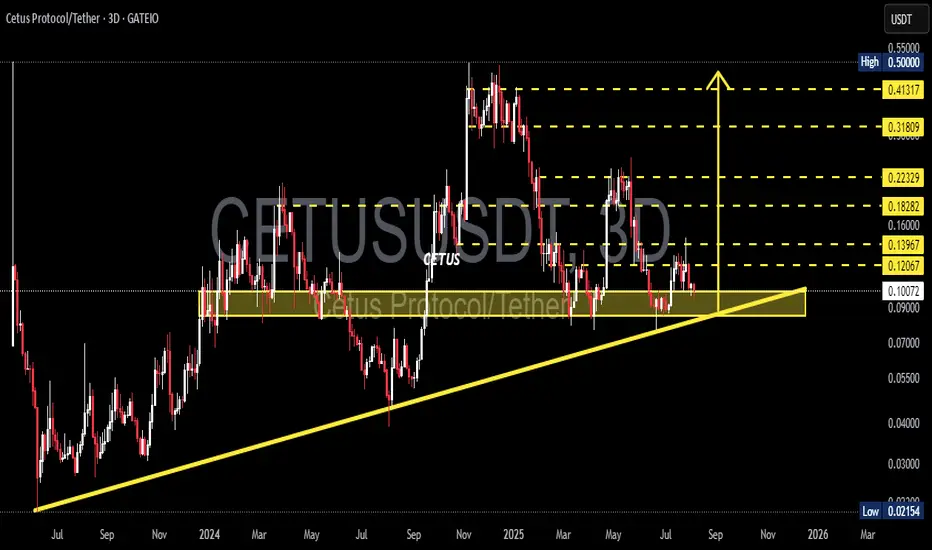
Key Support Zone: $0.09000 – $0.10084
Price is currently testing a major demand area that has historically prevented deeper drops since mid-2023.
Ascending Trendline:
A medium-term trendline from 2023 remains intact, supporting a continued higher low structure.
Decreasing Volume:
Shrinking volume suggests the market is in a state of accumulation or awaiting a strong breakout catalyst.
---
🧩 Price Structure & Patterns:
Horizontal Consolidation above support → indicates potential accumulation phase.
Ascending Triangle Support (flat support + rising trendline) → this pattern is often a bullish continuation when followed by a breakout to the upside.
---
🐂 Bullish Scenario:
If price successfully bounces from the support zone, a step-by-step upward movement becomes likely, with the following targets:
Price Level Role Notes
$0.12067 Initial Resistance Minor rejection zone
$0.13967 Flip Zone Needs breakout confirmation
$0.16000 Mid-Range Resistance Key level for further upside
$0.18282 – $0.22329 Major Bullish Target Break above this signals trend recovery
$0.31809 – $0.41317 Long-term Resistance Potential full retracement zone
A clean breakout above $0.22329 with strong volume could signal a resumption of the long-term bullish trend.
---
🐻 Bearish Scenario:
If the price breaks down below $0.09000 and closes beneath the ascending trendline:
The higher low structure will be invalidated.
Potential downside targets:
$0.07000 (minor support)
$0.05500 – $0.04000 (psychological zones)
$0.02154 (historical low)
This would indicate a shift toward distribution and a broader bearish trend.
---
🧠 Suggested Trading Strategy:
🔁 Reversal Traders: Look for bullish candlestick confirmation (e.g., hammer, engulfing) at support zone.
💥 Breakout Traders: Wait for breakout and retest above $0.13967 before entering.
🛡️ Risk Management: Tight stop-loss below $0.09000, targets aligned with resistance levels.
---
📝 Conclusion:
CETUS/USDT is at a make-or-break level, sitting right above structural support and trendline confluence. A strong bounce here could offer a great risk-reward long opportunity, while a breakdown opens the door to further downside.
Patience and confirmation will be key.
#CETUSUSDT #CETUSProtocol #CryptoBreakout #TrendlineSupport #AltcoinAnalysis #ChartPattern #BullishSetup #BearishScenario #CryptoTechnicalAnalysis
Cetusanalysis
CETUS: The Smart Investment for Short-Term Growth! (12H)Since we placed the red arrow on the chart, the CETUS correction has begun.
It seems to be a double correction, with two diametric patterns—one butterfly and one diamon. connected together.
Currently, we appear to be in wave f of the diamond diametric. Once the correction completes and reaches the green zone, wave g could finish.
We’ll need to see if after wave g, we have wave x, wave h, or a post-pattern movement!
The targets are marked on the chart. A daily candle close below the invalidation level will invalidate this analysis.
For risk management, please don't forget stop loss and capital management
When we reach the first target, save some profit and then change the stop to entry
Comment if you have any questions
Thank You
