$SPY Moving stop up to 3811.06. Great Trade So Far.Great Trade So Far. Follow for more updates on our CFD trading models.
CFD

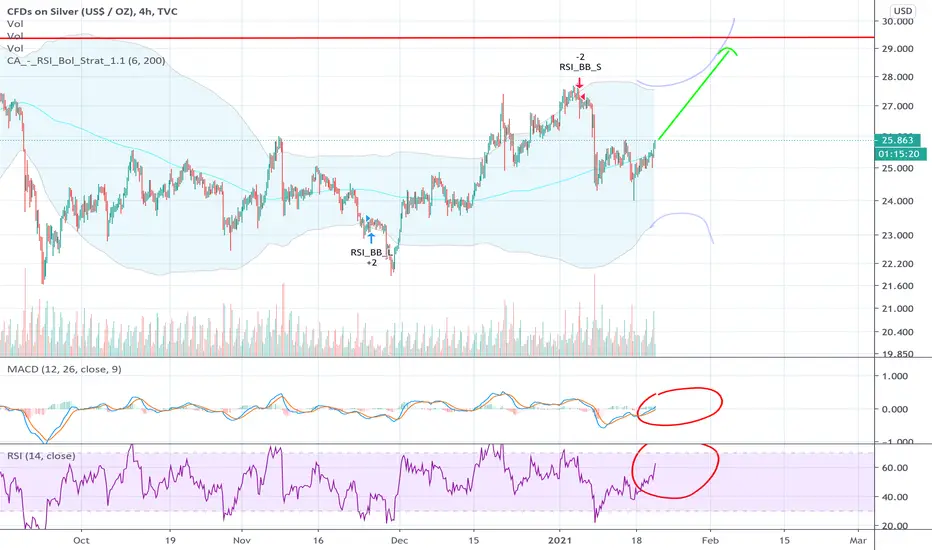
Silver aims at 30$ --> 117$Silver has found strong support at 24$. Tested multiple times.
RSI is well above 50 and MACD is leveling out on the weekly chart. DXY is also showing weakness.
All signs show very bullish momentum and upward pressure. With there being a lot of talk about major federal spending and increase in debt.. Silver will likely continue to grow and become even more volatile.
Silver prices have been artificially suppressed to keep costs low as silver is largely used for manufacturing and many electronic products. Historically the silver/gold ratio has been around 17oz silver per 1oz gold. Silver to gold is currently at around 71 to 1. As the public sale of silver becomes increasingly more accessible, it is becoming harder to control the price via FTE. As a result I expect the price of silver to behave erratically and reach new highs in USD never seen before. 117$ puts silver back at the ratio of about 17/1.
be blessed.
$SPY Re-entered Long at 3797.92. Stop is set at 3765.07.$SPY Under our $SPy swing trading model, we re-entered a long positiion at 3797.92 earlier today. Stop level is at 3765.07. Follow for more udpates on the model. We are off to a great start for 2021.


GOLD (XAUUSD) Technical Outlook & Swing Analysis
Daily/1h multi-timeframe analysis.
Trading recommendations & directional bias.
Please, support this video with like and comment.
Thank you!


sell with small profits 1817 - 1800 - 1770In the past few days, we have seen the value of the dollar rise and gold fall. In the analysis of the chart, we can see the selling position on small targets. This week, there is important news in the market. it is possible for the market to turn up. do not forget your SL and money management. good lock
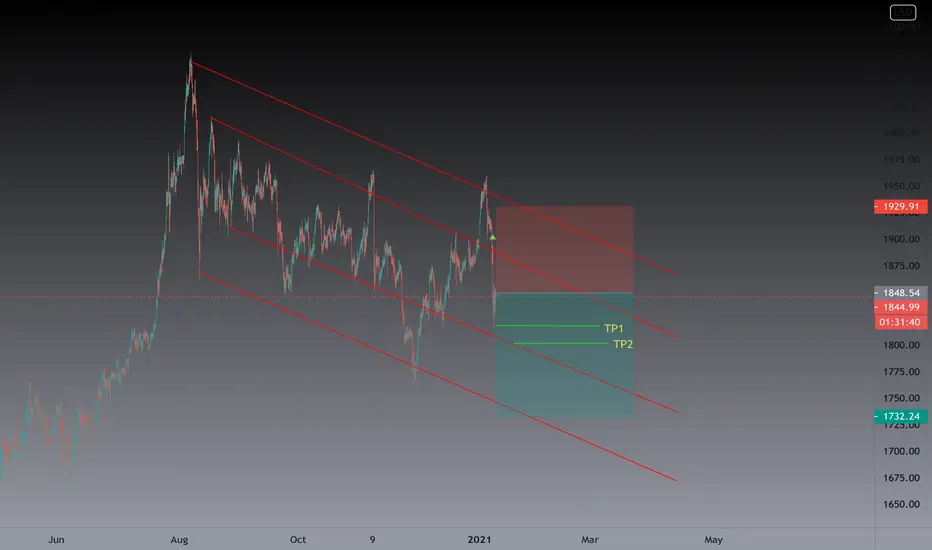
Very important area, 1900, time To buy📈Hello all ladies and gentlemen, this is a good time to buy, ❌ you should be careful that if the uptrend channel is broken and the market goes down, you should exit the trade and enter the selling position📉. good luck

BCOUSD 🛢💵 to test the Resistance.Taking a look at BCOUSD 🛢💵 we can notice that the pair managed to stay above the important fib level of 0.236. The slight spike is highly probable here as the ROC is indicating possible swing with the bounce from the 50 ma.
If you like the idea PLEASE don't forget to hit the LIKE 👍👍👍button
Also share your thoughts and charts here in the comment ⌨️ section


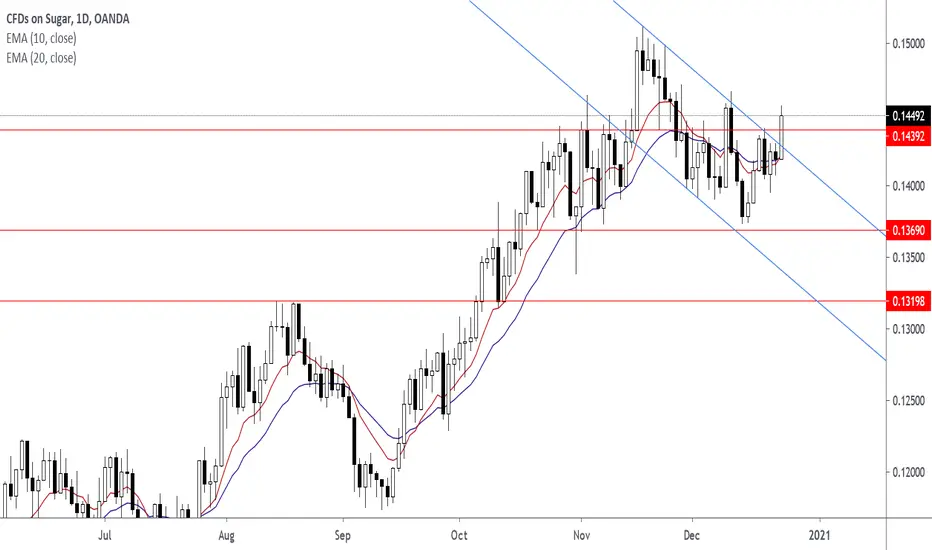
Sugar Trade (Entry at 0.14392) (Take Profit at 0.15120)Enter SUGARUSD at 0.14392. Take Profit at 0.15120.
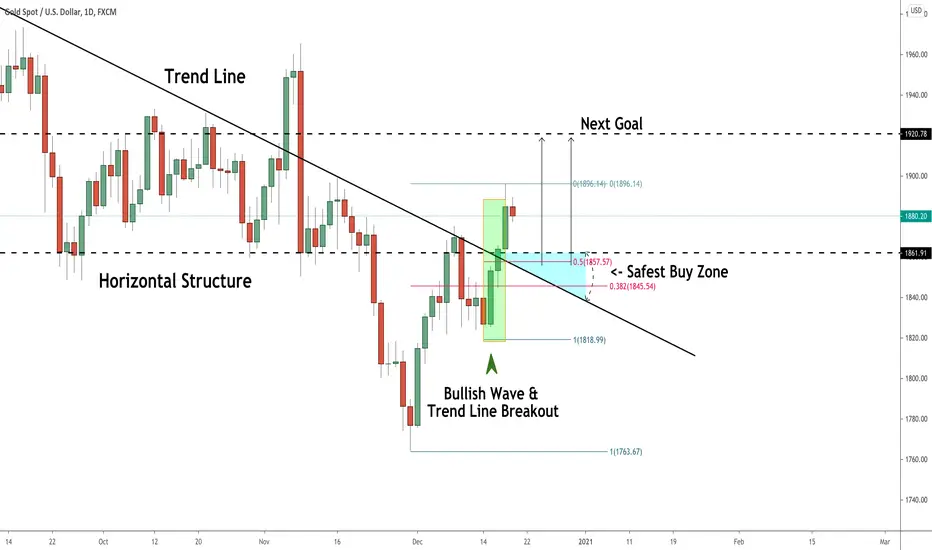
GOLD (XAUUSD) Important Breakout! Where to Buy?!
Confirmed and strong violation of a major falling trend line on gold this week.
Now the price is trading above a major horizontal structure and the above-mentioned trend line.
It is a very strong bullish clue and now bullish continuation is expected.
If you missed a long trade, I would recommend looking for a retest of a blue demand area.
It is the safest spot to buy from.
Just wait for a certain intraday confirmation before you open a position.
Next goal - 1920
USDCAD : Why trade currency as a CFD?CFDs are financial contracts between a broker and trader that pays for the difference in the settlement price between when you open and close a trade.
If a trader expects the currency to move higher, they will enter a long position with a specific lot size. Conversely, if the trader expects the currency to move lower, they will enter a short position, expecting to profit from it.
The benefit of CFDs is that there is no need to own the physical asset. Instead, traders speculate in the difference between opening and closing trade prices. While these contracts can be used to speculate on the foreign exchange markets, the same concept applies to other assets such as commodities, oil and indices.
In Forex trading, CFDs allow us to buy or sell the currencies without actually owning the physical asset. For example, let’s say you live in Canada and, through your analysis, you expect CAD to depreciate and USD to appreciate. What could you do to hedge against the CAD dollar that you have on hand? Well, you can buy or “go long’ on USD/CAD and profit from the movement in prices. By buying or entering a long position on USD/CAD, you are essentially buying the USD and selling CAD.
SO, WHAT IF YOU DECIDED TO TRADE WITHOUT THE USE OF CFDS?
This would mean going down to your local currency dealer and exchanging your physical Canadian dollars for US dollars, leaving you holding on to stacks of US dollars. When the value of the US dollar moves higher, you would once again head back to the currency dealer to exchange them into CAD. Now that the USD is stronger, you can exchange them for more CAD dollars than the initial amount you invested, thereby realising a profit.
SOUNDS LIKE A HASSLE?
It is. That’s why CFDs are so popular for forex trading: it removes the need to hold those stacks of physical cash, making trading much more convenient.

AMAZON AMZN Better understanding of how CFDs workCFDs are financial contracts between a broker and trader that pays for the difference in the settlement price between when you open and close a trade.
If a trader expects the currency to move higher, they will enter a long position with a specific lot size. Conversely, if the trader expects the currency to move lower, they will enter a short position, expecting to profit from it.
The benefit of CFDs is that there is no need to own the physical asset. Instead, traders speculate in the difference between opening and closing trade prices. While these contracts can be used to speculate on the foreign exchange markets, the same concept applies to other assets such as commodities , oil and indices.
To gain a better understanding of how CFDs work, let’s look at Amazon stock as an example.
If you think Amazon shares are going to go higher, you would want to buy into this stock and profit from this opportunity. Hence, you purchase 10 CFDs on Amazon shares at $2,500, so the total value of the trade will be $25,000 (10 x $2,500). If Amazon appreciates to $3,000, you will make $500 per share, which is a $5,000 profit (10 x $500). CFD concepts are applied to forex trading as well.

GOLD (XAUUSD) Still Looks Bearish! Learn Why:
I really like the reaction of gold on a major blue resistance cluster based on a horizontal daily structure and a falling trend line.
With bearish engulfing candle formation on a daily, chances are high that the price will turn bearish next week.
Though, signs of weakness make me reassess the initial goal.
1806 - 1810 is the closest minor support cluster that I would consider for the first goal and 1765 - 1780 as the second.
I will be bullish biased in case of a daily violation of the underlined blue zone.

HOW TO BUY & SELL GOLD : Part1🏅 CFDS VS ETFS 🏅
➡️ GOLD ETFS (Right Chart)
ETFS PHYSICAL GOLD (ASX:GOLD) offers low-cost access to physical gold via the stock exchange and avoids the need for investors to personally store their own bullion.
Each GOLD unit comes with an entitlement to an amount of "physical bullion". This means : Real Gold, Real Bars.
⬅️ GOLD CFDS (Left Chart)
CFDs on GOLD US$/OZ (TVC:GOLD) (OANDA:XAUUSD)
CFD stands for Contracts for Difference, with the difference being between where you enter a trade and where you exit. Simply put, when the position is closed, you’ll receive the profit or incur the loss on that difference. When you trade a CFD you’re speculating on the movement of the price only, rather than traditional stocks where you purchase a physical asset. You do not ever own any real gold bars.
🤓 CFD TRADE EXAMPLE
The price of gold is measured by its weight. Therefore, the price shows how much it costs for one ounce of gold in US dollars. For example, if the gold (XAUUSD) price is $1600.00, it means an ounce of gold is traded at US$1600.00. Similarly, the price of silver is its price per ounce in USD. If the silver (XAGUSD) price is 28.00, it means that an ounce of silver is traded at US$28.00.
If you have bought gold for $1600, you do not have an ounce of gold that you can hold, but you rather have the obligation to buy XAU at US$1600. When you close your position, you sell the XAU and close your exposure. If you sell it for $1605.00, you have made profit of $5 for every ounce (unit) of gold in your contract. The same concept applies to silver trading. If you have bought silver (XAGUSD) for $28.00 and sell at $28.50, you would have made a profit of $0.50 for every ounce of silver in your contract.
🤔 WHY TRADE CFDS?
If you’re looking to invest in the price movements of instruments, rather than purchasing physical assets
To take advantage of swift fluctuations in the underlying instrument or security. This is popular with short-term investors looking to profit from intra-day and overnight movements in the market
To take advantage of leverage and spread capital across a range of different instruments rather than tie it up in a single investment (note: this approach can increase risk)
As a risk management tool to hedge exposure

GOLD (XAUUSD) Price Action & Potential Scenarios
Daily/4h/1h time frame analysis on gold.
Key levels.
Potential scenarios & trading recommendations.
Please, support this video with like and comment.
Thank you!

GOLD (XAUUSD): Preparing for Selling Wave
Gold is very close to a major area of supply on a daily.
Blue zone on a daily chart is based on strong horizontal resistance and falling trend line.
From that zone, I will expect a bearish move.
However, because the zone is quite wide, I would recommend you to look for a confirmation on a lower time frame before you open short.
When short rally will start, the first goal for sellers will be 1780 (local daily structure low).


Is it possible to sell WTI now?Let me analyze WTI from my point of view. If you look back at the chart above, at the 61.8% Fibonacci retracement level (Fib 1) at the price of 45.48 has been formed, which means we hope to sell it. The first target is at the price of 43.90 at the Fibonacci retracement level of 161.8% (Fib 2), and then the second target is at the price of 42.85 at the level of 261.8% (Fib 2). If it turns out that the price is fighting the upward direction and crosses the price of 45.60 (Border line), then the possibility of WTI will continue upwards.

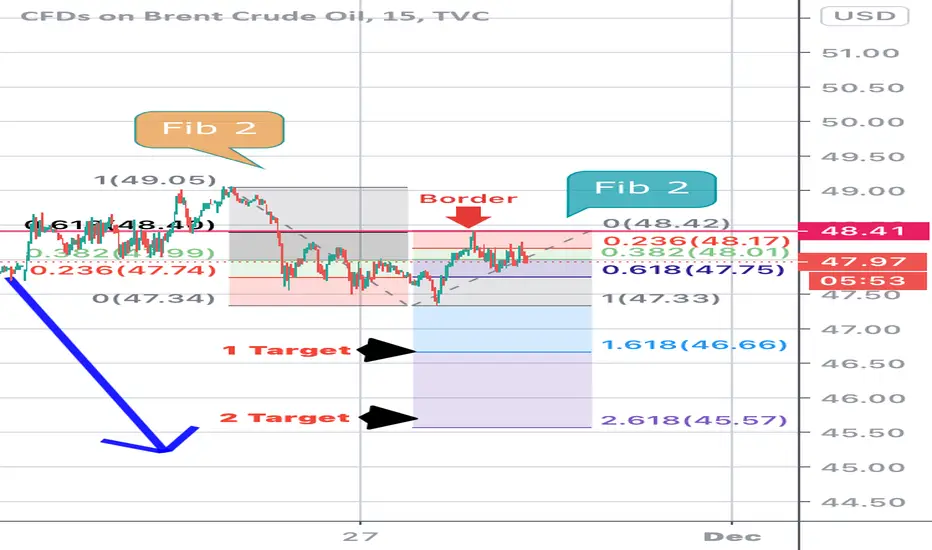
Brent (UKOIL) Update!!Here I added a presentation of chart ideas that I previously explained on the previous chart (below). So there is a change, if the price moves upwards, above the price 49.05 (previously priced at 48.42, chart below at Fib 2 right), then the possibility will go up.
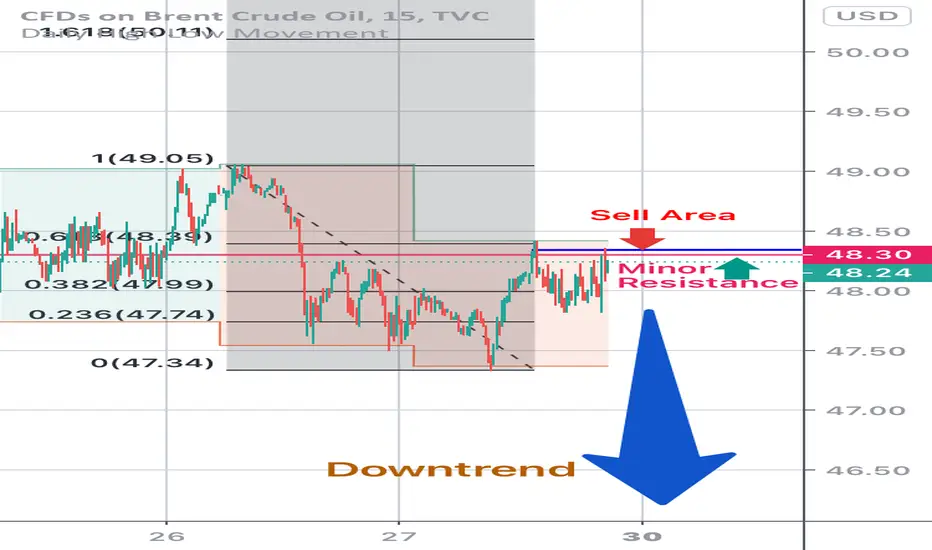
It looks like a good opportunity to sell Brent (UKOIL) nowIt can be seen from the chart above, that the price of Brent (UKOIL) at 48.40 has touched the Fibonacci retracement at the 61.8% level (Fib 2 left) and there is a big possibility of a downward movement with the first target at 46.66 at the 161.8% Fibonacci retracement level (Fib 2 right), and continued with the second target at the price of 45.57 at the level of 261.8% Fibonacci retracement (Fib 2 right). If it turns out that the movement is the opposite towards the upside by passing the price at 48.42 (Border line), then the price is likely to go up.