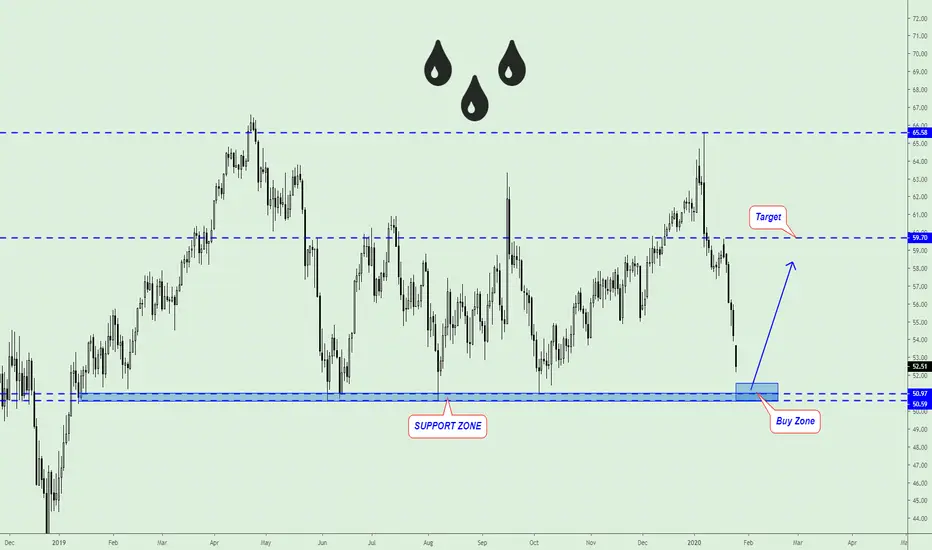
USOIL, The best place for Buy...The best place for Buy USOIL will be near the Support Zone.
The price bounced from it several times.
We can make a lot of pips with such strong movements.
Push like if you think this is a useful idea!
Before to trade my ideas make your own analysis.
Write your comments and questions here!
Thanks for your support!
CFD
XPDUSD | Shooting StarPlease support this idea with LIKE if you find it useful.
Initiate Short.
Entry - 2413.510
TP1 - 2140.442
TP2 - 1967.684
SL - 2502.676
Reason: Exponential Growth, Shooting Star reversal Pattern. The price is overbought According to RSI.
Risky: Remember this is a risky setup despite market shows us irrational behavior and previously we got stopped out.
Thank you for reading this idea! Hope it's been useful to you and some of us will turn it into profitable.
Remember this analysis is not 100% accurate. No single analysis is. To make a decision follow your own thoughts.
The information given is not a Financial Advise.

NATGASUSD | Sideways Market Since the End of 2008Please support this idea with LIKE if you find it useful.
Initiate Long.
Entry - 1.967
TP1 - 2.788
TP2 - 3.752
TP3 - 4.687
SL - 1.626
Reason: At first look we have a Descending Triangle, though current formation is a Channel (with fakeouts) since the end of 2008. Pay attention or Red Resistance Line which previously supported the Line. In this case we have the price bottomed. We can initiate Long with Stop Loss that covers the Support zone in order to catch the Retracement.
Trade can take 1+ year. For this setup to be more safe it's better to pick up the asset on retracement movement.
Thank you for reading this idea! Hope it's been useful to you and some of us will turn it into profitable.
Remember this analysis is not 100% accurate. No single analysis is. To make a decision follow your own thoughts.
The information given is not a Financial Advise.

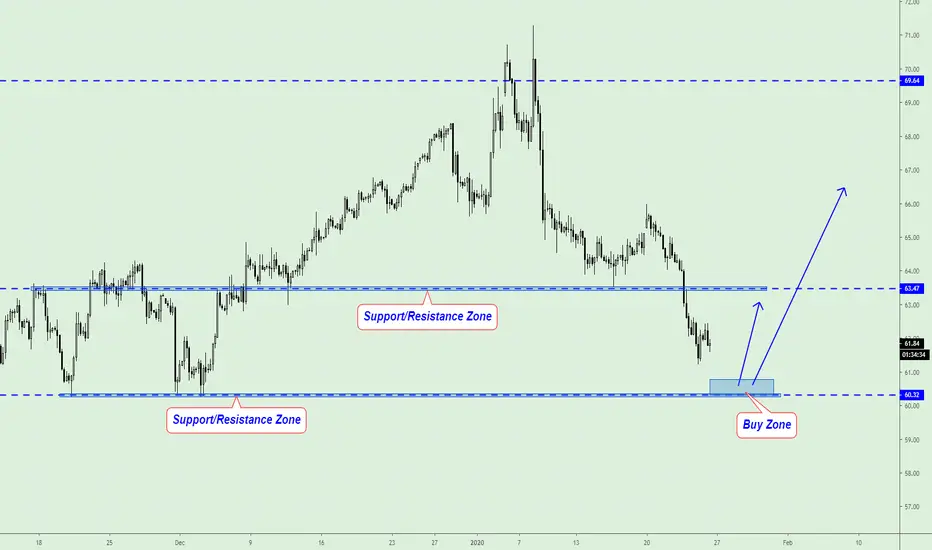
UKOIL is near the Support/Resistance Zone...The price can bounce from the Support/Resistance Zone and rise to 70.00.
The best Buy will be after the false breakout.
Potential profit will be in 3...5 times bigger than risk.
Push like if you think this is a useful idea!
Before to trade my ideas make your own analysis.
Write your comments and questions here!
Thanks for your support!
XAUUSD | Rising Wedge (Risky Setup) UpdatePlease support this idea with LIKE if you find it useful.
Previously price did not reach our entry point and continued forming the pattern
Initiate Short.
Entry - 1555.62
TP1 - 1537.01
TP2 - 1531.27
TP3 - 1524.84
SL - 1561.82
Reason: Rising wedge plur rejection from Pattern's resistance and Pivot Point.
This asset highly risky for short though, if you are a conservative trader better to wait for good entry to long rather than short the asset.
Thank you for reading this idea! Hope it's been useful to you and some of us will turn it into profitable.
Remember this analysis is not 100% accurate. No single analysis is. To make a decision follow your own thoughts.
The information given is not a Financial Advise.

USOIL (WTI) 23/1/2020Price at daily important area (54.98). Now in the daily chart price formed a hammer and in the 4H chart there is an engulfing. My first TP is 57.80, final TP could be 60.60. SL 54.40.

XAUUSD is above support, the price of gold will go up.This chart shows us that the price is currently at support and should rise up.
potential targets in 1568; 1572.
If you liked this idea, please like and subscribe to my profile.
This idea does not provide the financial advice.

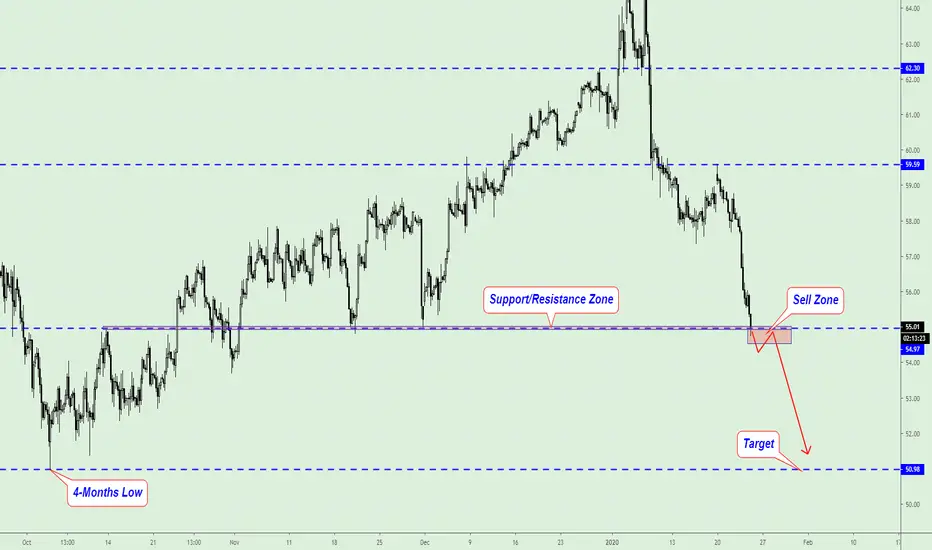
USOIL, is close to the Support/Resistance Zone...The price can continue to fall.
If the H4 candle will close under the Support/Resistance Zone we can look for an accurate Sell entry.
Potential profit will be 3 times bigger than the risk.
Push like if you think this is a useful idea!
Before to trade my ideas make your own analysis.
Write your comments and questions here!
Thanks for your support!
XAUUSD | Rising Wedge (Risky Setup)Please support this idea with LIKE if you find it useful.
Initiate Short.
Entry - 1550.11
TP1 - 1531.27
TP2 - 1524.84
SL - 1556.31
Reason: Rising wedge plus rejection by Ichi Cloud resistance. Also the Price might breakout of Ichi Cloud and lose its Pivot Point Support.
This asset highly risky for short though, if you are a conservative trader better to wait for good entry to long rather than short the asset.
Thank you for reading this idea! Hope it's been useful to you and some of us will turn it into profitable.
Remember this analysis is not 100% accurate. No single analysis is. To make a decision follow your own thoughts.
The information given is not a Financial Advise.

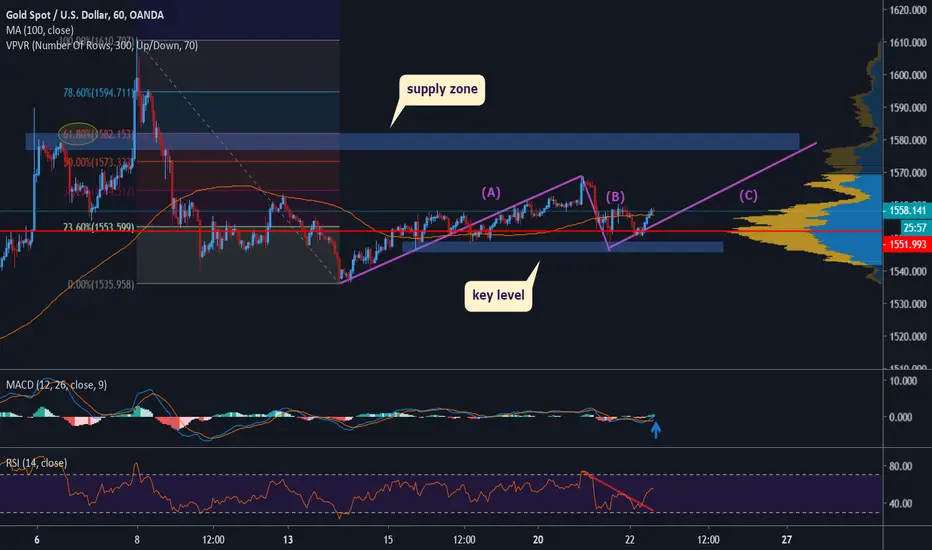
GOLD IS FORMING BULLISH PATTERN 123Strong bullish movement ended at level 1568.73 forming wave (A) then corrective wave (B) is occurred until 61.8% Fibonacci level of preceding wave (A) at level 1548.78
price is rejected from this level
RSI broke downtrend
MACD shows bullish momentum
Price is supported on Moving Average 100
Above HVN at level 1552
It's expected forming strong bullish wave (C) to target the supply zone and 61.8% Fibonacci level of the main bearish wave at level 1582.15

NATGAS, Sell after the pullback..We can open a Sell position if the price will make a pullback to 5-Months Low 2.039.
The best entry will be after the false breakout.
Potential profit will be 3 times bigger than the risk.
Push like if you think this is a useful idea!
Before to trade my ideas make your own analysis.
Write your comments and questions here!
Thanks for your support!

Gold 18/1/2020Gold shows a strong rejection on the monthly ressistance and yesterday it closed with a hanging man (weekly). Expecting a bearish momentum for next week.

USOIL COMING STRONG BULLISH WAVEStrong bullish wave ended at level 65.61
then correction occurred until 50% Fibonacci level at 58.32
Price rejected from major uptrendline
MACD shows positive divergence
Price is supported above HVN at level 58.25
RSI is in uptrend
We r expecting for coming strong bullish wave to target the resistance zone at level 62.80

GER30 Investors Strive to Break Above Historical High LevelPrimeXBT is here again with another technical analysis breakdown, and today we are taking a look at the GER 30 .
The Germany 30 Index has continued to churn sideways above the 12900 key medium-term pivotal support and slightly below its strong resistance that exists around its all-time highs near 13590.
The price action combined with the Relative Strength Index is staying strong, but GER30 has formed a bearish divergence, which often indicates that a trend reversal is forming from bullish to bearish, and a downtrend or valuation adjustment could soon follow.
In addition, given the bearish configurations seen in the S&P 500, we don't have the conviction to maintain the bullish bias for the Germany 30 Index. Thus, its trend will likely turn neutral at this juncture between 13590 and 12900. A break below 12900 and the middle line of the rising channel validates a potential corrective decline below the 12500 levels.
On the flip side, only a daily close above 13600 opens up the gates for a further rally to target the next resistance at 14550, which is a 1.272% Fibonacci level and upper boundary the large ascending channel.
Once the price reaches the resistance 1.272% Fibonacci level, a rejection could cause a fall to the previous all-time high level.
Support level: 12900
Resistance level: 13590
Day's range: 13361.8 — 13508.0
We appreciate the continued support that PrimeXBT has received from readers and traders like you, and hope you have great success with all your future trades!


DAX (GER30) is near the Historical Key Level...The price is near the Historical Key Level 13600.0.
It's a huge chance that it will bounce down.
The best Sell entry will be after the false breakout.
Push like if you think this is a useful idea!
Before to trade my ideas make your own analysis.
Write your comments and questions here!
Thanks for your support!

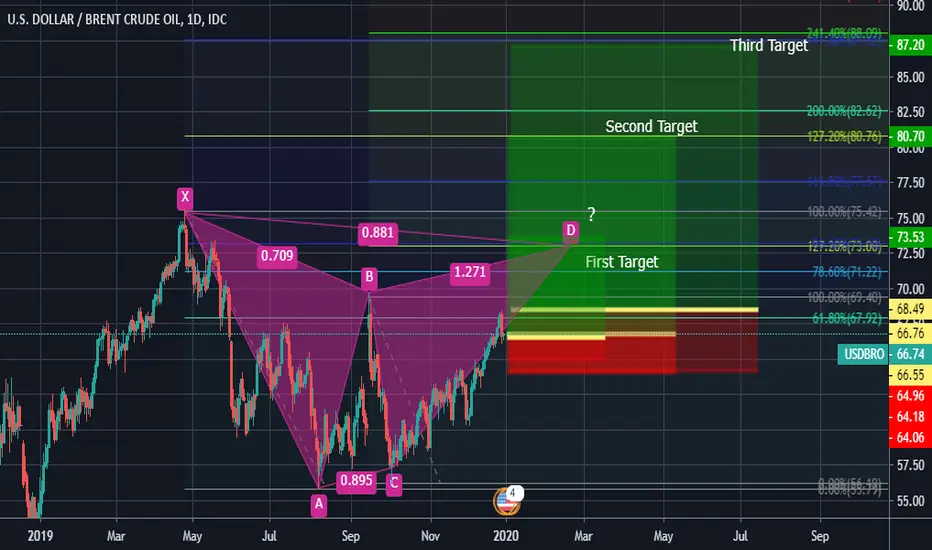
USDBRO Brent Daily Long with 3 TPs with 50 Pips Trilling SLwe believe the First TP should be Triggered in order for the harmonic pattern forms and then it should touch the Second Target for completing the second pattern and henceforth till 3 TP,
keep in mind it is a Buy order with a 50 Pips Trilling Stop loss.
there is a Buy Stop for the 3 TP with 50 pips trilling SL,
If the First TP is broken and passed the First Level we are expecting the Second Target to be our next Goal but If it could not pass the First Level and a Big Retracement happens then we have a Second Scenario and we should look for a reversal...
be careful about your Position Sizing and it should be Proportional to your Account Balance as it is a very long Time Analysis and Trade, each candle is representing a Day so it may take up to a month or more
Entry and Exit points should be considered in a Range of Pips not an exact point.
Enjoy Trading sensibly
please do n't hesitate to Ask us any questions in comments.
Good Luck
GOLD is above the Mirror Level!The price broked the Mirror Level 1557.31 and made a false breakout after a pullback.
We can open Buy if it will make a retest of that level.
Potential profit will be 3 times bigger than the risk.
Push like if you think this is a useful idea!
Before to trade my ideas make your own analyze.
Write your comments and questions here!
Thanks for your support!


