GBPUSD - Following The Trend!Hello TradingView Family / Fellow Traders. This is Richard, also known as theSignalyst.
📈GBPUSD has been overall bullish, trading within the rising channel marked in green.
Currently, GBPUSD is undergoing a correction phase.
Moreover, it is retesting massive demand zone in blue.
🏹 Thus, the highlighted green circle is a strong area to look for trend-following buy setups as it is the intersection of the blue support and lower green trendline acting as a non-horizontal support.
📚 As per my trading style:
As #GBPUSD approaches the green circle zone, I will be looking for bullish reversal setups (like a double bottom pattern, trendline break , and so on...)
📚 Always follow your trading plan regarding entry, risk management, and trade management.
Good luck!
All Strategies Are Good; If Managed Properly!
~Rich
CFD

2024-07-16 - priceactiontds - daily update - daxGood Evening and I hope you are well.
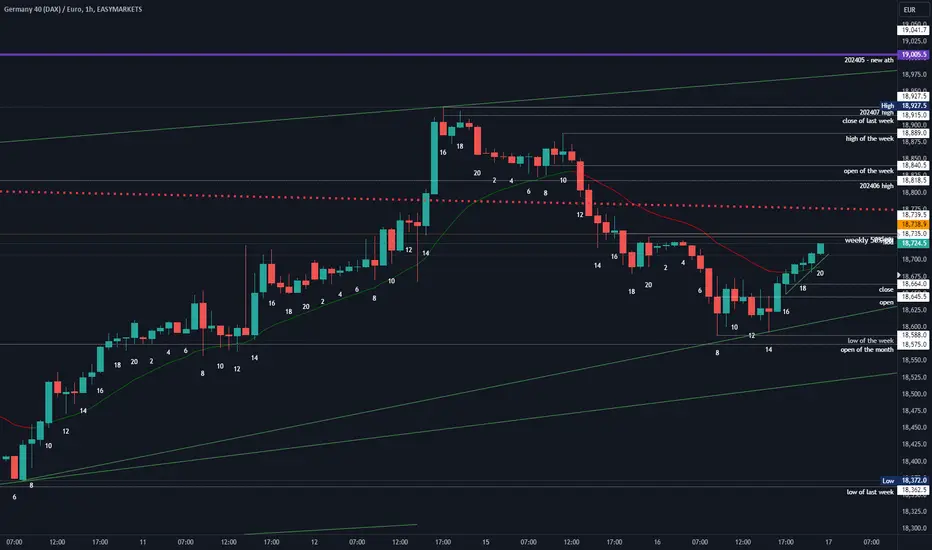
comment: Bears got follow through down to 18600 where Bulls were eager to buy and not wait for the market to hit the daily 20ema or the bull trend line. That’s strength by the bulls. My target was 18570 and we got 18590, that’s decent enough. The buying in the US session was still surprising to me but then I guess it’s up again. Last stand for the bears is 18740ish where the weekly 50% pullback is but I doubt it can hold.
current market cycle: trading range (triangle on the daily chart - technically bears traded back into the triangle)
key levels: small range 18600 / 18900
bull case: Bulls bought the double bottom 18600 above the bull channel support line and now they want back up above 18800 and print a new ath. The broad bull channel leads exactly to the ath and leg1 and leg2 were 630 and 550 points big. If we get 500 points up, that would lead us to 19100.
Invalidation is below 18600.
bear case: Bears failed at 18600 and now odds favor the bulls to get back above 18800 again. Can the 50% pb at 18740 or the broken triangle bear trend line act as resistance? I highly doubt that. Got nothing for the bears here.
Invalidation is above 18750.
short term: Bullish if we stay above 18600 for at least 18800 but probably higher.
medium-long term: My long term outlook stays bearish and I expect at least a -20% correction in 2024. Medium term is 17100 while I think we can touch the big bull trend line starting 2022-10 around 16700 in 2024. —unchanged
current swing trade: Short since 18700, added to shorts 18900. Will hold this till Cathy closes ARKK or the big short 2.0 is announced. —unchanged
trade of the day: Again buying a double bottom at big support on the 1h tf. Bar 8 + 14. Both had bigger tails below and market found not enough sellers below 18600. Had to get long latest bar 17. Buying bar 16 was tough because you would have bought right under the 1h 20ema and previous resistance. Any long below 18600 was king.
#202429 - priceactiontds - weekly update - daxGood Evening and I hope you are well.
Quote from last week:
comment: We got the breakout to the upside, then the downside and another upside breakout again. Clearly not the continuation of a strong bull trend but a leg inside the trading range. Friday’s bull bar is a bad buy going into next week, which raises the odds of market moving sideways to down. Two bull wedges on the daily chart and I slightly favor the bears to break to the downside at least to the daily ema 18460. Weekly tf gives head & shoulders vibe but as long as market is staying above the weekly 20ema at 18200, it’s neutral inside the given key level.
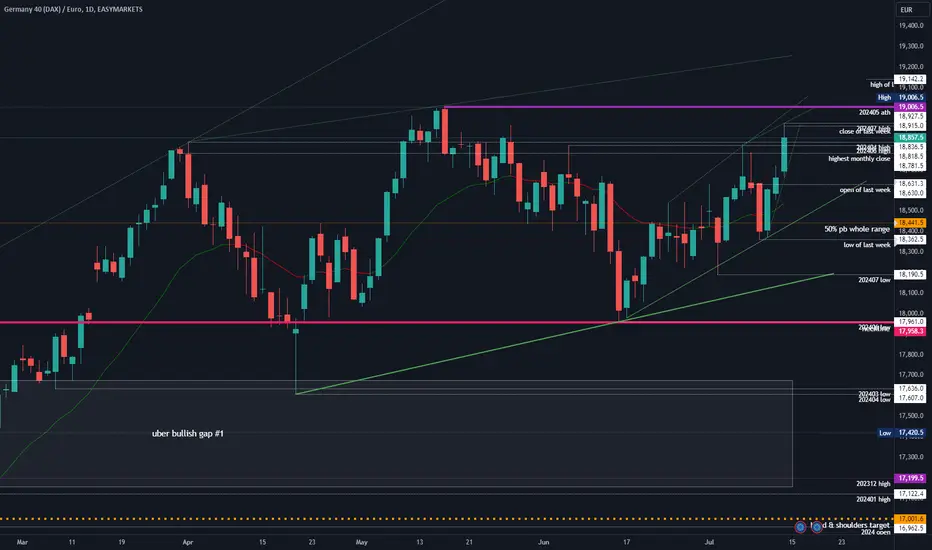
comment: Big down, bigger up. Again. High was high enough to qualify as another double top but the high also undershot the bull wedge resistance line. Bulls have not been able to print more then 3 consecutive bull bars since May. Why would they now? Bulls bought dips and I doubt they want to buy above 18800 all of a sudden. Odds favor the bears to trade to the bull channel support around 18500 over the next 1-2 days.
current market cycle: trading range - go look at the monthly chart. It’s a clear 4 month trading range. —unchanged
key levels: small range 18500 / 18900
bull case:
Bulls want to stay inside the bull wedges and break above them to retest the ath 19006. They are making higher highs and higher lows and are above all important ema.
Above is from last Sunday and still valid. As long as bulls trade above the daily 20ema and inside the bull channel/exp triangle/wedge (yes all apply), it’s bullish. Problem with the bull case is, do you really want to buy above 18800? Market knows only rejections above this price so no matter how you put it, new longs here are bad. Can you buy intraday dips at support for scalps? Absolutely.
Invalidation is below 18360.
bear case: Bears are at the exact same spot as last Sunday but just a tat higher. They want a big reversal again at multiple resistance above 18800. They also see all the rejections from the past months at this level and shorting here has been very profitable. They also know it’s a bad buy for the bulls up here. Odds clearly favor them to trade back to at least 18600 but we will probably see 18500 early next week.
Invalidation is above 18900. Market was rejected twice here on Friday and reversed. Bears do not want to see the market testing that price again or they will probably give up.
outlook last week:
short term: Neutral. Higher highs, lower lows. Expanding triangle, form of trading range. 50% pb is 18439 and if bulls do not rally strongly on Monday, I will look for weakness and a pullback to 18450 or lower.
→ Last Sunday we traded 18666 and now we are at 18857. High of the week was 18927 and the low was 18362. Outlook was ok. I said we test back down and we did even 100 points lower than I thought. Also said bulls were in control above all ema. I absolutely did not think bulls can do 18900+ again but here we are.
short term: Bearish at least to 18500. It’s 50/50 if bulls can do a higher high or will only print lower highs from here so I’m not into guessing. Looking for early weakness and then at 18500 absolutely neutral and let the market decide where it wants to go next. Any bad Dax earnings next week will probably flush it below 18500 again.
medium-long term: 17000 over the next 3-6 Months and when we get there, I update again. —unchanged
current swing trade: Short since 18700, added to shorts 18900. Will hold this till Cathy closes ARKK or the big short 2.0 is announced.
Chart update: Nope.
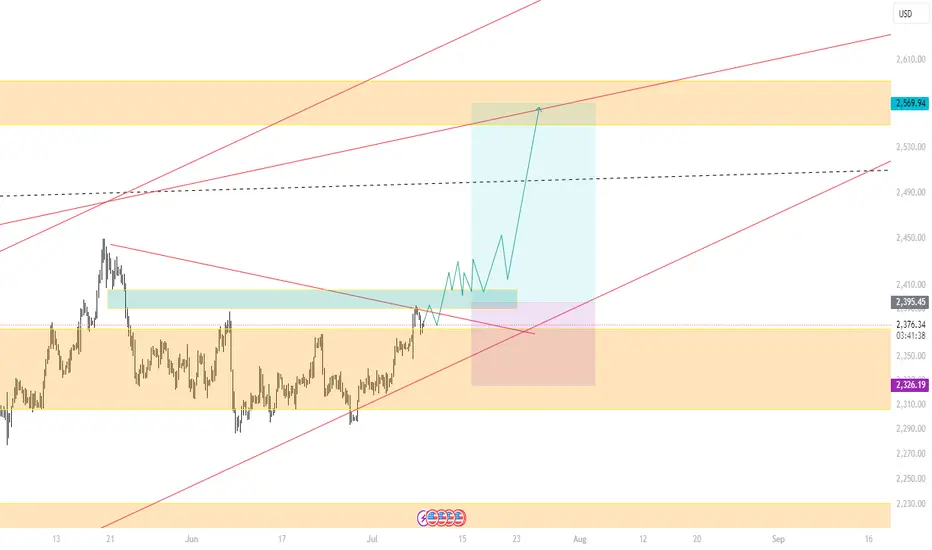
gold is ready to catch new ATH in my opinion when we reach at 2440 and all of the feds speech ended we are ready to pump my target is 2565
dyor its just trend trading and analysis
2024-07-04 - priceactiontds - daily update - daxGood Evening and I hope you are well.
dax
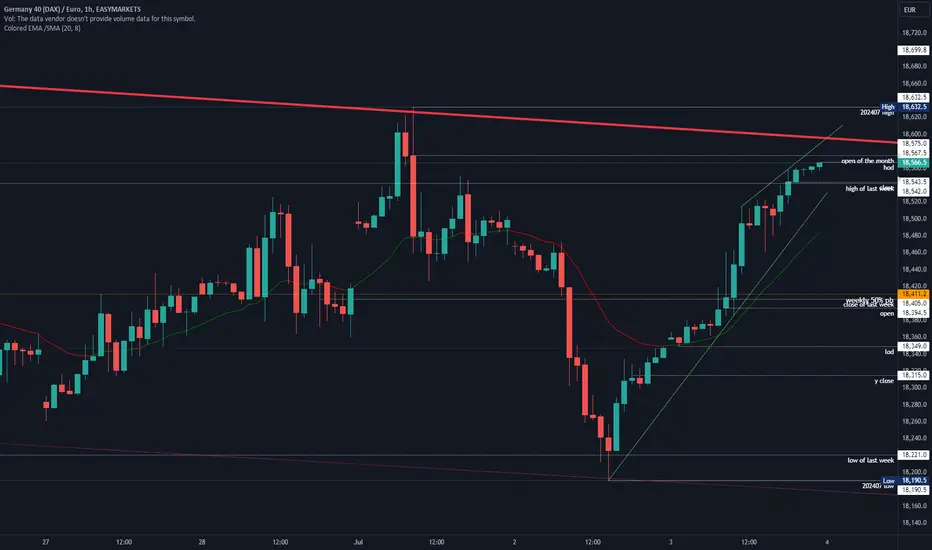
comment: Uneventful trading was expect, since US holidays mostly go sideways in a tight trading range. Market had a good spike at the open which had to be faded and that was the trade of the day. Other than that, market is oscillating around 18600, which is 25 points above the open of the week/month. It’s do or die for both sides here. If bulls can break above 18630, 18900 comes in play. If bears win it, we could have a nasty reversal and will be on our way to 18000 again. I still think the bears trend line could be in play, if bears trade below it early tomorrow. If not, successful breakout above and odds will favor the bulls.
current market cycle: trading range (triangle)
key levels: 18200 - 18600
bull case: Bulls want to break above 18600 and out of the triangle. If they manage that, bears will likely give up and market is free to trade 18800 or 19000 again. —unchanged
Invalidation is below 18500.
bear case: Bears need to prevent prices above 18630 and break outside of this tight bull wedge. Dax is in a trading range for 6 months and betting on a continuation of it, is far more profitable in the long run than betting on breakouts. R:R here is on the bears side but I would not think about shorts above 18500. So bears see an expanding triangle, a bigger triangle and a small bull trend that already had 3 pushes up. If they can’t turn it here, we will probably melt to 19000 like nasdaq did today. Since we are currently seeing a funny rotation between the markets, absolutely possible that liquidity will be shoved into Dax tomorrow for a breakout.
Update: Since text above is still valid, I did not change it.
Invalidation is above 18630.
short term: Can’t be bearish after 2 strong bull days but I sure won’t be bullish at multiple resistances. I wait for strong buying/selling and follow the market. Can absolutely see this breaking to either side tomorrow. What I don’t expect is market to stall above 18500. Either down or up. —unchanged
medium-long term: My long term outlook stays bearish and I expect at least a -20% correction in 2024. Medium term is 17100 while I think we can touch the big bull trend line starting 2022-10 around 16700 in 2024. —unchanged
current swing trade: None
trade of the day: Just don’t trade on these days unless you are 9/10 days in tight trading ranges profitable.
If you enjoy my writings, please leave a boost or follow.
Thank you and I wish your trading to be profitable.

2024-07-03 - priceactiontds - daily update - daxGood Evening and I hope you are well.
dax
comment: Globex was the low of the day and bulls just bought relentlessly since the EU open. 3 doji bear bars on the 1h chart today will make follow through likely but we are again at the bear trend line in this big triangle and that line held 4 times now. Betting on a breakout is a losing strategy. Wait for it to happen and follow the market.
current market cycle: trading range (triangle)
key levels: 18200 - 18600
bull case: Bulls want to break above 18600 and out of the triangle. If they manage that, bears will likely give up and market is free to trade 18800 or 19000 again.
Invalidation is below 18500.
bear case: Bears need to prevent prices above 18630 and break outside of this tight bull wedge. Dax is in a trading range for 6 months and betting on a continuation of it, is far more profitable in the long run than betting on breakouts. R:R here is on the bears side but I would not think about shorts above 18500. So bears see an expanding triangle, a bigger triangle and a small bull trend that already had 3 pushes up. If they can’t turn it here, we will probably melt to 19000 like nasdaq did today. Since we are currently seeing a funny rotation between the markets, absolutely possible that liquidity will be shoved into Dax tomorrow for a breakout.
Invalidation is above 18630.
short term: Can’t be bearish after 2 strong bull days but I sure won’t be bullish at multiple resistances. I wait for strong buying/selling and follow the market. Can absolutely see this breaking to either side tomorrow. What I don’t expect is market to stall above 18500. Either down or up.
medium-long term: My long term outlook stays bearish and I expect at least a -20% correction in 2024. Medium term is 17100 while I think we can touch the big bull trend line starting 2022-10 around 16700 in 2024. —unchanged
current swing trade: None
trade of the day: Long anywhere. Watch higher time frames because they left no doubt today. I made that mistake and could not get myself into longs. Bad trading on my end.
#202426 - priceactiontds - weekly update - daxGood Evening and I hope you are well.
dax cfd
Quote from last week:
bull case: Bulls see it as a small pullback and a sell vacuum on Friday to the big round support 18000. They want to create the same reversal as they did on 2024-04-19 with a 2% up day. The pullback in late March and April was 13 days long while we are in a 21 day long pullback. Bulls also argue that this is the first touch of the weekly 20ema since 2023-11 when we sliced through and have not touched it once since. Trends tend to test the extreme after the trend line is broken. I have absolutely no confidence in the bears to crash from here on, without at least a retest of the bull trend line at around 18300. If bears manage to close the gap to 17100, I am obviously wrong.
comment: Sell vacuum theory was spot on. Bears printed 2 big good looking bars right to huge support and got no follow through. Bulls used it to trade back at least to the daily ema and 2/3 of the move. Huge price level around 18400/18450 with the ema. Bulls want above to test upper expanding triangle around 18600 and bears want a bigger second leg down to 17600. Both completely valid arguments and I will wait for a clear breakout before following.
current market cycle: trading range - go look at the monthly chart. It’s a clear 4 month trading range. —unchanged
key levels: small range 17600 / 18500
bull case: Bulls already had 2 pushes up in this pullback and they want a third one to around 18600. Their first target is a 1h close above the daily ema 18430.
Invalidation is below 18260.
bear case: I do think bears last chance here at the daily ema or they risk another bull leg to 18600. I think the odds are 50/50 for either side on Monday/Tuesday. Bears see this as a higher pullback in the new steeper bear trend that started 2023-06-13 with the two big bear bars. If they fail, market will spend more time in the range 18000-18600.
Invalidation is a 1h close above 18460.
outlook last week:
“short term: Neutral. Please read on so you know why and how I will trade it.
So bears are in control. Below all ema and really big red bars and all red bars for 5 weeks. I’m still not shorting right at 18000. That’s insane. Can we go lower on momentum to 17600? Yes. Will I short it? Bet. R:R here is on the bull side if they build buying pressure and get follow through. Until all of that I am neutral.”
→ Last Sunday we traded 18016 and now we are at 18367. High of the week was 18448 so that outlook was as good as it gets. Hope you made some.
short term: Neutral again. Need to see a clear winner here at the daily 20ema for the next direction.
medium-long term: 17000 over the next 3-6 Months and when we get there, I update again.
current swing trade: None but will look for weakness on Monday/Tuesday for another big leg down. Sp500 and Nasdaq have to also be weak for that.
Chart update: No bigger updates on my chart. Green two legged correction (ABC) was spot on and is still valid.

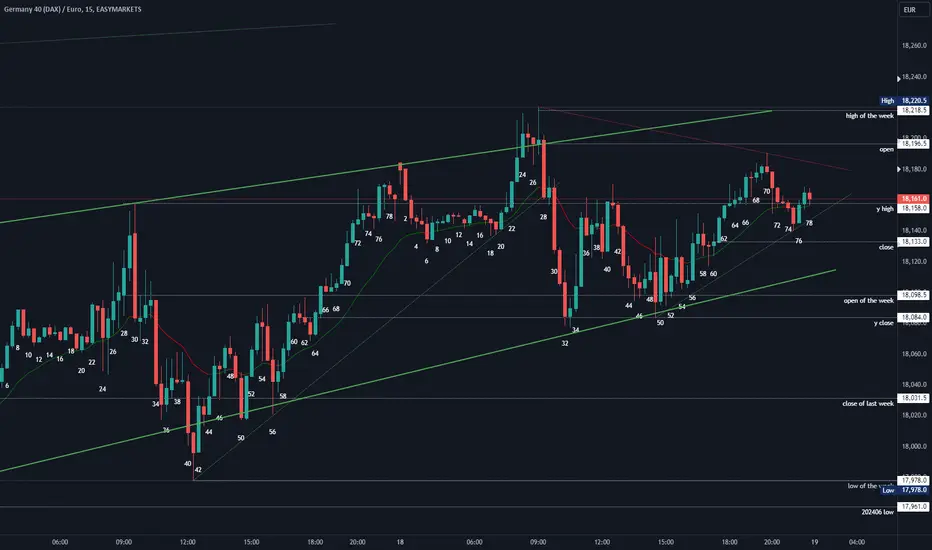
2024-06-18 - a daily price action after hour update - daxGood Evening and I hope you are well.
overall market comment
Indexes had their expected trading range price action today. Mostly what happens after huge days. Markets are in balance here, which is good for the bulls.
Commodities also all green today. Oil is grinding to 81/82 while Gold is moving sideways under the daily 20ema. I expect Oil to pull back soon and my preferred path for Gold is a break below the triangle and 2300 for another big leg down.
dax
comment: Well, what did we learn today? Not much tbh. It’s still a bear flag and bears keeping it below 18200, which is bearish. My target was at least 18300 for the bulls. Daily ema is at 18450 and that’s also where the bull trend line is for a retest of the breakout. All good targets above but for now, bears are in full control. Bulls need a good 1h bar close above 18200 for higher prices. You won’t find many new info’s below compared to yesterday.
current market cycle: probably bear trend if the pullback stays under 18300/18360
key levels: 18000 - 18400
bull case: Bulls need a good 1h bar close above 18200 for higher prices. Not much more magic to it. If we trade below 18080, we test 18000 again.
Invalidation is below 18080.
bear case: Bears are finding acceptance below 18200, which is very bearish. They are in full control and probably letting the daily ema come closer to attract new bears for another leg below 18000.
Invalidation is above 18360.
short term: neutral. Market is in balance here until breakout above 18200 or below 18080
medium-long term: My long term outlook stays bearish and I expect at least a -20% correction in 2024. Medium term is 17100 while I think we can touch the big bull trend line starting 2022-10 around 16700 in 2024. —unchanged
current swing trade: None
trade of the day: Yeah good question. So the open of the week was 18098 and y close was 18084. Good support area for longs. So buying the double bottom bar 33 + 49 was reasonable. Short from the open was also good because it was too strong to not get short and the upper bull channel line held.
#202425 - a weekly price action market recap and outlook - daxGood Evening and I hope you are well.
dax cfd
Quote from last week:
comment: Market in total balance inside key levels. It’s the 4th consecutive bear week but we are still above the midpoint of the first week of May where dax gained 800 points. This selling is as weak as it gets and that’s why another leg up is much more likely than an acceleration to the downside. We are oscillating around the daily 20ema at 18600 and right at the bull trend line from January. Market is in breakout mode and will have it next week. Odds favor the bulls but I wait for confirmation after US CPI and FOMC.
comment: Bears finally did it. They broke to the downside when the higher probability trade was bullish. They actually broke below the expanding triangle which held for 4 weeks and sliced through the bull trend line that began 2022-10-03. For the dax which made 60.69% in that time, to just slice through that line, is something unusual to say the least. Is it now time to get uber bearish? I don’t think so. News outlets will tell you it’s because of eurozone fear and elections and blablabla. We are 5% from the ath. That’s a small pull-back to the neckline and the big 18000 support. Entering new shorts down here is as bad of a trade as you can come up with.
current market cycle: trading range - go look at the monthly chart. It’s a clear 4 month trading range.
key levels: small range 17600 / 18400
bull case: Bulls see it as a small pullback and a sell vacuum on Friday to the big round support 18000. They want to create the same reversal as they did on 2024-04-19 with a 2% up day. The pullback in late March and April was 13 days long while we are in a 21 day long pullback. Bulls also argue that this is the first touch of the weekly 20ema since 2023-11 when we sliced through and have not touched it once since. Trends tend to test the extreme after the trend line is broken. I have absolutely no confidence in the bears to crash from here on, without at least a retest of the bull trend line at around 18300. If bears manage to close the gap to 17100, I am obviously wrong.
Invalidation is below 17550.
bear case: Big bear surprise on Thursday and Friday. The bull bar on Wednesday was strong enough in an overall max bullish market to break to the upside. They managed to break below two support trend lines. Now the important questions is, was this just a sell vacuum test to find new buyers or are we actually in a decent down turn to below 17000? No one knows. We are right an my neckline 18000 and last time we got here, we reversed up for a new ath. You simply can’t get bearish at these lows when they have been big support the last time. Could you hold onto existing shorts from above 18100 and see if we sell further to retest 17600? Absolutely. If the momentum is there again next week, that’s a reasonable target to the downside. I do think if bears can not hold it below 18160, they give up for a bigger pullback to at least 18300 and there it’s do or die for the bulls again.
Invalidation is a daily close above 18300.
outlook last week: “Still in favor of the bulls, unless bears get a strong daily close below 18400. Retest of 19000 is expected. If we can’t get it before CPI & FOMC and CPI comes in hot, I will go big on shorts for at least 18000 over the next 1-3 weeks.”
→ Last Sunday we traded 18572 and now we are at 18016. Bad bullish outlook but I gave you the clear warning that if bears would get a good daily close below 18400, I’d go big on shorts for 18000 and that’s exactly what we hit.
short term: Neutral. Please read on so you know why and how I will trade it.
So bears are in control. Below all ema and really big red bars and all red bars for 5 weeks. I’m still not shorting right at 18000. That’s insane. Can we go lower on momentum to 17600? Yes. Will I short it and call it in my tradingroom? Bet. R:R here is on the bull side if they build buying pressure and get follow through. Until all of that I am neutral.
medium-long term: 17000 over the next 3-6 Months and when we get there, I update again.
current swing trade: Caught a big swing for 300 points down to 18000 as I wrote in my last weeks outlook.
Chart update: Two paths ahead, bullish one is favored when bears step aside here at 18000 and bulls build buying pressure. If green path plays out, I expect this to be the right shoulder and that would be a decent place to sell everything (yes, your dog and granny too) to short this to freaking hell.

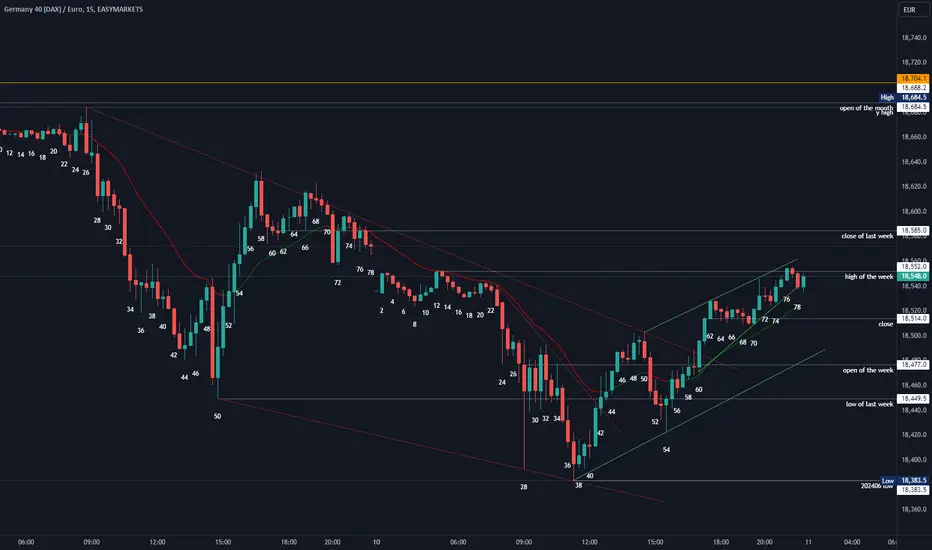
2024-06-10 - a daily price action after hour update - daxGood Evening and I hope you are well.
dax
comment: Bears managed to print a lower low below 18400 but bulls bought it as expected. The recent bear channel is broken and we are in a new bull channel. Trading range price action and you should only buy pull-backs and fade new highs or lows. US session closed it right at Globex high.
current market cycle: trading range
key levels: 18400 - 18600
bull case: Bulls kept the bullish gap on my daily chart alive and well. They are moving up to 18600 again, where I expect more sellers than buyers. If bulls manage to break above, we will get 18700 next. They are also trading above the 15m and 1h ema, so they are in full control here.
In my weekly post from yesterday I was in favor of the bulls and I hope you profited from it.
Invalidation is below 18383.
bear case: Bears tried again with a lower low but not enough bears are willing to short new lows and that’s why market is in balance and we move up and down. Bears want to keep this below 18600 or risk stronger leg to 18700. 18585 is the close of last week, which i expect will be hit.
Invalidation is above 18700ish.
short term: Bulls are moving this up again. If they can get it above 18600, I favor 18700 next. If 18600 is resistance, we will probably see 18450 or lower again.
medium-long term: My long term outlook stays bearish and I expect at least a -20% correction in 2024. Medium term is 17100 while I think we can touch the big bull trend line starting 2022-10 around 16700 in 2024. —unchanged
current swing trade: None
trade of the day: Long the double bottom bar 28 + 37 on a stop one tick above bar 37, was good for 70 points. Bar 54 + 55 were also strong enough bars to consider new longs, if you covered before.
TIME TO SELL NASDAQ TIME TO SELL NASDAQ
Price finally reached weekly bearish selling zone (Akka in Spanish "area de ventas").
I expect a strong sell towards SMA 30 @ W1 changing weekly tendency from strong bullish into strong bearish.
TP areas will be triangle cuspid and 50-61.8%

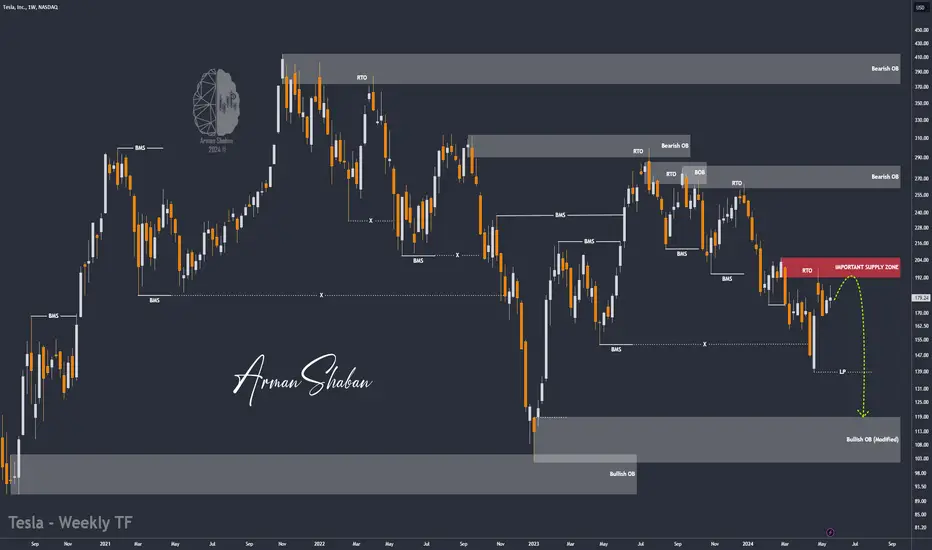
🔴 TSLA : BIG Fall Ahead ? (READ THE CAPTION)By diving into the #Tesla stock chart, we can observe that the price has reached a critical supply zone. The pattern emerging on the chart suggests that a significant downturn in Tesla's stock could be imminent. However, keep an eye on the crucial resistance at $199—if the price breaks and holds above this level, it would invalidate this bearish outlook. Should the decline unfold as expected, we are looking at potential targets of $168, $139, and $119. Stay tuned for updates as the situation evolves!
Please support me with your likes and comments to motivate me to share more analysis with you and share your opinion about the possible trend of this chart with me !
Best Regards , Arman Shaban
GBPUSD - Following The Trend 📉Hello TradingView Family / Fellow Traders. This is Richard, also known as theSignalyst.
📈 GBPUSD has been overall bearish , trading within the falling channel in red.
Currently, GBPUSD is approaching the upper bound of the channel acting as a non-horizontal resistance.
Moreover, it is retesting a supply zone marked in green.
🏹 Thus, the highlighted red circle is a strong area to look for sell setups as it is the intersection of the upper red trendline and green supply zone.
📚 As per my trading style:
As #GBPUSD approaches the red circle zone, I will be looking for bearish reversal setups (like a double top pattern, trendline break , and so on...)
📚 Always follow your trading plan regarding entry, risk management, and trade management.
Good luck!
All Strategies Are Good; If Managed Properly!
~Rich

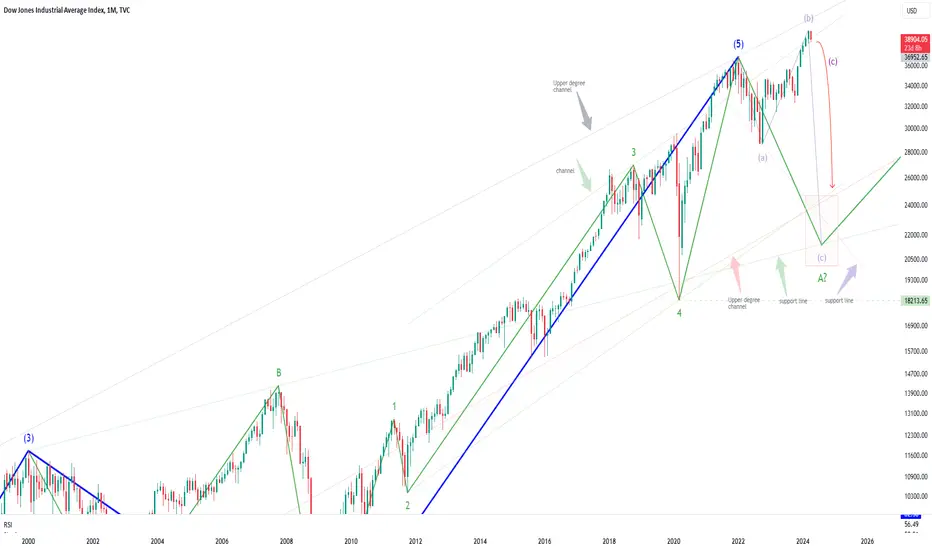
DJI, Elliott wave analysisOutlook for DJI on 1M chart.
We are probably in sub-wave (c) of wave A.
I think the sub-waves of wave A might form an expanded flat or Running flat.
If this scenario is correct, It will probably crash.
Last time my idea.
■Feb 10, 2024. middle-term analysis.
COCOA about to crashNot much of a technical analysis as we can see but there is not much we can do about it. The chart is just parabolic due to the high amount of big companies hedging against the worse-than-expected harvest. The fundamental analysis could not be much of a help either because nothing can resonate with such pricing for the cocoa. This type of trade is just speculative because it has a decent Risk-Reward.
Stops above the previous high
TP between 7,000-7,600$

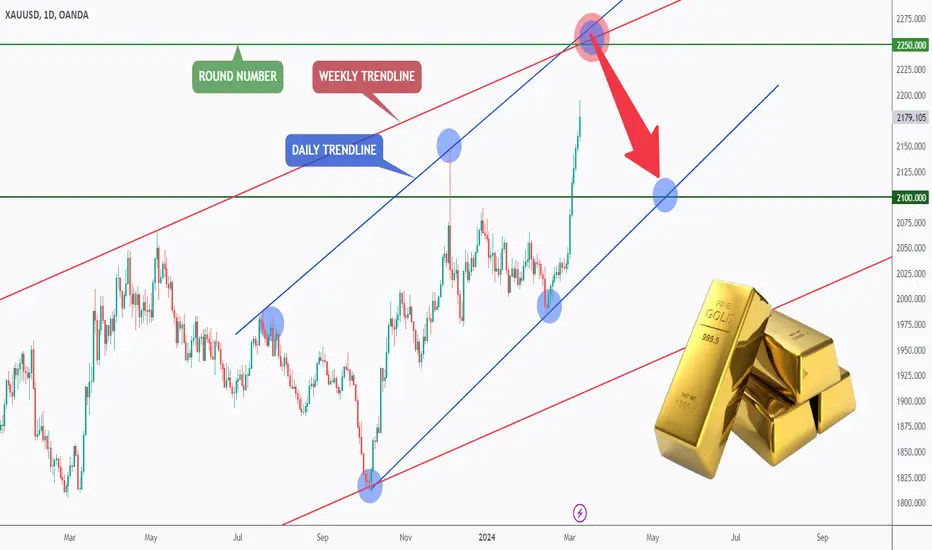
Gold will be Slave or Master❗️Hello TradingView Family / Fellow Traders. This is Richard, also known as theSignalyst.
📈 After breaking above the $2100 resistance, XAUUSD surged by 5%.
How high can Gold climb?
The marked red circle represents a significant resistance and overbought zone as it marks the intersection of:
1- $2250 round number.
2- Upper red trendline from weekly.
3- Upper blue trendline from daily.
🏹 Thus, the highlighted blue circle denotes a robust area to anticipate a potential reversal.
And keep in mind: the bigger the impulse, the bigger the correction.
Therefore, when Gold begins to trade lower, be prepared!
📚 Always follow your trading plan regarding entry, risk management, and trade management.
Good luck!
All Strategies Are Good; If Managed Properly!
~Richard Nasr
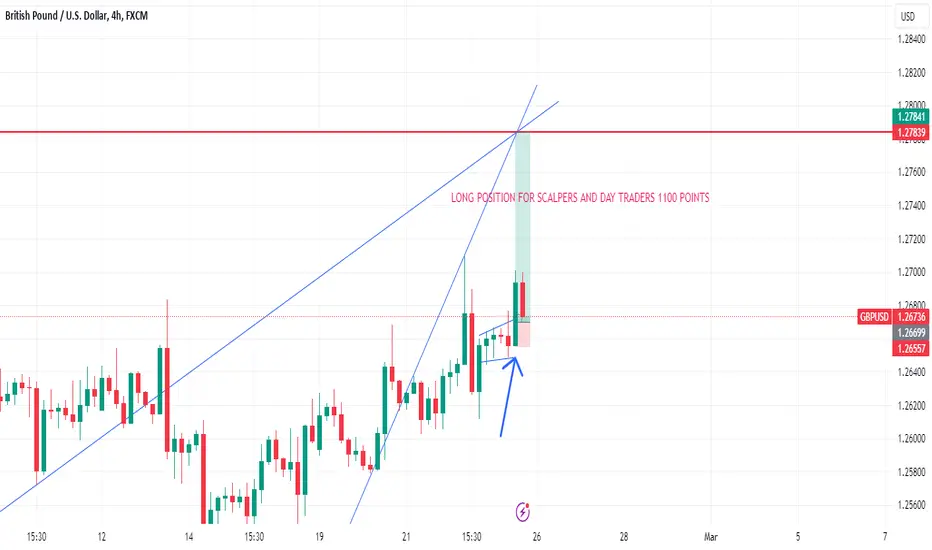
GBPUSD Long For Scalpers and Day Traders**1100 POINTS **Reason for Trade is Elliot third wave and Trendline breakout Strategy
Entry @ 1.26700
Stoploss @ 1.26500
Target @ 1.27800
Guys Please like and follows to my ideas in order to give free premium calls
Thank You
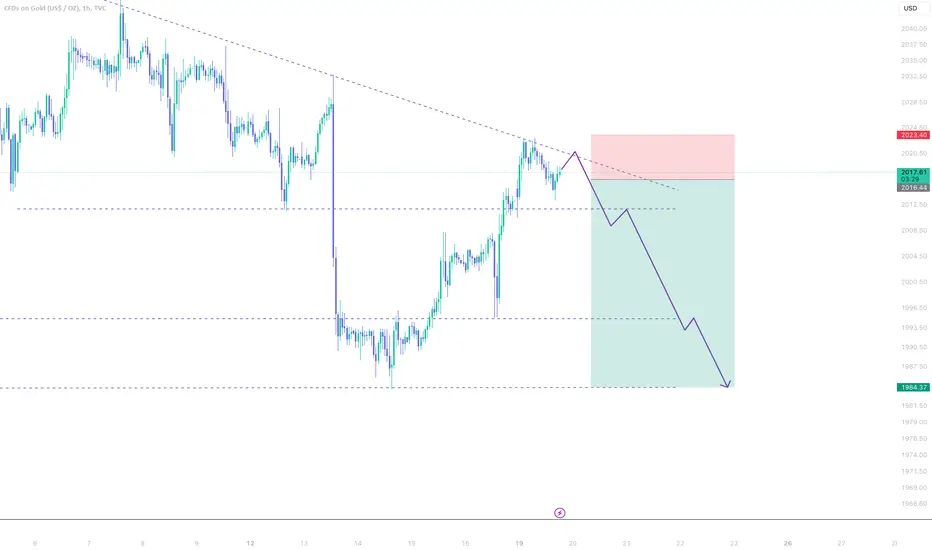
I'm bearish on GOLD#GOLD Analysis
Description
---------------------------------------------------------------
+ As you can see in the chart, GOLD price got rejected at the resistance line once.
+ Now the price is heading back to the resistance line again.
+ I'm expecting the price to get rejected again at the resistance. if the price gets rejected again then we have a good chance for a short trade.
+ I'm planning to enter the short trade after clear rejection.
---------------------------------------------------------------
VectorAlgo Trade Details
------------------------------
Entry Price: 2016.44
Stop Loss:2024.40
------------------------------
Target 1: 2011.89
Target 2:2003.57
Target 3:1995.06
Target 4: 1984.37
------------------------------
Timeframe: 1H
Capital: 1-2% of trading capital
---------------------------------------------------------------
Enhance, Trade, Grow
---------------------------------------------------------------
Agree or Disagree with the ideas ? lets discuss in the comments.
Like and follow us for more ideas.
Regards
VectorAlgo
Dow Jones Index (US30) Does the Bullish Trend Continue
Dow Jones index is trading in a strong bullish trend.
After the market set the all-time high at the end of December,
the market started to consolidate within a horizontal range.
Bullish breakout of the resistance of the range is a strong trend-following signal.
It may push the prices to 38400 level.
❤️Please, support my work with like, thank you!❤️

CRUDE OIL (WTI): Important Key Levels to Watch Next Week 🛢️
Here are the important key levels & structures to watch next week on WTI OIL.
Support 1: 69.3 - 70.4 area
Support 2: 67.7 - 68.7 area
Resistance 1: 75.2 - 76.2 area
Resistance 2: 78.5 - 79.7 area
Consider these structures for pullback/breakout trading.
❤️Please, support my work with like, thank you!❤️

Crude Oil (#WTI): Detailed Structure Analysis 🛢️
Please, check the important key levels on ⚠️WTI Crude Oil.
Support 1: 69.3 - 70.4 area
Support 2: 67.7 - 68.7 area
Resistance 1: 75.2 - 76.2 area
Resistance 2: 78.5 - 79.7 area
Consider these structures for pullback/breakout trading.
❤️Please, support my work with like, thank you!❤️

Gold's Maintenance of Record Levels - Following Trend - TADear Esteemed Members,
Gold holds record levels, as the price is above its moving averages and the upper Bollinger band, indicating a strong bullish trend and a high volatility. The price could update the previous high in a wave y, and reach $2100 soon. RSI, stochastic, and OBV, to confirm the validity and strength of the trend.
Kind Regards,
Ely

GOLD (XAUUSD): Detailed Technical Outlook & Bearish Forecast
Multiple time frame analysis for Gold.
Price action & candlestick analysis.
Structure analysis.
Bearish outlook explained.
❤️Please, support this video with like and comment!❤️
