UKOIL: Downtrend Bid + Retracement LongFirst off, please don't take anything I say seriously, as always this is on opinion basis. That being said, let me get into a few key points I want to make. Oil is about to go back down on the demand curve and have increased resistance, especially in indexes and/or options trading. This is mostly due to price corrections and a result of the sentiment going on from people reacting to the Covid19 pandemic. The demand curve going down = oil going down = price corrections as a result of impacted news. It is that simple, and this is why I predict a small imminent bearish period for UKOIL, but a huge upswing investment opportunity.
Cfds
Gold Neutral waiting for confirmationMy view on gold is on a neutral right now, no certain direction,

SPX500 Struggles To Overcome ResistanceThe left charts shows the daily time frame of the SPX500. We note that it is above its 20-day SMA and that the RSI is above 50. These are bullish, however, the index has struggled to overcome the 2,900 level (red shaded horizontal). The right chart shows the hourly time frame. Here, the EMAs are rolling over and looking to cross down and the RSI is threatening to move to the weaker side of 50. The market is nervous ahead of the Fed statement at 6:00 pm GMT and the press conference after. If the EMAs cross and develop angle and separation the index will be retreating from the overhead resistance.

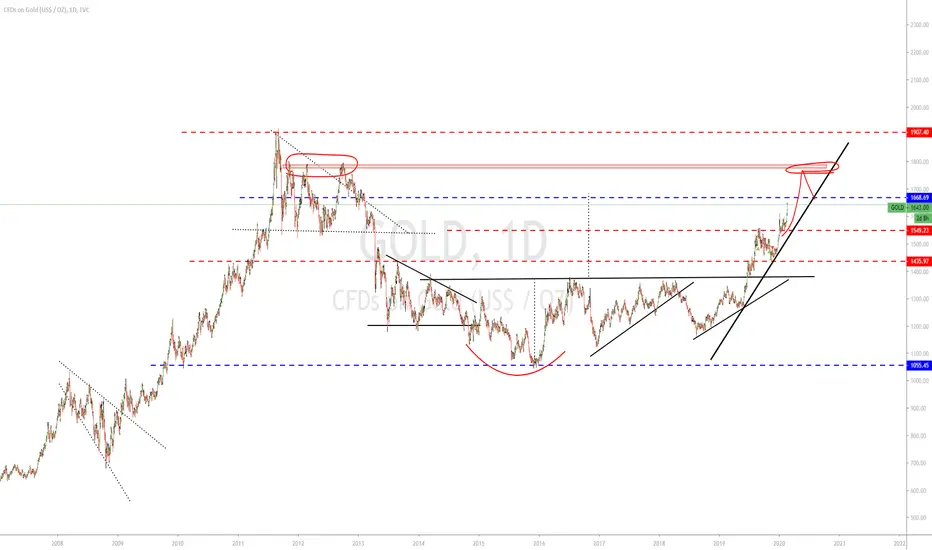
XAUUSD IDEA FOR THE FUTUREHeavy seller pressure coming in at the current level we are standing right now. All the way back to 2011'. We can clearly aim for a correction at the .618 fib. Closing some nice 700 pip move


Natural Gas | More DownsidePlease support this idea with LIKE if you find it useful.
Overall we are moving in a Descending Channel and the previous rejection can lead us to the lower boundary being retested.
On closer look we see the price is under Ichi Cloud resistance zone and 50 MA dynamic resistance. Also price producing bearish engulfings, which confirms the decline.
Thank you for reading this idea! Hope it's been useful to you and some of us will turn it into profitable.
Remember this analysis is not 100% accurate. No single analysis is. To make a decision follow your own thoughts.
The information given is not a Financial Advice.

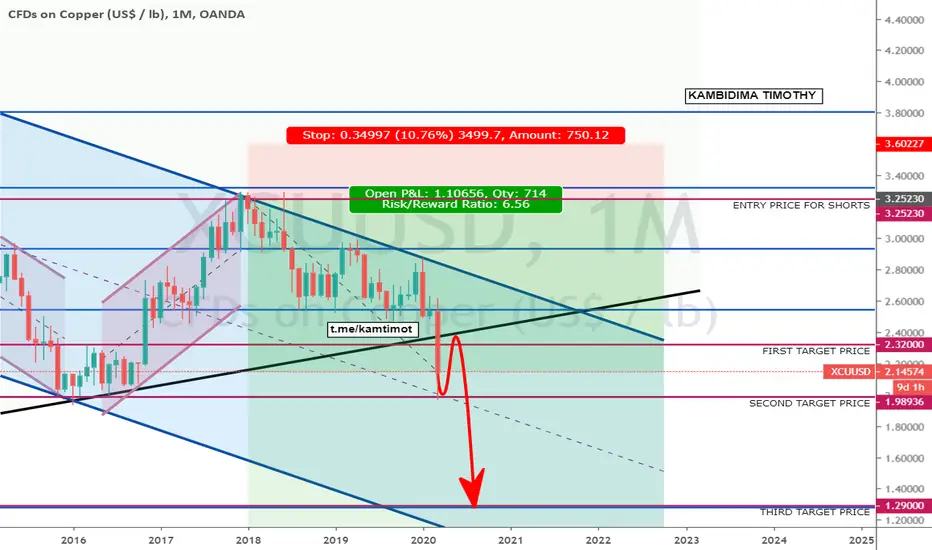
COPPER OUTLOOK - XCUUSDCopper has been trading in a bearish channel since 2011 right after bouncing off from the ascending resistance of the ultimate bullish channel. The first corrective wave in the blue bearish channel ended last year and price failed to break out to the upside.
A critical price level has been broken and this will potentially expose the copper price to a further downside. I had forecast this short setup last year and I have now updated my chart.
My first and second price target at $2.32/lb and $1.98/lb respectively were successfully achieved last week. If price breaks my 161.8% fib level, I expect price to reach my third target at $1.29/lb.

USOIL SHORT TRADEusoil trading in downtrend line
price rejected from key level and 50% fibo level around 24.00
price below SMA100
MACD shows bullish momentum weakness
RSI below 50
so its expect more selling to support level around 20.00

Oil Long Idea This week 24-28 Oil will long? What Do you think my analysis? please let me know your comments. and stay with me.
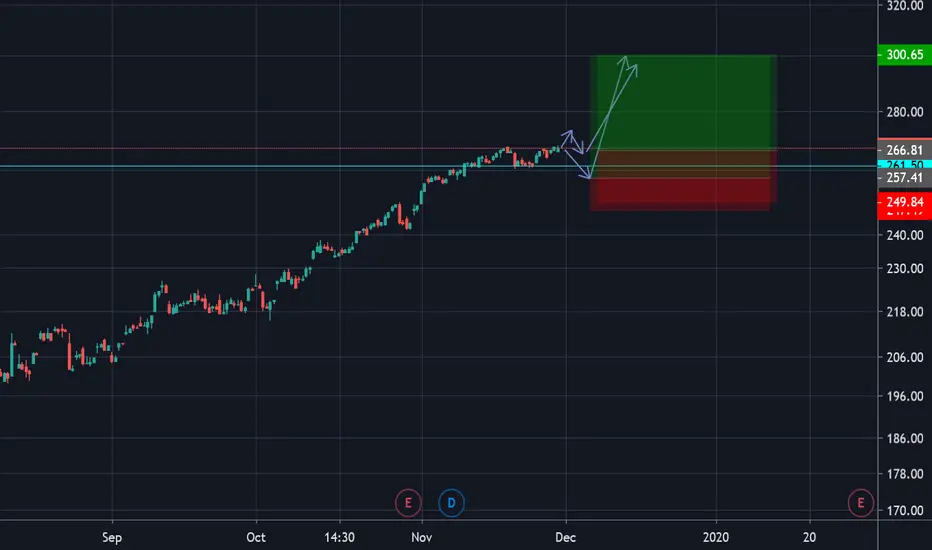
GOLD (Y20.P1.E1).Bullish momentumHi All,
The point of contention will be the level where it was rejected 3 times.
We would expect at this point a large % to sell.
Note: We will get confirmation of inverse H and S at 1668.
However it will be short lived and just like Tesla, it will spike up past this and beat the all time high.
Monthly Chart
Regards,
S.Sari
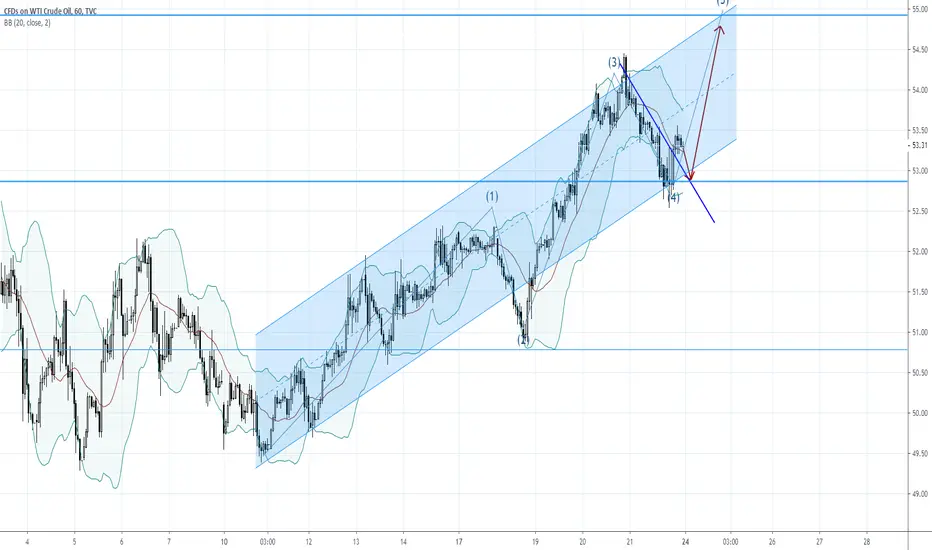
CFDs on WTI CRUDE OIL 1HHOW TO USE 200 EMA TO BUY COMMODITIES.
1 - 200 EMA standard measurement of bullish
or bearish trends in commodity market.
2 - MA breakouts have multiple false breakouts.
3 - Wait for a breakout and then a retest of EMA.
4 - Buy at breakout of high of breakout candle.
If you want to predict which commodity trading levels are worth to base your trade-off, then look no further than the 200-day moving average.
The 200-day EMA is regarded as being the standard measurement of bullish and bearish trends in the commodity market. However, a breakout of the 200-day EMA is not always a reliable signal. The reason is that like with all technical indicators it’s prone to give multiple false signals.
A simple solution to this very common problem is to wait for the breakout of the 200-day EMA and a retest.
This means that you can buy/sell commodities at the first retest of the 200-day EMA.
Now, we know that not many traders have the right amount of capital to invest in the long-term.
Holding a position for a yearlong period is not suitable for everyone.
If you don’t have a big account balance and the patience to ride the cyclical commodity trends, you’re better off if you stick with short term commodity trading

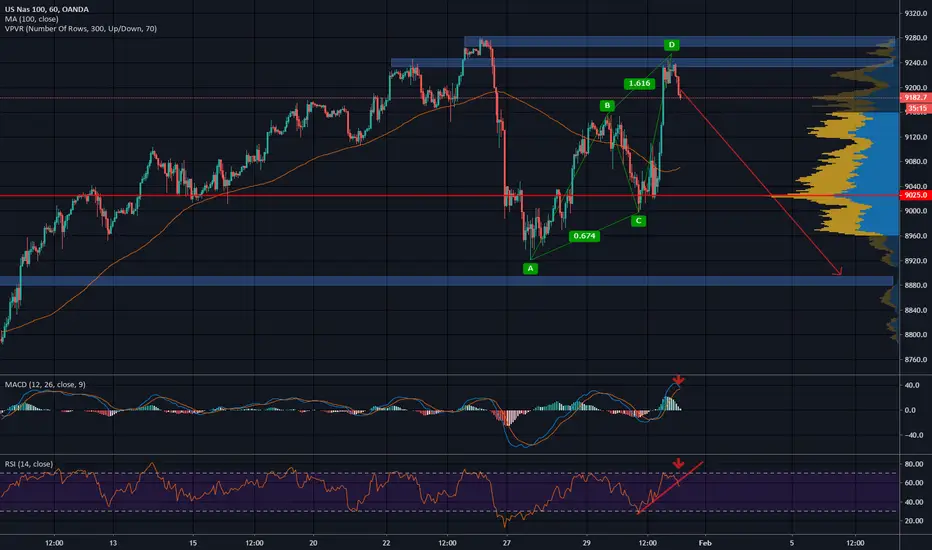
NASDAQ SHORT TRADEnasdaq rebounded from resistance zone
around 9240.0
price reached reversal AB=CD pattern target at 161.8% fibo
MACD shows bullish momentum weakness
RSI broke the uptrend line
so its expect bearish momentum to support area around 8880.0

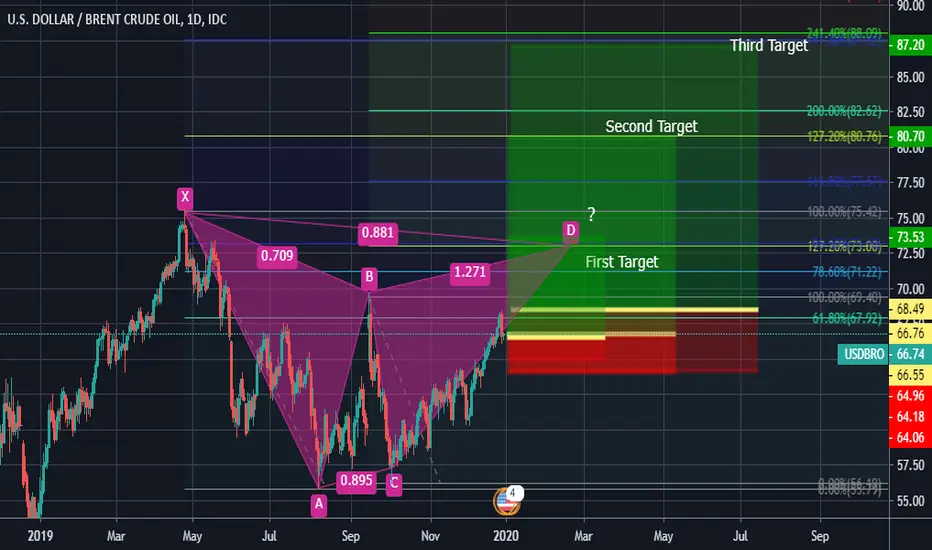
USDBRO Brent Daily Long with 3 TPs with 50 Pips Trilling SLwe believe the First TP should be Triggered in order for the harmonic pattern forms and then it should touch the Second Target for completing the second pattern and henceforth till 3 TP,
keep in mind it is a Buy order with a 50 Pips Trilling Stop loss.
there is a Buy Stop for the 3 TP with 50 pips trilling SL,
If the First TP is broken and passed the First Level we are expecting the Second Target to be our next Goal but If it could not pass the First Level and a Big Retracement happens then we have a Second Scenario and we should look for a reversal...
be careful about your Position Sizing and it should be Proportional to your Account Balance as it is a very long Time Analysis and Trade, each candle is representing a Day so it may take up to a month or more
Entry and Exit points should be considered in a Range of Pips not an exact point.
Enjoy Trading sensibly
please do n't hesitate to Ask us any questions in comments.
Good Luck


USOIL on the way to correct its entire recent upmoveUSOIL Short. This may play out over a couple of weeks
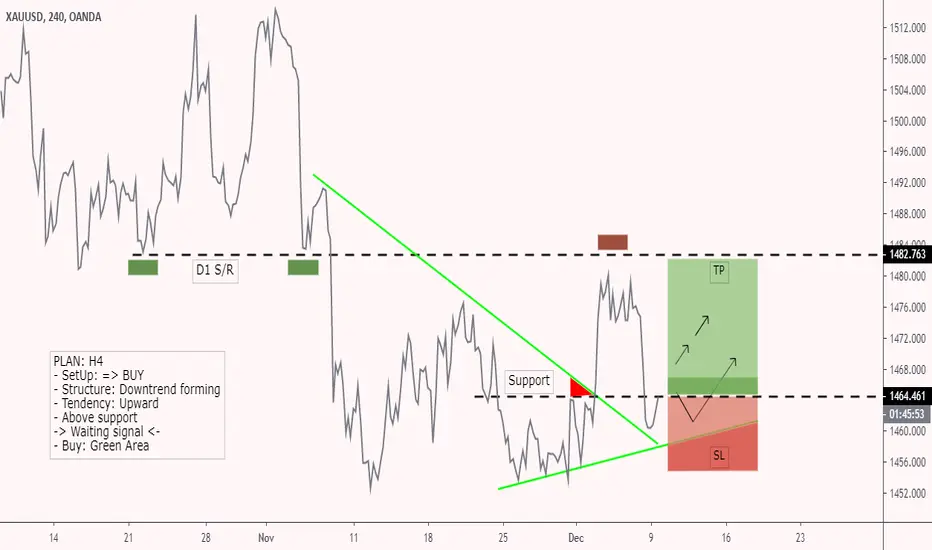
XAUUSD, Setup: BUY, TF: H4, Trendline StructureOANDA:XAUUSD
PLAN: H4
- SetUp: => BUY
- Structure: Downtrend forming
- Tendency: Upward
- Above support
-> Waiting signal <-
- Buy: Green Area
apple signals hi I would like to say in technical indicator we would most have a bulishe week for the apple as apple goes to get rally on next week i did share my own plan and we just have to wait next week for the confirmation and opening position wisely.
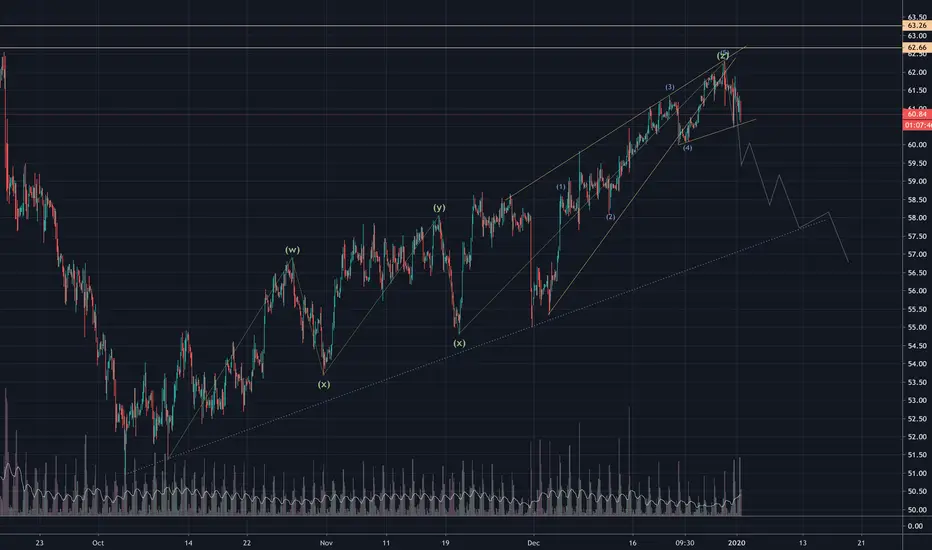
GOLD Waiting for bullish wave XAUUSD Forming Elliot wave , now waiting downtrend line breakout to confirm that wave 4 start
breakout resistance @ 1464 it means also bullish wave start
target for wave (4) is 61.8% fibo of past bearish wave @ 1490.50
Volume profile shows peak at the same level

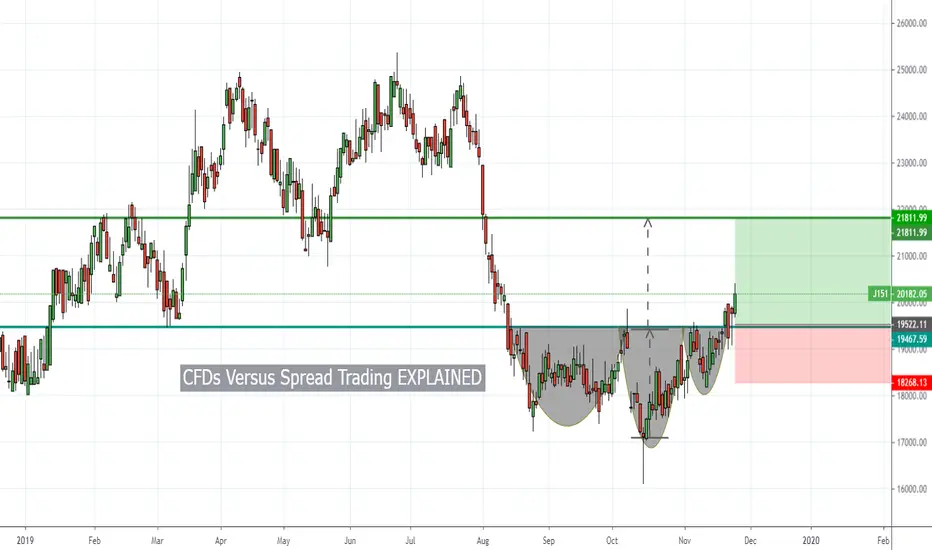
CFDs Vs Spread Trading Explained For DummiesIn this issue, we’ll discuss the differences between both CFDs and Spread Trading…
What are CFDs and Spread Trading?
Spread Trading (betting) and CFDs are financial instruments that allow us to do one thing.
To place a bet on whether a market will go up or down in price – without owning the underlying asset.
If we are correct, we stand a chance to make magnified profits and vice versa if wrong.
Both CFDs and Spread Trading, allow us to buy or sell a huge variety of markets including:
• Stocks
• Currencies
• Commodities
• Crypto-currencies and
• Indices.
When you have chosen a market to trade, there are two types of CFD or Spread Trading positions you can take.
1. You can buy (go long) a market at a lower price as you expect the price to go up where you’ll sell your position at a higher price for a profit.
2. You can sell (go short) a market at a higher price as you expect the price to go down where you’ll buy your position at a lower price for a profit.
EXPLAINED: CFDs for Dummies
DEFINITION:
A CFD is an unlisted over-the-counter financial derivative contract between two parties to exchange the price difference between the opening and closing price of the underlying asset.
Let’s break that down into an easy-to-understand definition.
EASIER DEFINITION:
A CFD (Contract For Difference) is an:
• Unlisted (You don’t trade through an exchange)
• Over The Counter (Via a private dealer or market maker)
• Financial derivative contract (Value from the underlying market)
• Between two parties (The buyer and seller) to
• Exchange the
• Price difference (Of the opening and closing price) of the
• Underlying asset (Instrument the CFD price is based on)
EASIEST DEFINITION
Essentially, you’ll enter into a CONTRACT at one price, close it at another price FOR a profit or a loss depending on the price DIFFERENCE (between your entry and exit).
Moving onto Spread Trading.
EXPLAINED: Spread Trading for Dummies
DEFINITION:
Spread Trading is a derivative method to place a trade with a chosen bet size per point on the movement of a market’s price.
EASIER DEFINITION:
Spread Trading is a:
• Derivative method (Exposed to an underlying asset) to
• Place a trade (Buy or sell) with a chosen
• Bet size per point on where you expect a
• Market price will
• Move (Up or down)
• In value
EASIEST DEFINITION:
Spread Betting allows you to place a BET size on where you expect a market to move in price.
Each point the market moves against or for you, you’ll win or lose money based on their chosen TRADING bet size (a.k.a Risk per point or cent movement).
The higher the bet size (value per point), the higher your risk and reward.
The costs you WILL pay with Spread Trading and CFDs
Both Spread Trading and CFDs are geared-based derivative financial instruments.
As their values derive from an underlying asset, when you trade using Spread Trading or CFDs, you never actually own any of the assets.
You’re just making a simple bet on whether you expect a market price to rise or fall in the future.
If you decide to go with the broker or market maker who offers CFDs or Spread Trading, there are certain costs you’ll need to pay.
Costs with Spread Trading
With Spread Trading, you’ll only have one cost to pay – which are all included in – the spread.
The spread is the price difference between the bid (buying price) and the offer (selling price).
EXAMPLE: Let’s say you enter a trade and the bid and offer prices is 5,550c – 5,610c.
The spread, in this case, is 60c (5,610c – 5,550c).
This means your trade has to move 60c to cross the spread in order for you to be in the money-making territory. Also, if the trade goes against you, the spread will also add to your losses.
Why the spread you ask?
The spread is where the brokers (market makers’) make their money.
Costs with CFDs
Brokerage
With CFDs, it can be different.
Depending on who you choose to trade CFDs with, you may need to cover both the spread as well as the brokerage fees – when you trade.
These brokerage fees can range from 0.2% - 0.60% for when you enter (leg in) and exit (leg out) a trade.
NOTE: If the minimum brokerage per trade is R100, you’ll have to pay R100 to enter your trade.
Daily Interest Finance Charge
The other (negligible) cost, you’ll need to cover is the daily financing charges.
If you buy (go long) a trade, you’ll have to pay this negligible charge (0.02% per day) to hold a trade overnight.
However, if you sell (go short) a CFD trade, you’ll then receive this negligible amount (0.009%) to hold a short trade overnight.
The costs you WON’T pay as a Spread Trader
With spread trading (betting), you don’t own anything physical.
When you take a spread bet, you’re simply making a financial bet on where you expect the price to move and nothing else.
This means, there will be no costs to pay as you would with shares including:
• NO Daily Interest Finance charges
• NO Stamp Duty costs
• NO Capital Gains Tax
• NO Securities Transfer Tax
• NO Strate
• NO VAT
• NO Brokerage (all wrapped in the spread).
The costs you WON’T pay as a CFD trader
With CFDs, you’ll notice that there are similar costs with Spread Trading that you won’t have to pay including:
• NO Stamp Duty costs
• NO Securities Transfer Tax
• NO Settlement and clearing fees
• NO VAT
• NO Strate
24-Hour Dealings
The great thing about Spread Betting or CFD trading is that, you can trade markets trade 24/5.
I’m talking about currencies, commodities and indices.
And with Crypto-currencies you can trade them 24 hours a day seven days a week.
I have left out a very important difference between CFDs and Spread Trading… Gearing and how it works in real life… We'll save that for next time.
Do you have any questions or did you find this helpful on CFDs or Spread Trading?
Let me know in the comments below...
Regards,
Timon Rossolimos
Founer, MATI Trader