GBPUSD – Is the Recovery Losing Steam? GBPUSD – Is the Recovery Losing Steam? Watch for Technical Pullback Ahead of NFP
The GBPUSD pair has recently rebounded impressively from the 1.3427 key support zone, reflecting short-term USD weakness and growing speculation of rate cuts by the Fed. However, after the strong bullish move, the market is now showing signs of exhaustion and potential profit-taking—especially with high-impact US employment data just around the corner.
🔍 Macro & Fundamental Overview:
United States: All eyes are on this week’s JOLTS and Non-Farm Payrolls (NFP) reports. Weak jobs data could strengthen the case for rate cuts by the Fed in Q3, weighing on the US Dollar. On the flip side, a solid print would revive “higher for longer” rate expectations and likely support USD strength.
United Kingdom: Although inflation remains above the Bank of England’s 2% target, political uncertainty ahead of July’s general election may keep GBP on the defensive, especially if BoE signals a dovish turn.
Bond Yield Spread (UK vs US): A widening spread in favor of the USD is exerting downward pressure on GBPUSD in the medium term.
📈 Technical Outlook (H1 Chart):
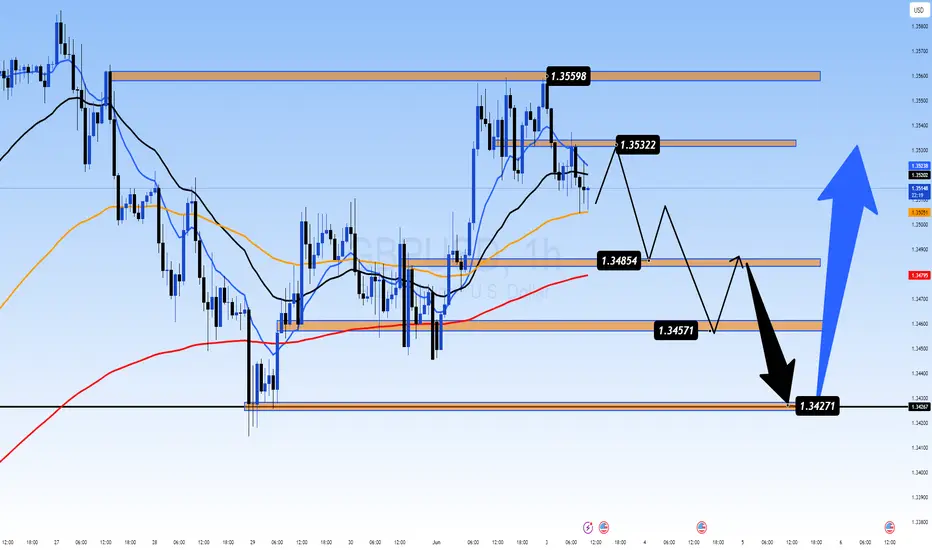
Structure: Price has formed a double-top pattern at 1.35598 and 1.35322, with multiple rejections—signaling a weakening bullish momentum after a sustained rally.
EMA 13 – 34 – 89 – 200 Setup: Price is currently testing the EMA89 zone (~1.34854). A clean break below this moving average could accelerate the downside correction.
FVG Zone (Liquidity Pool): The 1.3427 – 1.3457 area offers a potential liquidity sweep and may serve as a springboard for the next bullish leg.
📊 Trade Scenarios:
🔻 Short-Term SELL SCALP:
Entry: 1.3532 – 1.3545
Stop Loss: 1.3565
Take Profit: 1.3485 → 1.3457 → 1.3427
→ Ideal if price fails to hold above recent highs and forms bearish rejection candles.
🔵 BUY ZONE Setup:
Entry: 1.3427 – 1.3440
Stop Loss: 1.3400
Take Profit: 1.3475 → 1.3505 → 1.3535 → 1.3555
→ High-probability entry if price reacts positively to the FVG zone and maintains bullish structure.
📌 Final Thoughts:
GBPUSD is currently in a delicate zone where both technical and macro forces are converging. While the broader trend remains bullish, momentum is slowing. With critical US jobs data due, traders should stay cautious and rely on clear confirmations around key price levels. Maintain strict risk management and look for liquidity-driven moves around FVG zones.
Cfdtrading
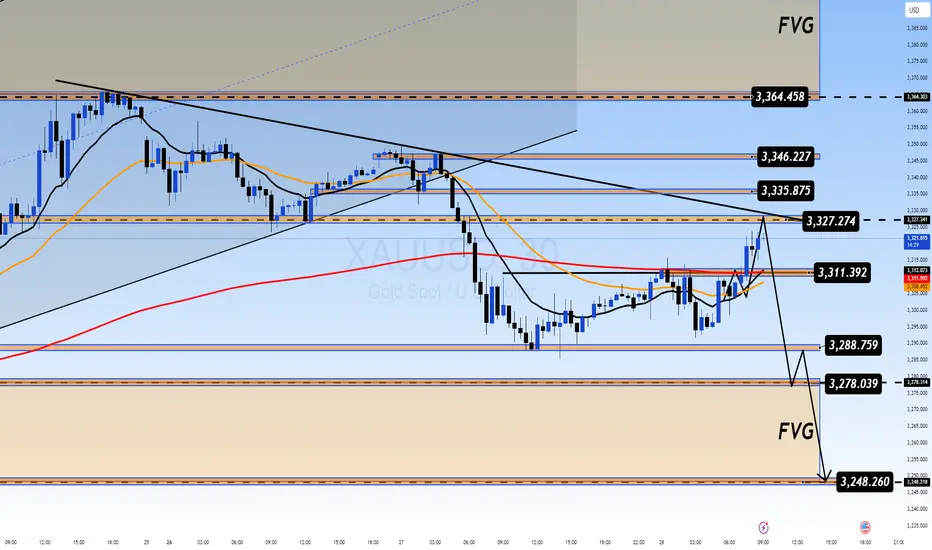
WAVE 3 PEAK OR SETUP FOR A NEW RALLY? XAUUSD PLAN – JUNE 3RD | WAVE 3 PEAK OR SETUP FOR A NEW RALLY?
After a massive $100 rally at the start of the week, gold has begun to pull back — dropping over $30 during the Asia session today. This is likely the end of Wave 3 (the strongest impulse in a 5-wave Elliott structure), as investors lock in profits and await key macro events.
🌍 MACRO & FUNDAMENTAL CONTEXT
A high-stakes call between Trump and Xi Jinping is expected this week, which could reshape short-term trade sentiment.
Investors are moving into cash positions, taking profits after Monday’s surge, and waiting for direction from the upcoming US-China negotiations.
Macro themes remain supportive for volatility: tariff risks, inflation worries, and geopolitical uncertainty.
📉 TECHNICAL OUTLOOK – H2 / H4 / D1
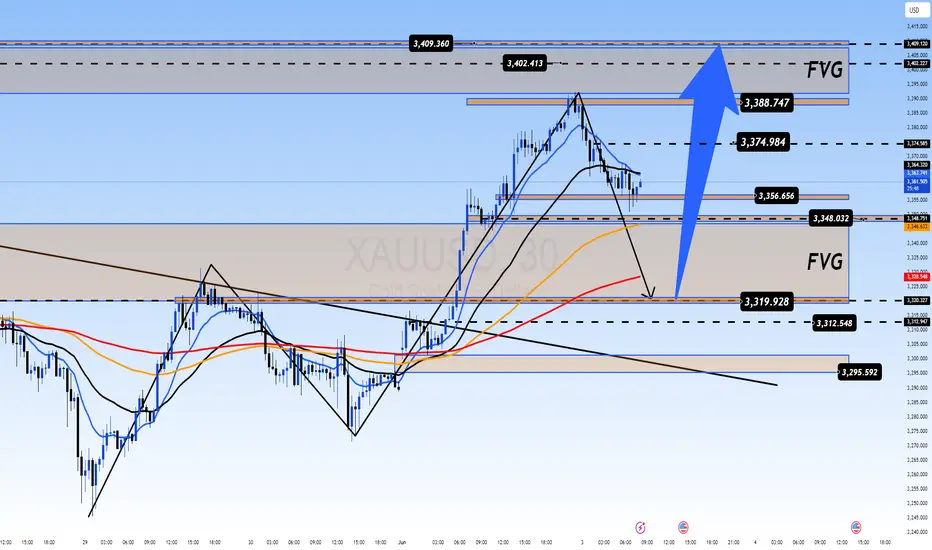
On the higher timeframes (H4 and D1), gold maintains a bullish structure, with EMAs aligned for upside continuation.
On intraday charts (M30–H1), we’re seeing a clean correction, likely to fill the Fair Value Gap (FVG) zone below.
The key BUY zone at 3320–3310 will decide direction:
If it holds: strong long setups.
If it breaks: possible structure shift and deeper downside.
🔑 KEY LEVELS TO WATCH
🟢 BUY ZONE: 3320 – 3318
SL: 3314
TP: 3324 → 3328 → 3332 → 3336 → 3340 → 3344 → 3350 → 3360 → ???
🔴 SELL ZONE: 3388 – 3390
SL: 3394
TP: 3384 → 3380 → 3376 → 3370 → 3366 → 3360 → 3350
📌 FINAL THOUGHTS
“Gold is in a healthy correction after a massive surge. The 3310–3320 zone is crucial. Hold it, and bulls may take over again — break it, and we may see a deeper pullback."
⚠️ Stay cautious ahead of political headlines. Any remarks from the Trump–Xi call could spark aggressive price action.
Will the Dollar’s Drop Fuel More Gold Upside After Weak PCE DXY OUTLOOK – Will the Dollar’s Drop Fuel More Gold Upside After Weak PCE and Trade Tensions?
📉 TECHNICAL STRUCTURE – DXY CONTINUES TO WEAKEN
The US Dollar Index (DXY) has failed to hold the 99.20–99.30 support zone and continues to respect its bearish structure on the H2 chart. The sharp sell-off at the end of May was a direct response to weaker-than-expected PCE inflation data, combined with growing political uncertainty surrounding US–China and US–EU trade negotiations.
🔻 Key Resistance Levels: 99.234 – 99.618
🔻 Key Support Zone: 98.030 – A clean break below this may open the door toward 97.50
🌍 MACRO CONTEXT – USD UNDER PRESSURE ON MULTIPLE FRONTS
Trump’s tariff decisions remain unclear. While some deadlines were delayed (e.g., steel tariffs on the EU), no substantial agreements have been reached.
Core PCE inflation – the Fed’s preferred gauge – continues to ease, reducing expectations of further rate hikes in the short term.
Institutional flows are shifting toward safe havens like gold, especially as uncertainty clouds the outlook for both US fiscal and trade policy.
📊 IMPACT ON XAUUSD – DOLLAR DROP GIVES GOLD ROOM TO RALLY
Gold remains supported by:
A weakening DXY trend
A bullish structure on H1 with EMA 13–34–89–200 alignment in favor of upside
Strong safe-haven demand heading into a new month with fresh capital inflows
If DXY breaks below 98.70 and slides toward 98.030, gold could extend its rally toward key resistance zones at 3348 – 3361.
🎯 TRADING STRATEGY (Based on DXY Bearish Continuation):
Prioritize buy setups on XAUUSD if DXY fails to reclaim the 99.23 resistance
Watch for a potential DXY pullback to resistance – if rejected, this would confirm momentum for gold to climb further
📌 NOTE: Traders should stay alert to any major news from the Fed or new developments in US–China–EU trade talks. While the current DXY structure favors continued downside, short-term pullbacks can provide gold with consolidation before another leg higher.

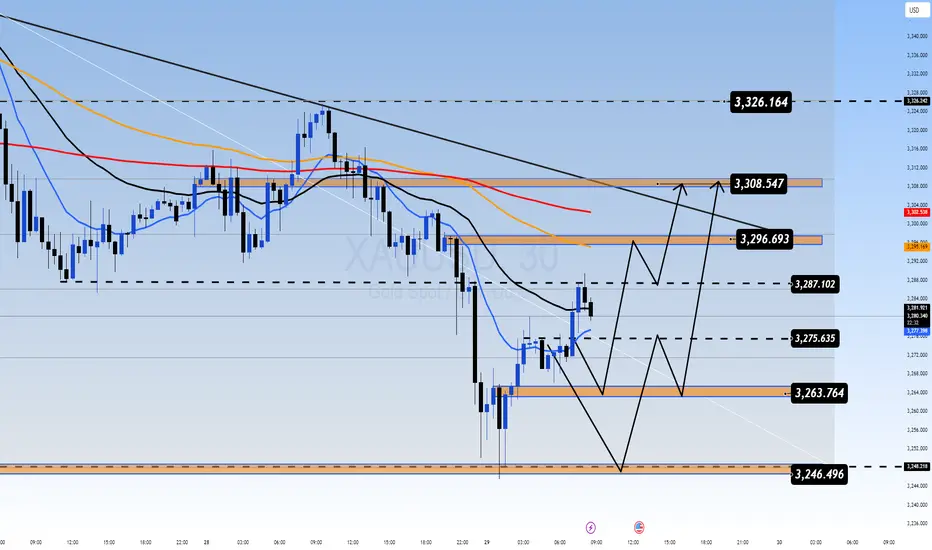
Gold Drops $30 in Asia as Month-End Profit Taking Hits Hard XAUUSD PLAN – Gold Drops $30 in Asia as Month-End Profit Taking Hits Hard
After a sharp rebound candle yesterday, gold unexpectedly reversed in the Asian session, plunging over $30 as market participants rushed to exit positions ahead of the monthly close. The move reflects strong technical rejection and potential macro pressure.
🌐 MACRO OUTLOOK – US-CHINA TRADE TENSIONS BACK IN FOCUS
Trade negotiations between the US and China are showing renewed signs of strain, especially around tariff policies.
The uncertainty has not triggered safe-haven flows into gold—a sign of waning momentum.
Dollar Index (DXY) remains range-bound, offering no clear direction.
Broad market sentiment indicates institutional cash-out behavior ahead of the weekly and monthly candle closes.
📉 TECHNICAL OUTLOOK – BEARISH STRUCTURE STILL INTACT
Gold is respecting a downward sloping channel on the H1 timeframe.
Price failed to hold above EMA 200, reinforcing bearish bias.
EMA 13 – 34 – 89 – 200 are in bearish alignment, showing continued downside momentum.
Support at 3274 – 3276 is a key reaction zone for potential scalping opportunities.
🔑 KEY PRICE LEVELS TO WATCH
🔴 SELL ZONE: 3322 – 3324
Stop-Loss: 3328
Take-Profit: 3318 → 3314 → 3310 → 3306 → 3300 → 3295 → 3290 → 3280
🟢 BUY ZONE: 3266 – 3264
Stop-Loss: 3260
Take-Profit: 3270 → 3274 → 3278 → 3282 → 3286 → 3290 → 3300
⚡ BONUS SCALP SETUPS
Support Zone 3274 – 3276 → Look for bullish rejection for a quick BUY SCALP (Target: 50 pips / SL: 50 pips)
Resistance Zones 3302 – 3304 and 3310 → Watch for early rejection to enter SELL SCALP, with extended downside targets.
📌 STRATEGY NOTES
Priority: Short-term sell bias unless price reclaims 3310 with momentum.
Avoid trading in the mid-range; wait for price to reach key reaction zones.
Today’s structure favors liquidity sweeps, so patience and disciplined entries are crucial—especially during London and NY overlap.

Recovery or Just a Bull Trap? All Eyes on PCE This WeekNZDUSD – Recovery or Just a Bull Trap? All Eyes on PCE This Week
🌐 MACRO & FUNDAMENTAL OVERVIEW
After the FOMC’s decision to keep interest rates unchanged, the US Dollar has shown signs of recovery driven by expectations that core inflation remains persistent — especially ahead of the upcoming US Core PCE Price Index release this Friday.
On the New Zealand side, the Kiwi remains under pressure due to recent weak economic data and negative sentiment from China — its largest trading partner. The RBNZ continues to maintain a neutral stance, offering little support for the currency in the near term.
Market sentiment remains cautious as investors await the PCE data to determine inflation trends and potential Fed policy shifts.
📉 TECHNICAL ANALYSIS (H1–H2 TIMEFRAME)
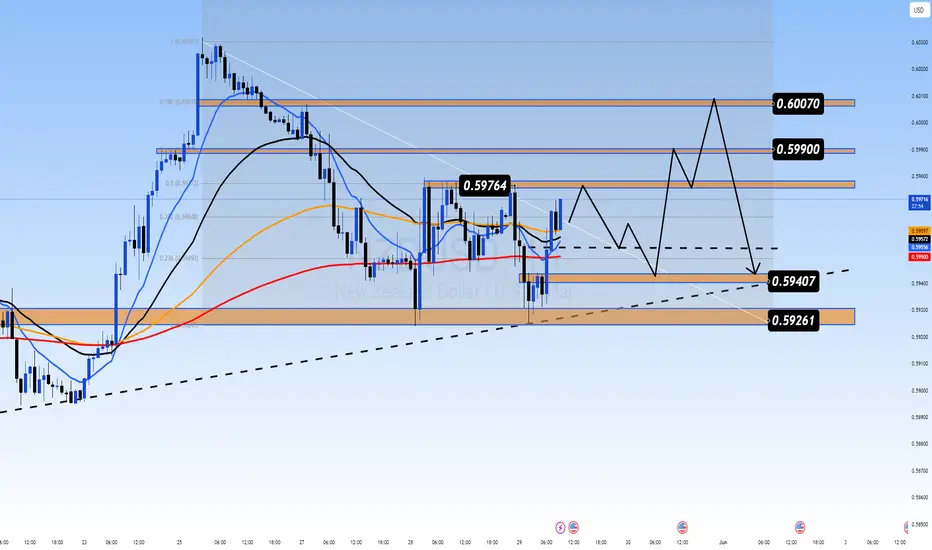
NZDUSD is forming a technical rebound after a strong bearish leg from the 0.60300 region. Current price is trading around the 38.2%–50% Fibonacci retracement zone (0.5964–0.5976), struggling to break above EMA89 and EMA200 resistance.
Overall structure: Bearish bias remains intact with lower highs.
EMA alignment: EMA13, EMA34, and EMA89 are in bearish formation.
Key support zone: 0.5926–0.5940, trendline confluence + consolidation base.
🔑 KEY LEVELS TO WATCH
Resistance:
0.5976 – Fibonacci 0.5 retracement + previous rejection zone
0.5990 – Structural resistance of the week
0.6007 – 78.6% Fib + liquidity sweep potential
Support:
0.5940 – Trendline retest + short-term structure
0.5926 – Key demand zone with previous fake breakout
🎯 TRADE IDEAS
SELL SETUP – Fade the pullback into resistance:
Entry: 0.5976 – 0.5990
Stop Loss: 0.6010
Take Profit: 0.5940 → 0.5926
BUY SCALP – On strong bullish rejection from support:
Entry: 0.5926 – 0.5930
Stop Loss: 0.5900
Take Profit: 0.5960 → 0.5976
Note: Confirm with bullish candlestick and volume spike before entry.
⚠️ STRATEGY OUTLOOK
NZDUSD remains in a corrective phase. This week’s PCE inflation data will be critical. A hotter-than-expected reading could strengthen the USD and push NZDUSD below 0.5926, resuming the medium-term downtrend.
Avoid chasing mid-range price action. Focus on price reactions near the key resistance and support levels.
EURUSD PLAN – Is the Rebound Just a Pause Before the Drop? EURUSD PLAN – Is the Rebound Just a Pause Before the Drop? | All Eyes on PCE
📊 MACRO OUTLOOK:
Following the latest FOMC meeting, the Fed kept interest rates unchanged, as expected, but maintained a hawkish tone. Chair Powell reiterated that inflation remains too sticky to consider rate cuts in the near term.
Markets now await this week’s US PCE data — the Fed’s preferred inflation gauge — which could provide the next major catalyst for USD strength or weakness.
On the Euro side, weak consumer confidence and tepid growth have strengthened expectations for an ECB rate cut in June. This divergence in monetary policy is weighing on the Euro, as the Dollar finds new demand amid global risk recalibration.
📉 TECHNICAL OUTLOOK (H1):
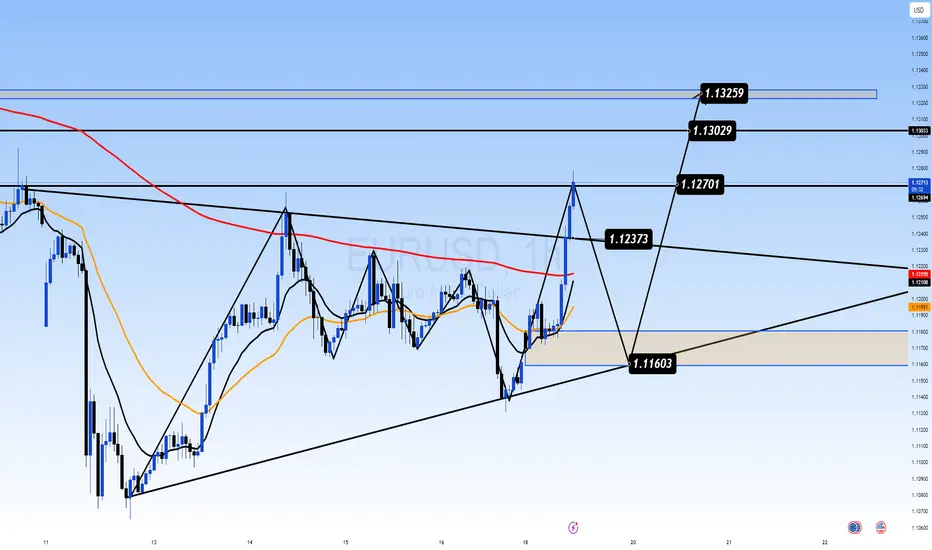
EURUSD has broken down from recent highs near 1.1412 and is now forming a bearish retracement pattern.
Price has broken below the 89-EMA and 200-EMA, signaling bearish structure.
Current price action suggests a temporary bounce from the 1.1260–1.1280 support zone (Fibo 38.2%–50%), but the broader trend remains bearish.
Fibonacci retracement from recent swing lows highlights 1.1338 and 1.1372 as key resistance levels to watch.
🔑 KEY TECHNICAL ZONES:
Resistance Zones:
• 1.1313 – Minor intraday level (Fibo 0.5)
• 1.1338 – EMA confluence + former structure
• 1.1372 – Major rejection zone (previous distribution top)
Support Zones:
• 1.1280 – 1.1260 – Current support bounce area
• 1.1220 – Key liquidity sweep zone
🧭 TRADE STRATEGY:
Scenario A – Sell the Pullback:
• Wait for a rebound into the 1.1313 – 1.1338 zone
• Enter SELL if bearish rejection forms
• SL: 1.1376
• TP: 1.1280 → 1.1260 → 1.1220
Scenario B – Invalid Breakout:
• If price breaks above 1.1372 with momentum, this plan is invalidated — wait for a confirmed breakout retest.
Scenario C – Reactive Buy Scalp:
• If price shows strong rejection from 1.1260 again, scalpers may consider a temporary BUY back toward 1.1300–1.1310
• This is high-risk and counter-trend.
⚠️ STRATEGIC NOTES:
EURUSD remains in a bearish bias until major resistance levels are broken. With PCE data approaching, volatility is likely. Trade setups should be based on confirmation signals and managed tightly as macro data can shift momentum rapidly.

XAUUSD – Post-FOMC Trading Plan | Key Resistance: 3308 – 3310XAUUSD – Post-FOMC Trading Plan | Key Resistance: 3308 – 3310
📊 MACRO UPDATE – After the FOMC Decision:
The Fed kept interest rates unchanged as expected, but the tone remained hawkish. Chairman Powell reiterated that inflation remains too high and ruled out any near-term rate cuts, signaling prolonged restrictive policy.
This led to a swift rebound in the US Dollar and Treasury yields, weighing on gold. However, XAUUSD bounced back late in the session, suggesting the market is re-evaluating key technical zones post-announcement.
📉 TECHNICAL ANALYSIS – H1/H4 Chart Structure:
Gold remains in a corrective descending structure but is now reacting around key Fibonacci levels. The 13–34–89 EMAs provide dynamic support and resistance, and a potential double bottom has formed near the 3245–3247 zone.
🧠 Two key levels to watch:
3308–3310: major resistance with trendline + FVG confluence
3245–3247: strong horizontal support + Fib 0.618 retracement
🎯 TRADE SETUPS:
🔵 BUY ZONE: 3247 – 3245
Stop-Loss: 3241
Take-Profit: 3251 → 3255 → 3260 → 3264 → 3270 → 3275 → 3280
🔵 BUY SCALP: 3263 – 3261
Stop-Loss: 3257
Take-Profit: 3266 → 3270 → 3275 → 3280 → 3290 → 3300
🔴 SELL SCALP: 3294 – 3296
Stop-Loss: 3300
Take-Profit: 3290 → 3286 → 3282 → 3278 → 3274 → 3270 → 3260
🔴 SELL ZONE: 3308 – 3310
Stop-Loss: 3314
Take-Profit: 3304 → 3300 → 3296 → 3292 → 3288 → 3280
📌 STRATEGIC OUTLOOK:
Unless price breaks above 3310 with strong momentum, sellers are still in control short term. Any rejection from the resistance zone could offer clean short entries. A breakout, however, would shift sentiment and expose 3340–3360 next.
Patience is key — let price react before committing to entries.
Will Gold Break Through 3366 or Collapse Before NFP? XAUUSD PLAN – MAY 26 | Will Gold Break Through 3366 or Collapse Before NFP?
Gold is approaching a key resistance zone as geopolitical uncertainty and shifting Fed signals add volatility to global markets. While recent bullish momentum has been strong, traders should prepare for potential shakeouts ahead of NFP week.
🌍 MACRO & FUNDAMENTAL CONTEXT
US–Iran Tensions on the Rise: Iran has warned the US it will bear full responsibility if Israel attacks its nuclear facilities. This comes just days before both sides are scheduled to resume nuclear negotiations, increasing the risk of escalation.
Goldman Sachs Signals a Safe-Haven Shift: With 20-year US bond auctions failing and yields surging, Goldman Sachs now recommends gold and Bitcoin as core hedge assets against fiscal instability and a weakening dollar.
DXY Losing Steam: The US Dollar Index is cooling off after a short-term rally, with Fed rate hike expectations becoming less certain.
📉 TECHNICAL ANALYSIS – XAUUSD (M30 – H1)
Gold is consolidating in a bullish structure, bouncing within a rising channel and showing signs of potential continuation.
EMA13/EMA34 have crossed above EMA200 on the M30 chart → a sign of trend strength building.
A large Fair Value Gap (FVG) remains unfilled near 3360–3395 → potential magnet zone if bullish breakout succeeds.
🎯 TRADE SETUPS FOR TODAY
🟢 BUY SCALP
Entry: 3304 – 3302
SL: 3298
TP: 3308 → 3312 → 3316 → 3320 → 3325 → 3330 → 3340
🟢 BUY ZONE
Entry: 3276 – 3274
SL: 3270
TP: 3280 → 3284 → 3288 → 3292 → 3296 → 3300
🔴 SELL SCALP
Entry: 3344 – 3346
SL: 3350
TP: 3340 → 3336 → 3332 → 3328 → 3324 → 3320
🔴 SELL ZONE
Entry: 3376 – 3378
SL: 3382
TP: 3372 → 3368 → 3364 → 3360 → 3350
🧩 STRATEGIC KEYLEVELS
Key SELL Zone: 3358–3360 → If broken, gold may rush toward ATH targets.
Key BUY Zone: 3276–3274 → If lost, a deep retracement below 3200 is likely.
⚠️ NOTES TO TRADERS
This is a geo-politically sensitive market. Sudden news or tweets can trigger explosive moves.
Always wait for confirmation near key zones. Don't chase breakouts without structure.
Risk management is critical.
✅ SUMMARY:
"Political risk is the fuel. Gold is the fire. Stay sharp around the key levels and don't get caught in false breakouts. Be reactive, not predictive."
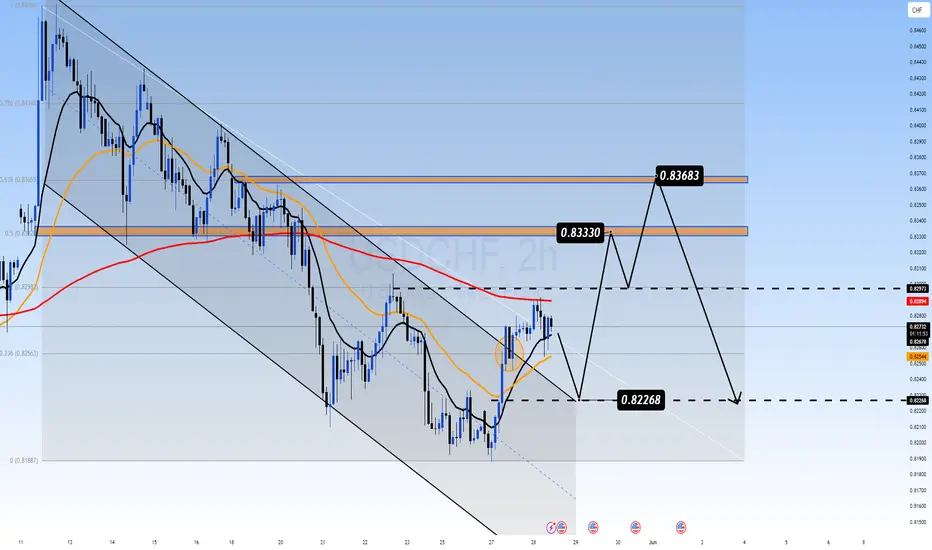
USDCHF – Awaiting Breakout Ahead of FOMC: Key Levels in Focus USDCHF – Awaiting Breakout Ahead of FOMC: Key Levels in Focus
📌 MARKET OVERVIEW
USDCHF is currently consolidating within a tight range after a technical rebound from the 0.8226 support zone. The price is testing a confluence area at the descending trendline and the 200 EMA on the H2 chart, indicating indecision between bulls and bears as we head into the high-impact FOMC event.
🔍 TECHNICAL ANALYSIS – H2 CHART
Overall Trend: Sideways corrective move within a broader downtrend channel. Price is approaching critical resistance at the EMA200 and the channel’s upper boundary.
EMAs in focus: EMA13 (black), EMA34 (orange), EMA89 (red).
Fibonacci Retracement: Price is hovering around the 0.5 fib zone (0.8298), a neutral level for potential reaction.
🎯 Key Levels & Trade Scenarios:
Major Resistance Zone: 0.8330 – 0.8368 → aligned with the 0.618 Fibonacci retracement and previous structural high.
Key Support Zone: 0.8226 → strong demand area. A break below this could expose deeper downside or set up a false break trap.
📌 Most Likely Path:
Price could dip back to 0.8226 before launching a bullish recovery targeting 0.8330 – 0.8368.
A clean breakout above 0.8368 with momentum and volume could invalidate the bearish bias and shift the trend mid-term.
🌍 MACRO & FUNDAMENTAL CONTEXT
FOMC IN FOCUS: The Federal Reserve is expected to hold rates steady at the upcoming meeting. However, market attention will be on Powell’s tone. A hawkish stance could fuel further USD strength, propelling USDCHF toward resistance zones.
SNB (Swiss National Bank) maintains a neutral tone with slight disinflationary concerns, offering limited support for the CHF and strengthening the USDCHF upside case.
US Treasury Yields are showing signs of recovery, adding bullish pressure to USD pairs.
📌 TRADING STRATEGY:
Watch for bullish reaction at 0.8226 – potential long setup if RSI divergence appears.
Short-term targets: 0.8330 → 0.8368.
Breakout Strategy: If price clears 0.8368 with conviction, shift bias to bullish continuation and monitor for FVG or trendline breakout alignment.
📣 Stay sharp for increased volatility around FOMC. Position sizing and discipline are key in macro-heavy weeks like this.
DAX: Continues higher?Huge drop on the left side which happens to reset the trend similar to NAS. Maybe DAX could continue to rally from this point forward, however, there is a huge gap that hasn't been filled yet.

Double Top Alert: Key Resistance at 1.3570 Before US PCE DataGBPUSD PLAN – MAY 27 | Double Top Alert: Key Resistance at 1.3570 Before US PCE Data
GBPUSD is currently testing a critical resistance zone near 1.3570, forming a potential Double Top pattern. As markets await this week’s US Core PCE inflation release, the pair may be at risk of a short-term pullback.
🌍 MACRO FUNDAMENTALS
USD Rebounds Slightly ahead of April’s PCE inflation report – a key Fed inflation gauge due this Friday.
GBP Under Pressure as dovish tones from Bank of England (BoE) officials signal a potential pause in rate hikes.
UK Political Uncertainty and sluggish EU-UK trade talks continue to dampen investor confidence in the pound.
📊 TECHNICAL ANALYSIS
Price Structure: GBPUSD surged from 1.3446 support but is now facing resistance near 1.3570, where a Double Top formation is emerging.
Key Levels:
Resistance: 1.3570 – 1.3580 (previous high and psychological barrier)
Support 1: 1.3496 (confluence of EMA89 and 38.2% Fibonacci retracement)
Support 2: 1.3446
Indicators:
EMA13, EMA34 show early signs of bearish crossover on the 30-minute chart.
RSI approaches overbought territory, hinting at potential bearish divergence.
🎯 TRADE SETUP (IF PRICE REJECTS 1.3570)
🔻 SELL SETUP
Entry: 1.3570 – 1.3550
Stop-Loss: 1.3595
Take-Profit Targets:
TP1: 1.3496
TP2: 1.3446
📌 A bullish breakout only becomes valid if price closes strongly above 1.3590 on the H1 chart.
🧠 STRATEGIC NOTES
Wait for a clear reaction or bearish confirmation near 1.3570 before entering trades.
Avoid chasing trades mid-range; focus on clean breakouts or rejections.
PCE data may trigger volatility — manage risk tightly and prepare for directional momentum.
👉 What do you think of this Double Top scenario? Will GBPUSD reject or break through resistance? Drop your analysis below and follow for daily structured plans!

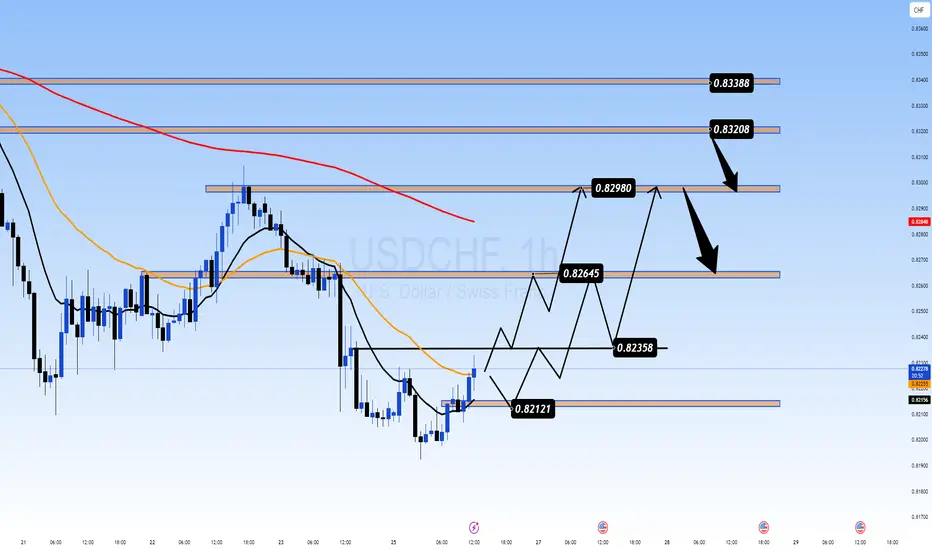
USD/CHF Trading Plan USD/CHF Trading Plan – Technical Rebound Near EMA89, Resistance Ahead at 0.8298
📌 Market Overview
USD/CHF is showing signs of technical recovery after a recent sell-off from the 0.8338 high. The current retracement is supported by price action rebounding near the 0.8212 zone — a key demand area that aligns with the EMA89 on the H1 timeframe.
However, the broader structure remains uncertain as the pair awaits directional cues from upcoming US macroeconomic data and market sentiment around the Swiss franc’s safe-haven flows.
🔍 Technical Outlook
Main trend: Still bearish on higher timeframes
Short-term bias: Technical bounce in play
EMA Setup: EMA13 and EMA34 are curling upward → but EMA89 acts as strong dynamic resistance above
🔑 Key Technical Zones:
Resistance:
0.8264 – 0.8298 → short-term resistance area
0.8320 – 0.8338 → previous supply zone and daily structure resistance
Support:
0.8235 → minor intraday support
0.8212 → EMA89 retest + breakout demand block
0.818x → historical low and deeper demand zone
📊 Trade Scenarios
✳️ Scenario 1 – SELL Setup Near Resistance
If price retests the 0.8298 zone and prints reversal signals → short the bounce
Entry: 0.8290 – 0.8298
SL: 0.8320
TP: 0.8260 → 0.8235 → 0.8210
✳️ Scenario 2 – BUY the Retest Near Support
If price pulls back to 0.8212 and holds structure with EMA89 confluence → potential short-term BUY
Entry: 0.8212 – 0.8220
SL: 0.8185
TP: 0.8235 → 0.8260 → 0.8290
⚠️ Strategy Note:
Avoid buying into resistance at 0.8298 unless there's a strong breakout with volume. Current price action favors "sell on rally" setups unless key zones break decisively.
🌐 Macro Context
Upcoming PCE Data (May 31): The US Personal Consumption Expenditures index could spark volatility. Weak data may pressure the USD and strengthen CHF.
Geopolitical Tensions Ease: Risk-off flows into CHF have cooled slightly as US-EU trade concerns subside.
SNB vs. Fed Outlook: The Swiss National Bank remains dovish, but the Fed’s uncertain tone limits USD upside. Yield differentials remain supportive for USDCHF to stay choppy within range.
✅ Final Thoughts
USDCHF is staging a mild technical rebound but still faces significant hurdles near 0.8298. Sell setups remain favorable near resistance while buy scalps are valid around EMA89 if price confirms structure.
Pullback or Deeper Reversal After False Breakout Near 1.1425? EUR/USD Weekly Plan: Pullback or Deeper Reversal After False Breakout Near 1.1425?
🧭 MARKET OVERVIEW
EUR/USD surged toward a new monthly high at 1.1425 earlier this week but quickly lost momentum and retraced to the 1.137x zone as the US Dollar bounced back. While the short-term recovery in DXY supported the dip, macro uncertainty surrounding Trump’s erratic trade policies continues to raise questions about the dollar’s long-term credibility.
Meanwhile, Germany’s revised Q1 GDP growth of 0.4% (vs. 0.2% prior) helped support EUR, reinforcing its appeal as a safe alternative to the greenback.
📊 TECHNICAL ANALYSIS (H1 Chart)
Main Trend: Short-term correction after strong bullish rally
Resistance Levels:
1.14165 → Previous top, strong reversal zone
1.14017 → Minor supply zone
Support Levels:
1.13476 → Key break structure zone
1.12791 → Daily demand zone & previous FVG bottom
Indicators:
EMA 20 & EMA 50 crossover signals weakening bullish momentum
Price Pattern: Potential double top forming below 1.1425
🌐 MACRO & FUNDAMENTAL CONTEXT
Trump’s tariff threat postponed to July 9, but his unpredictable tone weakens USD trust.
Germany Q1 GDP upgraded to 0.4% → boosts confidence in Eurozone’s economic resilience.
ECB expected to cut rates in June, with policymakers showing confidence inflation will reach 2% target this year.
This week’s key focus:
→ US PCE Price Index (April)
→ EU May HICP (CPI)
These will drive short-term volatility and determine breakout/reversal confirmation.
✅ TRADE SETUPS
🔴 SELL ZONE:
Entry: 1.1400–1.1416
SL: 1.1440
TP: 1.1382 → 1.1347 → 1.1279
🟢 BUY SCALP ZONE:
Entry: 1.1345–1.1347
SL: 1.1320
TP: 1.1382 → 1.1400
📌 Preferred scenario: Look for bearish confirmation around 1.1400–1.1416 to enter short. Avoid aggressive buys unless price strongly holds above 1.1384.
🧩 CONCLUSION
EUR/USD is showing signs of exhaustion after testing 1.1425. If bears reclaim 1.1384 and hold below 1.1347, deeper correction toward 1.1279 is likely. Conversely, if bulls defend 1.1345 and CPI/PCE data disappoints, price may retest highs.

Will It Break Through 3366 or Reversal Ahead of NFP Week? XAU/USD PLAN – 26/05 | Gold at Crossroads: Will It Break Through 3366 or Reversal Ahead of NFP Week?
Gold is currently testing a key resistance zone following a sharp rebound last week. With the Fed maintaining its hawkish stance and US-EU trade tensions on hold, the market is in a wait-and-see mode, creating an ideal environment for structured trades.
🌍 MACRO CONTEXT:
Trump Delays 50% Tariffs on the EU Until July 9: This temporarily reduced market tension, but the long-term risks remain.
US 10-Year Yields Surge Above 4.55%: Bond markets are still pricing in tighter financial conditions, supporting the USD.
The Fed Faces Operational Pressure: The Fed continues to trim its workforce by 10%, signaling internal challenges as rate hikes push up reserve interest payments.
➡️ Investors should brace for high volatility ahead of NFP week, closely monitoring any central bank statements and reactions.
🔍 TECHNICAL OUTLOOK – H1/H4 VIEW:
Gold is consolidating near the 3360-3366 region, which is a critical sell zone where price has faced resistance. The chart reveals a rising channel and clear Fair Value Gaps (FVGs) both above and below the current price, hinting at significant volatility and liquidity sweeps in the near term.
🔑 KEY LEVELS TO WATCH:
🔺 Resistance Zones:
3364 – 3366: Local top and key reversal zone, a critical point to watch for potential rejection.
3406 – 3408: The upper bound of the FVG zone, with a potential blow-off target if a breakout occurs.
🔻 Support Zones:
3324 – 3326: 20 EMA retest, a possible bullish bounce if price holds here.
3310 – 3308: Trendline + EMA89 confluence, a strong support area.
3304: A break below this level would invalidate the short-term bullish outlook.
🎯 TRADE SETUPS:
🟢 BUY SCALP:
Entry: 3326 – 3324
Stop-Loss: 3320
Take-Profit: 3330 → 3334 → 3338 → 3342 → 3346 → 3350
🟢 BUY ZONE:
Entry: 3310 – 3308
Stop-Loss: 3304
Take-Profit: 3314 → 3318 → 3322 → 3326 → 3330 → 3340
🔴 SELL SCALP:
Entry: 3364 – 3366
Stop-Loss: 3370
Take-Profit: 3360 → 3356 → 3352 → 3348 → 3344 → 3340
🔴 SELL ZONE:
Entry: 3406 – 3408
Stop-Loss: 3412
Take-Profit: 3400 → 3396 → 3392 → 3388 → 3385 → 3380
⚠️ STRATEGY RECOMMENDATION:
If price breaks above 3366 with momentum, expect a run to 3408 and potentially 3450.
If price rejects 3366 or fails to hold above 3320, look for short positions with tight stops.
📌 Final Note:
Avoid chasing price in the middle of the range. Wait for a clear rejection or breakout confirmation to enter.

XAU/USD Outlook: Will Gold Open with a Bullish Gap?XAU/USD Outlook: Will Gold Open with a Bullish Gap?
Date Range: 26th – 30th May 2025
Timeframe: H4 (4-hour chart)
Market Bias: Short-term bullish
🔍 Fundamental Analysis
US–China Trade Tensions:
China halting imports of US goods puts pressure on the dollar (gold tends to move inversely).
Escalating tensions support gold as a safe-haven asset.
Tariff Threats to the EU:
Trump proposes 50% tariffs on EU products → potential retaliatory measures raise global uncertainty.
Risk-averse sentiment may push capital into gold.
Physical Gold Demand:
High seasonal demand from India and China ahead of festivals.
Inflation fears globally increase gold's appeal.
🌍 Macro Overview
Monetary Policy:
The Fed may face pressure to cut rates if trade tensions weaken the economy → bearish for USD, bullish for gold.
PBOC could devalue the yuan in response to trade friction, boosting gold prices in USD terms.
Market Sentiment:
A potential rise in the VIX (fear index) may drive investors towards safe havens like gold.
Strong demand for physical gold and ETFs, particularly in Asia, continues to support price.
Key Events This Week:
US Core PCE (inflation indicator)
US Consumer Confidence
EU and China responses to recent US trade policy
📊 Technical Analysis (H4)
Trend: Clear ascending channel
Current Price: 3,407.554
Key Resistance Levels:
3,407 – 3,444 (major resistance zone)
3,444.436 = potential all-time high
Support Zones:
3,361.648 (channel midpoint)
3,325.347 (lower channel boundary)
Fair Value Gaps (FVG):
FVG 1: 3,361 – 3,407
FVG 2: 3,325 – 3,340
Price Action Note:
A doji candle near resistance suggests a possible short-term pullback before continuation
🔄 Possible Scenarios
🔼 Bullish Scenario (60% probability):
Break above 3,444 with momentum could trigger a bullish gap and extend toward 3,500
Strong fundamental and technical support for upside
🔽 Bearish Scenario:
Rejection from 3,444 may lead to a pullback toward 3,361 or even 3,325 for buy setups
💡 Trade Plan
✅ Long Setup:
Entry: 3,361 – 3,370 (pullback into FVG or mid-channel support)
Take Profit: 3,444 (TP1), 3,500 (TP2)
Stop Loss: Below 3,325
❌ Short Setup (only on confirmed rejection):
Entry: On clear rejection at 3,444 (e.g. bearish engulfing or head & shoulders pattern)
Take Profit: 3,361
Stop Loss: Above 3,444
⏰ Optimal Trading Times
Monitor market open (Sunday, 26th May) for confirmation of a potential bullish gap
Best liquidity during London and New York sessions
📝 Summary:
Gold is well-positioned for a bullish move amid escalating trade tensions and USD weakness.
Watch closely for a breakout above 3,444 or a retracement to 3,361 as a strategic buy zone.
Stay updated on US inflation data and trade policy developments to adjust accordingly.

BTC/USD IS A STRATEGIC CORRECTION OR A NEW RALLY AHEAD?BTC/USD 24 MAY – IS A STRATEGIC CORRECTION OR A NEW RALLY AHEAD?
🌐 MACRO & FUNDAMENTAL CONTEXT
Federal Reserve Outlook: Recent statements from Fed officials remain hawkish, signaling that interest rate cuts may not arrive soon. Inflation data remains sticky, adding pressure on risk-on assets like crypto in the short term.
Market Sentiment: Investors are cautious, with capital flowing back into safer assets amid global uncertainty. However, long-term sentiment on BTC remains strong, supported by fundamentals.
On-Chain Metrics: Wallet activity and hash rate growth continue to reflect strong underlying demand. This suggests accumulation despite short-term price pressure.
📉 TECHNICAL STRUCTURE (H1 CHART)
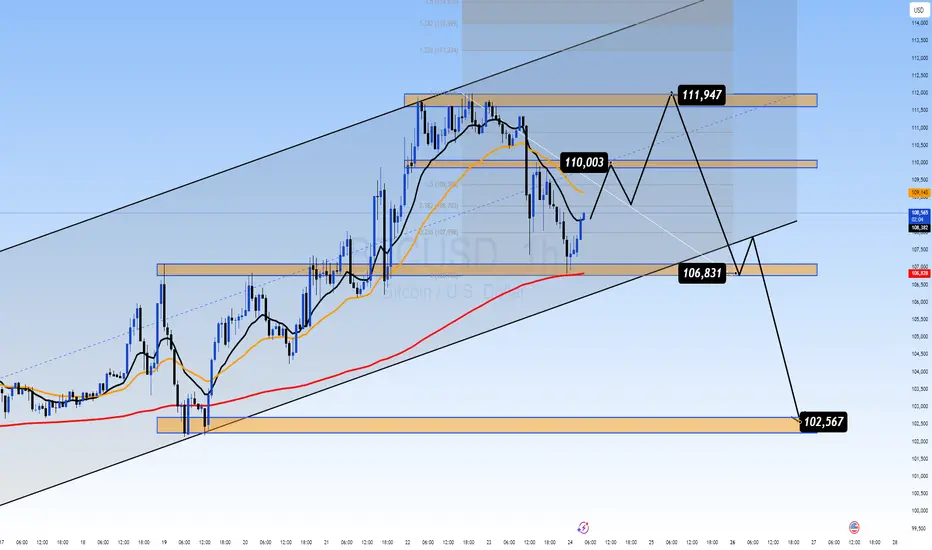
BTC/USD is currently correcting after reaching the 111,947 resistance area. Price bounced from the 106,831 support zone and is now approaching the mid-range levels again.
Chart Formation: A possible "bull trap" pattern is forming. Price may retest the 110,000 – 111,947 supply zone before deciding the next move.
EMA Signals: Short-term EMAs have crossed downward on the H1 timeframe, indicating a weakening bullish momentum.
🎯 TRADE SETUPS FOR TODAY
🔻 SCALP SELL ZONE:
Entry: 111,800 – 111,950
Stop Loss: 112,200
Targets: 110,000 → 108,500 → 106,800 → 102,567
🔺 BUY ZONE (PULLBACK SUPPORT):
Entry: 106,800 – 106,600
Stop Loss: 106,200
Targets: 107,800 → 109,000 → 110,000
🔍 TECHNICAL KEY LEVELS
Resistance Zone: 111,947 – 112,000
Support Zone: 106,831 → 106,600 → 102,567
FIBO Key Levels: 0.5 – 109,393 | 0.382 – 108,763
⚠️ STRATEGY OUTLOOK
If BTC breaks above 112,000 with strong volume, expect a bullish continuation toward 114,000+ levels.
However, if price fails to hold above 110,000 and drops below 106,800, a deeper correction to 102,500 may follow.
📌 CONCLUSION
"BTC is at a decision point, trading between macro hawkish pressure and technical liquidity zones. Stay flexible and wait for confirmation before committing heavily."
Watch the US Jobless Claims data tonight for volatility triggers.
Avoid emotional trades. Use strict risk management.
Follow this profile for more real-time plans and updates.
GOLD XAUUSD PLAN – MAY 23 IS GOLD READY TO SURGE AGAIN?GOLD XAUUSD PLAN – MAY 23 | GEOPOLITICAL RISKS FLARE UP – IS GOLD READY TO SURGE AGAIN?
🌍 MACRO CONTEXT:
Iran-Israel-US Tension: Iran has warned that if Israel attacks its nuclear facilities, the U.S. will also be held responsible. Tehran vows to take “special measures” to protect its nuclear program, and has filed formal complaints with the UN. Markets are reacting sharply to this growing geopolitical risk.
Goldman Sachs Alert: Goldman Sachs recommends gold and crypto (Bitcoin) as safe-haven assets amidst soaring bond yields, fiscal crisis fears, and a failed 20-year U.S. Treasury auction. They warn that rising yields are now posing serious threats to equities while the dollar faces longer-term pressure.
📉 TECHNICAL OUTLOOK (M30):
Price has bounced off the 3303 zone, and is showing signs of a bullish breakout if 3360 is taken out.
There is a clear Fair Value Gap (FVG) above 3360–3380, which has yet to be fully filled. Below, the untested FVG zone near 3274–3250 remains vulnerable if support fails.
EMA 13 is trending above EMA 34 and EMA 200 → bullish bias remains valid as long as 3274 holds.
🔑 KEY LEVELS TO WATCH:
SELL Side Key Level: 3358–3360 → A breakout above this zone could lead to a retest of ATH near 3400–3450.
BUY Side Key Level: 3276–3274 → Losing this zone could push gold back below 3200, targeting deeper correction levels.
📈 TRADE SETUPS:
🔵 BUY ZONE: 3276 – 3274
SL: 3270
TPs: 3280 → 3284 → 3288 → 3292 → 3296 → 3300
🔵 BUY SCALP: 3304 – 3302
SL: 3298
TPs: 3308 → 3312 → 3316 → 3320 → 3325 → 3330 → 3340
🔴 SELL ZONE: 3376 – 3378
SL: 3382
TPs: 3372 → 3368 → 3364 → 3360 → 3350
🔴 SELL SCALP: 3344 – 3346
SL: 3350
TPs: 3340 → 3336 → 3332 → 3328 → 3324 → 3320
🧠 FINAL THOUGHTS:
Gold remains highly sensitive to geopolitical headlines and macro instability. As long as the 3303 support area holds, look for bullish continuation towards FVG highs. Break below 3274 may shift the bias sharply to the downside. Stay alert — volatility is expected to rise ahead of the next U.S. data and developments in the Iran nuclear issue.GOLD XAUUSD PLAN – MAY 23 | GEOPOLITICAL RISKS FLARE UP – IS GOLD READY TO SURGE AGAIN?
🌍 MACRO CONTEXT:
Iran-Israel-US Tension: Iran has warned that if Israel attacks its nuclear facilities, the U.S. will also be held responsible. Tehran vows to take “special measures” to protect its nuclear program, and has filed formal complaints with the UN. Markets are reacting sharply to this growing geopolitical risk.
Goldman Sachs Alert: Goldman Sachs recommends gold and crypto (Bitcoin) as safe-haven assets amidst soaring bond yields, fiscal crisis fears, and a failed 20-year U.S. Treasury auction. They warn that rising yields are now posing serious threats to equities while the dollar faces longer-term pressure.
📉 TECHNICAL OUTLOOK (M30):
Price has bounced off the 3303 zone, and is showing signs of a bullish breakout if 3360 is taken out.
There is a clear Fair Value Gap (FVG) above 3360–3380, which has yet to be fully filled. Below, the untested FVG zone near 3274–3250 remains vulnerable if support fails.
EMA 13 is trending above EMA 34 and EMA 200 → bullish bias remains valid as long as 3274 holds.
🔑 KEY LEVELS TO WATCH:
SELL Side Key Level: 3358–3360 → A breakout above this zone could lead to a retest of ATH near 3400–3450.
BUY Side Key Level: 3276–3274 → Losing this zone could push gold back below 3200, targeting deeper correction levels.
📈 TRADE SETUPS:
🔵 BUY ZONE: 3276 – 3274
SL: 3270
TPs: 3280 → 3284 → 3288 → 3292 → 3296 → 3300
🔵 BUY SCALP: 3304 – 3302
SL: 3298
TPs: 3308 → 3312 → 3316 → 3320 → 3325 → 3330 → 3340
🔴 SELL ZONE: 3376 – 3378
SL: 3382
TPs: 3372 → 3368 → 3364 → 3360 → 3350
🔴 SELL SCALP: 3344 – 3346
SL: 3350
TPs: 3340 → 3336 → 3332 → 3328 → 3324 → 3320
🧠 FINAL THOUGHTS:
Gold remains highly sensitive to geopolitical headlines and macro instability. As long as the 3303 support area holds, look for bullish continuation towards FVG highs. Break below 3274 may shift the bias sharply to the downside. Stay alert — volatility is expected to rise ahead of the next U.S. data and developments in the Iran nuclear issue.
FVG LIQUIDITY & POLITICAL SHOCKS: WILL THE SELLERS STRIKE BACK?GOLD PLAN 22/05 – FVG LIQUIDITY & POLITICAL SHOCKS: WILL THE SELLERS STRIKE BACK?
🌍 Fundamental & Geopolitical Overview:
🔺 Breaking Political News:
On the night of May 21, two Israeli embassy officials were fatally shot near the Jewish Museum in Washington in what’s being labeled an anti-Semitic terrorist act.
→ Former President Trump condemned the attack, calling it “disgusting” and demanding an end to extremism.
→ Events like these typically boost gold as a safe haven, but this time the market appears hesitant.
🔺 Meanwhile, the Federal Reserve remains hawkish, signaling “higher-for-longer” interest rates.
→ This continues to support USD strength, putting downward pressure on gold.
🔍 Technical Outlook (H1):
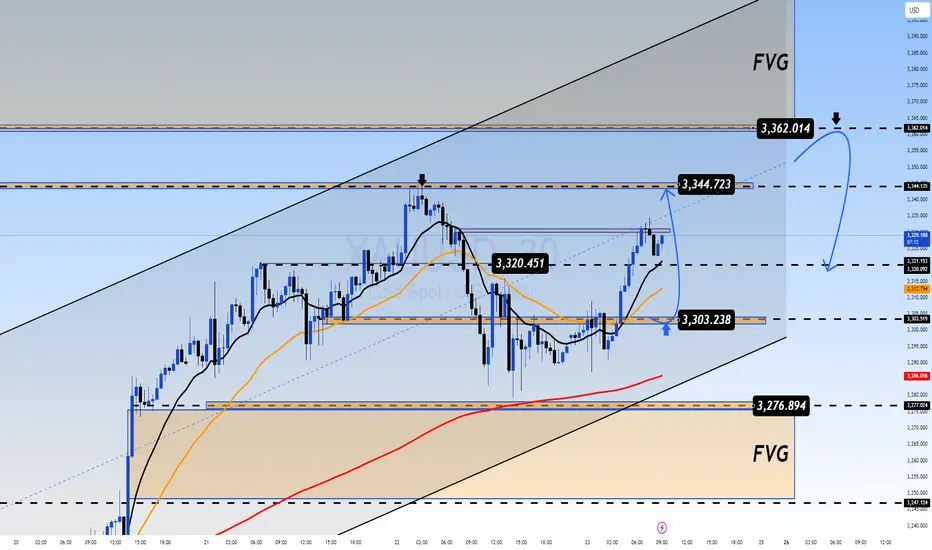
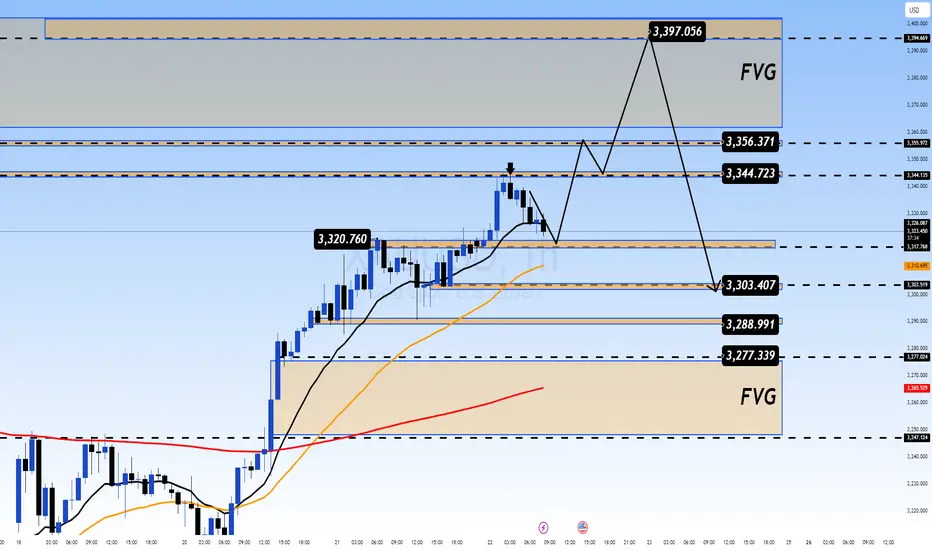
Gold (XAUUSD) recently topped around 3397, followed by a strong bearish rejection candle at that level.
Two Fair Value Gaps (FVG) are now defining market sentiment:
Upper FVG: 3330 – 3356 (partially filled)
Lower FVG: 3277 – 3247 → highly likely to be targeted if breakdown occurs.
EMA 13 & EMA 34 are flattening out, indicating consolidation within a breakout range.
🧭 Trade Strategy for Today:
🔻 PRIMARY SELL ZONE:
Entry: 3395 – 3397
Stop Loss: 3401
Take Profit: 3390 → 3386 → 3380 → 3376 → 3370
🔻 SELL SCALP:
Entry: 3358 – 3360
Stop Loss: 3364
Take Profit: 3354 → 3350 → 3346 → 3342 → 3338 → 3330
🔵 BUY ZONE:
Entry: 3296 – 3294
Stop Loss: 3290
Take Profit: 3300 → 3304 → 3308 → 3315 → 3320 → 3330 → ???
🔵 BUY SCALP:
Entry: 3316 – 3314
Stop Loss: 3310
Take Profit: 3320 → 3324 → 3328 → 3332 → 3340 → 3350
⚠️ Key Things to Watch:
FBI and White House responses to the DC shooting could ignite renewed risk-off sentiment, pushing gold higher suddenly.
A break above 3400 invalidates today’s setup – expect renewed bullish pressure if that happens.
📌 Pro Tip: Don’t chase the market. Let price come to your zones. Respect SL/TP and manage risk – especially on volatile days like today.
📣 Follow this account for live updates, scalping levels, and macro-triggered trading zones in real time!
GOLD 21/05 – FED'S HAWKISH STANCE VS. TECHNICAL LEVELSGOLD MARKET UPDATE 21/05 – FED'S HAWKISH STANCE VS. TECHNICAL LEVELS – BIG MOVE AHEAD?
Gold’s recent rally has paused as traders weigh the latest signals from the Federal Reserve. Despite geopolitical tensions and softer U.S. economic data, the Fed is sticking with a "higher-for-longer" interest rate policy, which has kept the U.S. dollar strong and put pressure on gold’s price action.
📉 However, the technical outlook suggests a different story.
⚙️ TECHNICAL ANALYSIS: Is It A Bearish Trap Or A Hidden Bullish Opportunity?
Looking at the 1H timeframe, XAU/USD is consolidating after reaching a major Fair Value Gap (FVG) between 3328–3356. This zone reveals significant volatility and potential liquidity grabs, with two key FVG zones forming above and below the current price levels.
There’s a potential bullish scenario if gold retraces to the 3250–3252 support zone, where strong trendline confluence and dynamic support are likely to drive demand.
On the flip side, any rejection from the 3354–3356 SELL ZONE could initiate a bearish trend, pushing gold lower to test key structural support levels.
💹 TRADING STRATEGY FOR TODAY:
🔵 BUY ZONE
Entry: 3252–3250
Stop Loss: 3246
Take Profit:
3256 – 3260 – 3264 – 3268 – 3272 – 3280 – 3300 – ???
🔵 BUY SCALP
Entry: 3277–3275
Stop Loss: 3272
Take Profit:
3280 – 3284 – 3288 – 3292 – 3296 – 3300
🔻 SELL ZONE
Entry: 3354–3356
Stop Loss: 3360
Take Profit:
3350 – 3346 – 3342 – 3338 – 3334 – 3330 – 3320
🔻 SELL SCALP
Entry: 3328–3330
Stop Loss: 3334
Take Profit:
3324 – 3320 – 3316 – 3310 – 3305 – 3300
🌍 MACRO INSIGHT
The Fed’s hawkish stance continues to weigh on gold, but geopolitical uncertainty and ongoing de-dollarization trends maintain gold’s appeal.
China, along with other central banks, is still actively accumulating gold, signaling that long-term bullish pressure remains intact.
Keep an eye on U.S. data this week, especially PMI and jobless claims, as these could act as short-term catalysts for gold.
📌 KEY NOTES
Volatility is increasing, so stay disciplined. Stick to your key levels and manage risk effectively. Patience and strategy will be key as the market moves in the coming days.
Stay alert and trade wisely!

USDCHF Will the Downtrend Break or Bounce? Full Trade Plan TodayUSDCHF – Will the Downtrend Break or Bounce? | Full Trade Plan Today 🔥
🌍 Macro Overview
USDCHF remains in a short-term bearish correction, reflecting current macroeconomic uncertainties surrounding US interest rate expectations and safe-haven demand for CHF.
USD is under pressure after softer-than-expected CPI and PPI data last week, increasing speculation that the Fed may cut rates in Q3.
CHF continues to benefit from its safe-haven status amid ongoing geopolitical uncertainty and fragile European growth.
However, the key support around 0.8318 has acted as a major demand zone. If bulls react strongly here, we could see a technical rebound in the short term.
📉 Technical Analysis (H1–H2)
USDCHF is trading within a descending channel, showing lower highs and lower lows.
Price is now testing the lower boundary of the channel around 0.8318, which also aligns with a key liquidity area.
EMAs (13 and 34) still slope downward, but momentum is slowing — a possible signal that sellers are losing strength.
🔑 Key Levels to Watch
🔺 Resistance Zones:
0.8395 → Recent swing high & supply zone
0.8459 → Medium-term structural resistance
🔻 Support Zones:
0.8318 → Major confluence zone (channel bottom + demand block)
0.8230 → Final support level before deeper drop
🎯 Trade Setups
✅ Scenario A – Bullish Reversal from Support (Preferred):
Entry (Buy): 0.8318 – 0.8322 (after bullish rejection confirmation)
Stop Loss: 0.8288
Take Profits: 0.8395 → 0.8430 → 0.8459
✅ Scenario B – Bearish Breakdown Below Support:
Entry (Sell): 0.8300 – 0.8310 (only if price closes below 0.8310 on H2)
Stop Loss: 0.8340
Take Profits: 0.8260 → 0.8230 → 0.8200
⚠️ What to Watch Today:
Market may see higher volatility during the US session, especially with housing data (Existing Home Sales) and Fed speakers lined up.
Watch for clean price action around 0.8318 — no need to rush entries until confirmation appears.
This is a reactive market, not a predictive one. Let price speak first.
📌 Follow for real-time market updates and actionable strategies during US trading hours.

GBP/USD Retracement or Reversal? Stay Sharp as Momentum FadesGBP/USD Trading Plan – May 20th | Retracement or Reversal? Stay Sharp as Momentum Fades
🌐 Macro Overview
GBP/USD is currently influenced by several macroeconomic forces:
USD strength is returning, supported by stable US data (Retail Sales, Jobless Claims), leading the market to delay expectations of a Fed rate cut.
The British Pound is under pressure as the Bank of England (BoE) is not expected to raise rates further amid slowing domestic growth and easing inflation.
Simultaneously, US-China trade tensions and US debt concerns are keeping market sentiment cautious. The pair is forming a bullish flag structure, but signs of exhaustion are emerging.
📉 Technical Analysis (2H Chart)
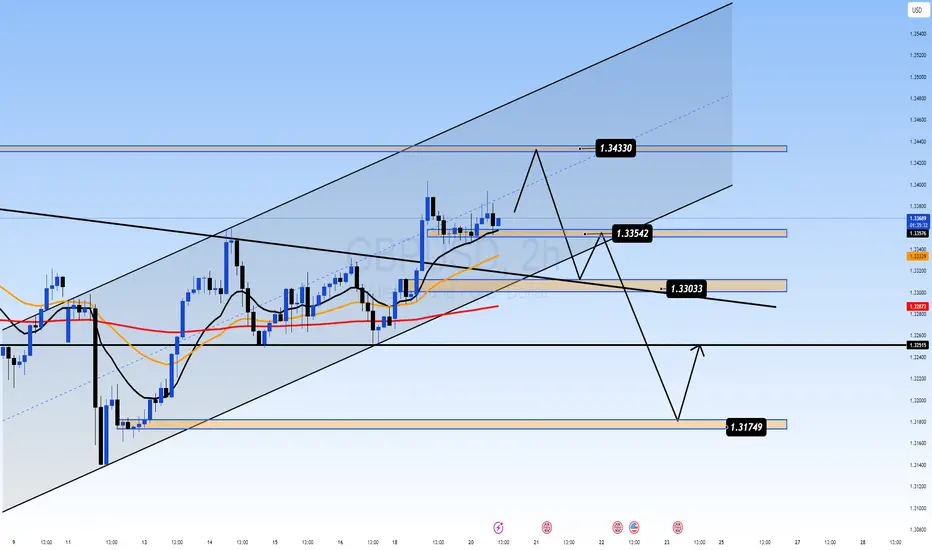
GBP/USD is moving within a rising channel. However:
1.3433 remains a strong resistance, aligning with a local top — breakout potential is limited in the short term.
A rising wedge pattern is forming — watch for a potential trap followed by a sharp sell-off.
EMA13 and EMA34 are diverging, signaling distribution and potential reversal ahead.
🔑 Key Levels to Watch
Major Resistance:
🔺 1.3433 – recent swing high and potential double top
🔺 1.3355 – mid-range resistance and EMA34 convergence (H2)
Key Support:
🔻 1.3303 – key FIBO + trendline intersection
🔻 1.3251 – medium-term bullish structure support
🔻 1.3174 – previous swing low and strategic BUY ZONE
🎯 Trading Scenarios
📍 Scenario A – False Break and Rejection from Resistance
Entry (SELL): 1.3430 – 1.3433 (after bearish confirmation)
Stop Loss: 1.3460
Take Profits: 1.3355 → 1.3303 → 1.3250
📍 Scenario B – Breakdown and Failed Retest
Entry (SELL): 1.3303 – 1.3310 (after support break and retest)
Stop Loss: 1.3340
Take Profits: 1.3251 → 1.3174
📍 Scenario C – Deep Buy from Strong Support
Entry (BUY): 1.3170 – 1.3174
Stop Loss: 1.3140
Take Profits: 1.3251 → 1.3300
⚠️ Key Reminders:
Stay cautious ahead of key US releases this week (PMI, FOMC Minutes), which may trigger high volatility.
Avoid FOMO and respect SL/TP discipline — especially near potential trap zones.
📌 Follow for intraday updates and real-time trade setups as the structure evolves. Flexibility is key in this market.
FTSE 100: Bearish Order flowBearish Crab Pattern via the 1H timeframe. Let's see how this plays out.
There's also an order block at the bottom on the H4 timeframe. Maybe price could go bearish to mitigate it. As they say, false move beginning of the week.

EUR/USD DAILY PLAN – BREAKOUT CONFIRMATION OR FAKEOUT TRAP?EUR/USD DAILY PLAN – BREAKOUT CONFIRMATION OR FAKEOUT TRAP?
🧠 Macro Overview
This week’s trading landscape is influenced by both European and U.S. developments:
EU Side: There are no major macroeconomic releases ahead, but expectations are growing that the ECB may adopt a more dovish tone in upcoming meetings. If inflation continues to cool, the euro may face downside pressure.
U.S. Side: Last week’s CPI and PPI data showed signs of cooling inflation, yet not enough for the Fed to shift gears. The U.S. dollar remains supported by the prospect of “higher for longer” interest rates.
Global Sentiment: Ongoing U.S.–China tensions and trade policy updates in Europe are keeping risk appetite cautious. The EUR/USD pair is testing a key zone and may break out of the descending channel soon — or reject hard if buyers fail to hold.
📊 Technical Analysis (H1 Chart)
EUR/USD bounced strongly from the 1.1160 – 1.1180 demand zone and is now testing the key resistance at 1.1237 — a confluence of descending trendline and the 200 EMA on the 1H chart.
A clean breakout above and sustained hold of 1.1237 could pave the way toward higher resistance levels at 1.1270 and 1.1325.
However, if the pair gets rejected at 1.1237, it may fall back to test the lower support at 1.1160 – 1.1180, possibly forming a range before a larger move.
📌 Key Levels to Watch
🔺 Resistance Levels:
1.1237 → Key confluence zone (EMA200 + trendline)
1.1270 → Previous swing high
1.1302 – 1.1325 → Upper resistance zone with Fibo confluence
🔻 Support Levels:
1.1180 → Immediate demand area
1.1160 → Critical trendline support
A break below 1.1160 could trigger stronger bearish momentum
🎯 Trading Scenarios
1. Bullish Breakout Above 1.1237
🔹 Entry: 1.1240 – 1.1250
🔹 SL: 1.1210
🔹 TP: 1.1270 → 1.1302 → 1.1325
2. Bearish Rejection at 1.1237
🔻 Entry: 1.1230 – 1.1225
🔻 SL: 1.1255
🔻 TP: 1.1180 → 1.1160
3. Buy-the-Dip at Key Support
🔹 Entry: 1.1165 – 1.1170
🔹 SL: 1.1135
🔹 TP: 1.1200 → 1.1230
⚠️ Key Notes:
Avoid entering trades during chop between 1.1215 – 1.1237 unless breakout confirmation appears.
Be cautious of liquidity grabs during London and NY session opens.
Stick to tight risk management as market remains uncertain and range-bound.
📌 Conclusion:
EUR/USD is at a decision point. Whether bulls take control or sellers defend key resistance will determine short-term trend direction. Trade the breakout or the reaction — not the prediction.