Pound Tops $1.357 on Solid DataGBP/USD advanced above $1.357, hitting its highest level since February 2022, as Trump’s delay of the 50% EU tariff boosted global sentiment. The pound also gained from promising April data, with retail sales rising 1.2%, marking the fourth monthly gain. Inflation stayed high at 3.5%, adding uncertainty over the BoE’s next move. Markets now price in a 50% chance of a rate cut by August, with another possible by year-end.
Support lies at 1.3425, with resistance at 1.3600. Other key levels are 1.3850 and 1.3750 above, and 1.3165 and 1.2890 below.
Chartanalysis

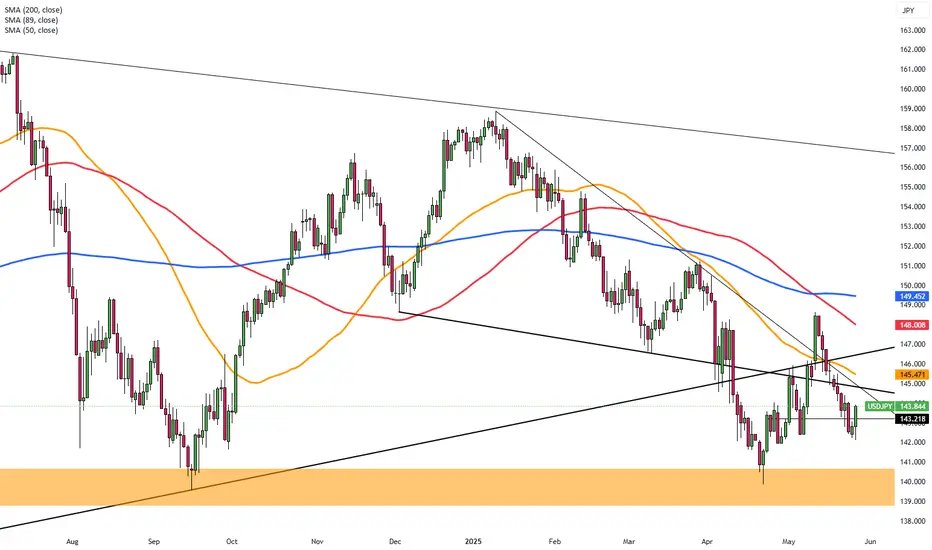
Yen Reaches Highest Level in a MonthThe Japanese yen strengthened toward 142 per dollar on Tuesday, its highest in four weeks, driven by safe-haven inflows and weak dollar sentiment tied to Trump’s fiscal plan. Worries over a widening U.S. deficit weighed on the greenback, while speculation of a 25% iPhone tariff added to trade conflicts. Domestically, expectations for more BoJ tightening rose after core inflation surprised at 3.5%, a two-year high.
Resistance stands at 148.60, with further levels at 149.80 and 151.20. Support is found at 139.70, then 137.00 and 135.00.
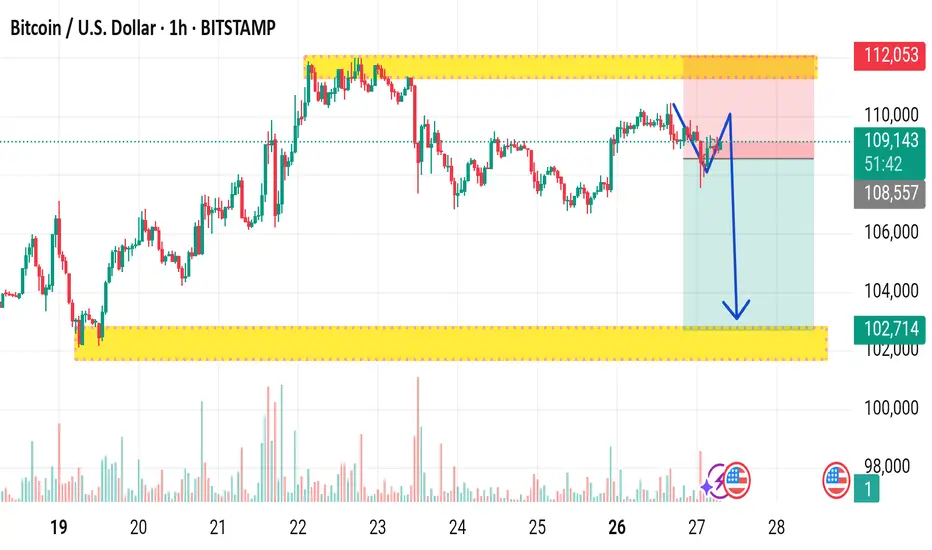
BTCUSD UPDATE : 27- 5 - 2025This chart shows a 1-hour time frame for Bitcoin (BTC/USD) on Bitstamp, with technical analysis indicating a potential bearish move. Here’s a breakdown of the chart:
Price Range: The chart highlights a trading range between approximately $102,714 (support) and $112,053 (resistance), marked with yellow zones.
Current Price: BTC is trading around $109,026.
Bearish Signal: A blue arrow points downward, suggesting an anticipated drop in price.
Pattern Suggestion: It looks like a potential double top or lower high is forming, signaling weakening bullish momentum.
Target Zone: The arrow points towards the support zone around $102,714, implying that the chartist expects BTC to fall to that level.
This type of analysis is often used for short-term trades and may involve setting stop-losses near $112,053 and profit targets near $102,714. Let me know if you'd like help interpreting this pattern further or backtesting the setup.
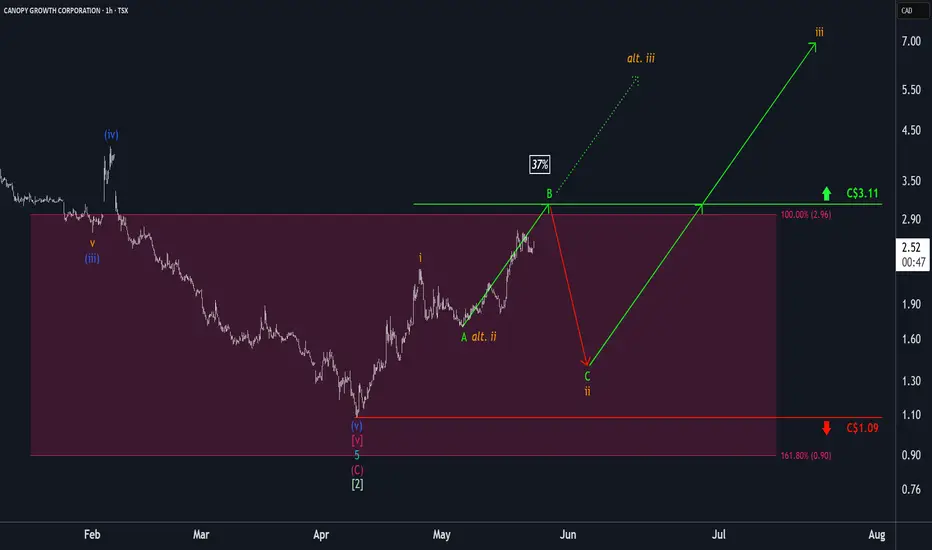
Canopy Growth: Further UpwardThe WEED stock has already realized considerable increases during the current green wave B, which we credit with even more upward potential. However, we primarily expect the top of this movement to be marked below the resistance at C$3.11, and subsequently, the price should move deeper into our magenta Target Zone between C$2.96 and C$0.90 to complete the larger wave ii in orange. The following wave iii should then lead WEED out of the magenta zone and peak above the mentioned C$3.11 resistance. If the stock already rises above this mark during the current movement, we will have to assume that wave alt. ii in orange has already concluded (probability: 37%).
Gold Price Forecast: Bullish Channel Points to $3,388 TargetGold (XAU/USD) is trading in a strong ascending channel on the 45-minute chart, currently at $3,357.51 (+1.91%). Repeated bullish bounces off the channel’s lower boundary (highlighted in orange) reinforce the uptrend. With support from a green trailing indicator and recent breakout momentum, the next target is projected near $3,388.88. Watch for continued strength above the $3,330 zone for confirmation.
Chart Analysis: Gold (XAU/USD) – 45-Minute Timeframe
Trend Structure:
The price is moving within a well-defined ascending channel, indicating a strong bullish trend.
Higher highs and higher lows are consistently formed, respecting both the upper and lower bounds of the channel.
Key Observations:
1. Support Validation:
Multiple successful retests of the lower trendline (highlighted with orange circles) show solid demand and trend continuation behavior.
These retests occur with minimal drawdown, suggesting buyers are stepping in confidently at channel support.
2. Bullish Momentum:
The recent price breakout above consolidation (seen around May 24-25) shows renewed bullish interest.
The price is also supported by a trailing green indicator (likely an EMA or a dynamic support line), which the price remains above — a further bullish confirmation.
3. Short-Term Target:
Projected target of $3,388.878 aligns with the upper bound of the ascending channel, making it a logical resistance level.
If this level is breached with strong volume, it could open the door for continuation toward $3,400+.

Top M30 XAU/USD Trade Setups for Today – Buy & Sell Opportuniti📊📉📈 Gold (XAU/USD) is currently trading within a key support zone 🟣, retesting after a previous bullish breakout. If the price holds this zone and forms strong bullish candles, we could see a move toward the 3,366 resistance level 🔵 and potentially higher toward 3,389 📈. However, if the price breaks below this zone with strong bearish momentum, a drop toward 3,280 🔽 becomes likely. Watch the price action closely within this zone, as it could lead to a decisive move. ✅ Patience and confirmation are crucial to avoid false breakouts. 💡

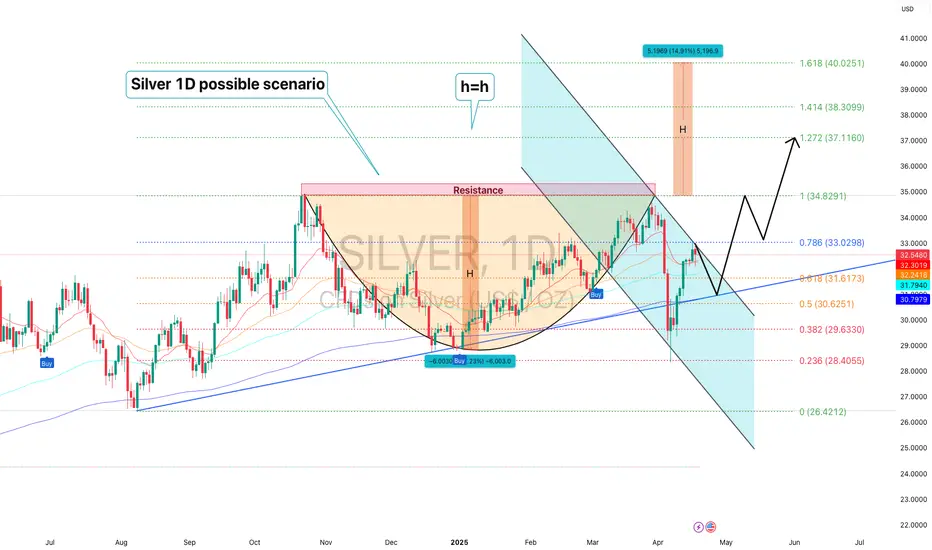
SILVER 1DA possible scenario for silver on the daily timeframe involves buying from the levels of 30.90-31.00 with further targets at 33.02, 34.8291 and the expected completion of the rounding pattern with a subsequent movement to the zone 40.0251
Everything is clearly depicted on the graph!
Have a good day!
Electronic Arts: Heading LowerElectronic Arts has dropped roughly 13% since our last update, continuing the expected decline within ongoing wave (3). This move is likely to break below support at $114.60 and gradually push the stock downward to the anticipated low. Our alternative scenario suggests the correction may already be done, but that path hinges on a convincing move above $169.82 — a threshold we’re not close to yet. For now, the downtrend remains in control.
📈 Over 190 precise analyses, clear entry points, and defined Target Zones - that's what we do.

SOL/USDTHello, I hope you are well. I left you the analysis of Solana. Tell me your opinion. I saw that it is bullish and it may reach the target I set. If the white area breaks, we can buy again and go up.

BEST XAUUSD M30 BUY AND SELL S FOR TODAYETUP Gold (XAU/USD) is currently trading in a tight **rising wedge pattern** 📈 on the 30-minute chart, just below a key **resistance level at 3,325** 🔼. The price action shows signs of consolidation, indicating that a breakout could be imminent. If the bulls manage to push the price above this resistance 🚀, we may see a strong upward continuation toward higher targets. However, if the wedge fails and price breaks downward 📉, there is potential for a retracement toward the **support levels at 3,304** and further down to **3,274** 🛑. This is a crucial decision point — traders should watch for a confirmed breakout or breakdown before taking positions ⚠️.

Sterling Extends Rally Amid U.S. Fiscal ConcernsGBP/USD extended its gains for a fourth consecutive session, trading near 1.3430 during Thursday’s Asian session. The pair’s upward movement is largely supported by continued weakness in the U.S. Dollar, following Moody’s downgrade of the U.S. credit rating from Aaa to Aa1, in line with earlier downgrades by Fitch in 2023 and S&P in 2011.
Moody’s cited projections that U.S. federal debt could surge to 134% of GDP by 2035, up from 98% in 2023, with the budget deficit potentially widening to nearly 9% of GDP. Key concerns include rising interest payments, growing social expenditures, and weakening tax revenues.
The first critical support for GBP/USD is seen at 1.3450 and the first resistance is located at 1.3250.
$ARB time to fly $1 this bull run 2025 and it's Last Wave...AMEX:ARB Time to Fly and Touching $1 this Quarter. I guess it will be happened and gain bonuses $1+ and $2+ if big investor entry on this token.
My Magic Indicator Say ARB Price have touch Yellow line. Previous Day, Bounce back to above Yellow Line and It's Bull Run 2025 for ARB .
From News: ARB Eyes Trend Reversal With Breakout Signal Above $0.45 This Week
Arbitrum is trading at $0.41 inside a falling wedge and a breakout above $0.45 might confirm a wide shift from its yearlong downward trend.
Arbitrum has formed a falling wedge with lower highs and higher lows now compressing price at $0.41.
If the price moves above $0.45 with strong volume this could confirm a new bullish pattern for $ARB.
The wedge has been forming since 2024 and a breakout may signal the start of a strong trend reversal.
The descending wedge pattern forming on the Arbitrum chart spans nearly one year, beginning from its 2024 highs near $2.50. Several failed rallies marked by red arrows define the top boundary, while green arrows at the base represent support retests. This structure has now tightened into a narrow apex where breakout probability increases significantly.
#Write2Earn #BinanceSquareFamily #Binance #BTC☀ #SUBROOFFICIAL
Disclaimer: This article is for informational purposes only and does not constitute financial advice. Always conduct your own research before making any investment decisions. Digital asset prices are subject to high market risk and price volatility. The value of your investment may go down or up, and you may not get back the amount invested. You are solely responsible for your investment decisions and Binance is not available for any losses you may incur. Past performance is not a reliable predictor of future performance. You should only invest in products you are familiar with and where you understand the risks. You should carefully consider your investment experience, financial situation, investment objectives and risk tolerance and consult an independent financial adviser prior to making any investment.

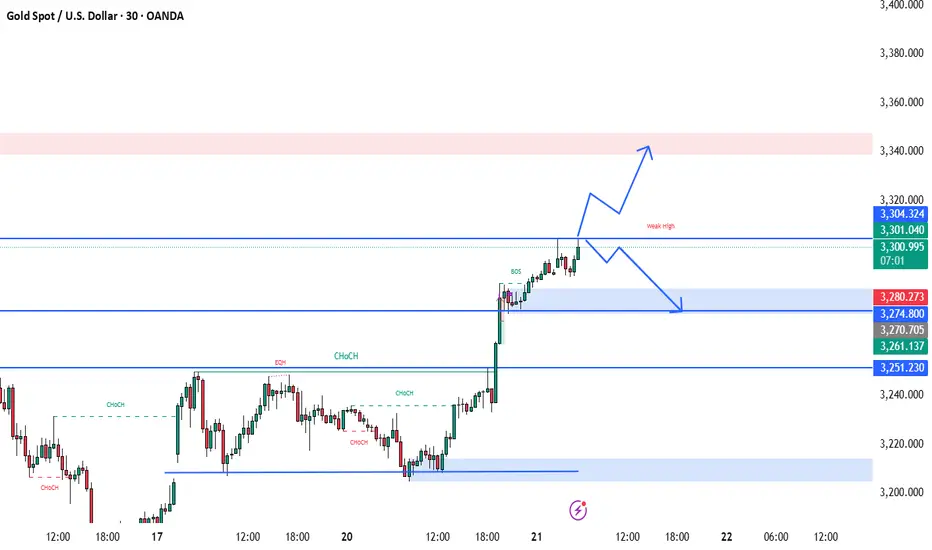
BEST XAUUSD M30 BUY SETUP FOR TODAYThis 30-minute chart of Gold Spot (XAU/USD) reflects a strong bullish momentum 📈, marked by a clear Break of Structure (BOS) and Change of Character (ChoCH) signaling a market shift to the upside. Price recently broke above an equal high (EQH) and is now testing a resistance zone labeled as a “weak high”, suggesting potential for further upside toward the next key supply zone 🔴. The projection highlights two possible scenarios: either a continued bullish rally into the supply area around 3,340 🏹, or a pullback to the demand zone near 3,280 🟦 before resuming upward movement. Traders should monitor for price reaction at current levels and be prepared for either a breakout or a healthy retracement for optimal entry opportunities 🎯.
Pound Climbs Above $1.336 on Strong UK DataThe British pound rallied past $1.336, reaching a one-week high and inching closer to its April peak of $1.34. The move was fueled by renewed optimism after the UK and EU reached a comprehensive post-Brexit agreement covering energy cooperation, defense partnerships, and fisheries rights through 2038.
Supporting the pound further, recent UK data exceeded expectations. GDP rose 0.7% in Q1 and 1.3% annually, easing pressure on the Bank of England to cut interest rates aggressively. Although rate reductions remain on the table, the strength of the economic rebound gives policymakers more flexibility.
Despite some concerns about rising unemployment and slowing wage growth, the upbeat GDP print has helped offset fears of an impending recession. Meanwhile, the US dollar continued to weaken following Moody’s credit downgrade, providing additional support to the pound.
GBP/USD now faces resistance at 1.3450, with higher targets at 1.3550 and 1.3700. Support is located at 1.3160, followed by 1.3000 and 1.2960.
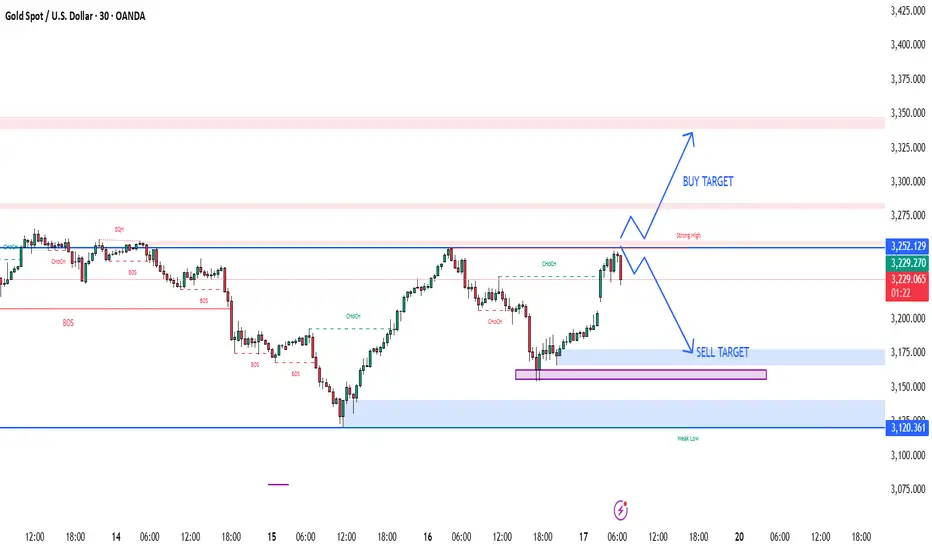
XAUUSD M30 BEST BUY AND SELL SETUP FOR TODAYThis 30-minute chart of Gold Spot (XAU/USD) reveals a critical decision zone ahead 📊. Price is currently reacting to a support area around 3210, marked by the purple zone. A Change of Character (ChoCH) has just occurred, suggesting a potential bullish reversal if price holds above this support 📈. There are two likely scenarios:
1️⃣ A bullish continuation where price forms higher lows and targets the supply zone near 3230 and potentially the strong high at 3252, or
2️⃣ A bearish break below support, triggering a drop towards the demand zone at 3170 and possibly further into the order block (OB) near 3160 📉.
Traders should watch for confirmations like strong bullish candles or rejections at key levels before committing to a direction ✅. This is a high-probability setup with defined risk and reward zones! 💰📉📈

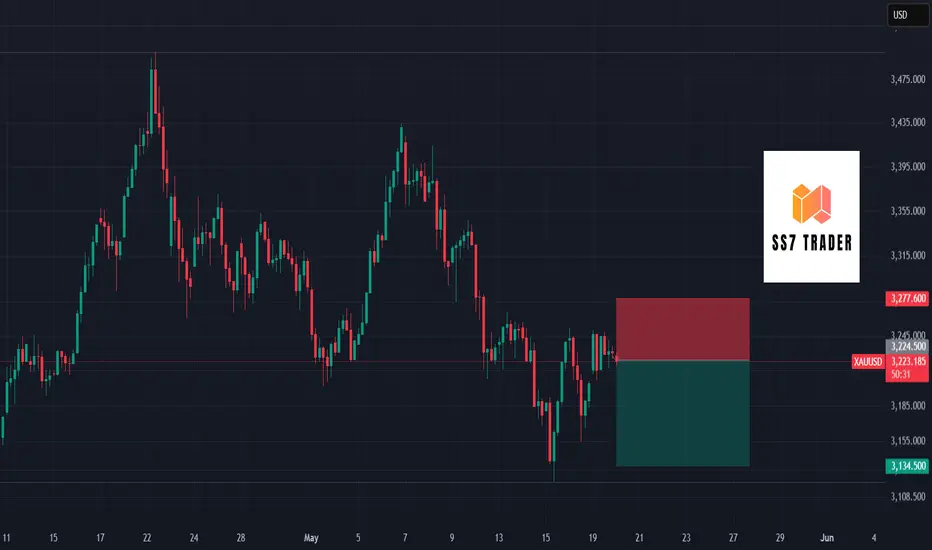
XAUUSD Deep Analysis Using Neural Networks Technology #xauusdThis analysis by ss7trader neural networks technology. this will higher chance to hit the take profit target and if you need any help or question then you can ask me on tradingview @ss7trader mostly i am available or you can also comment in the idea. also must like share the idea to getting these type of market analysis daily basis.
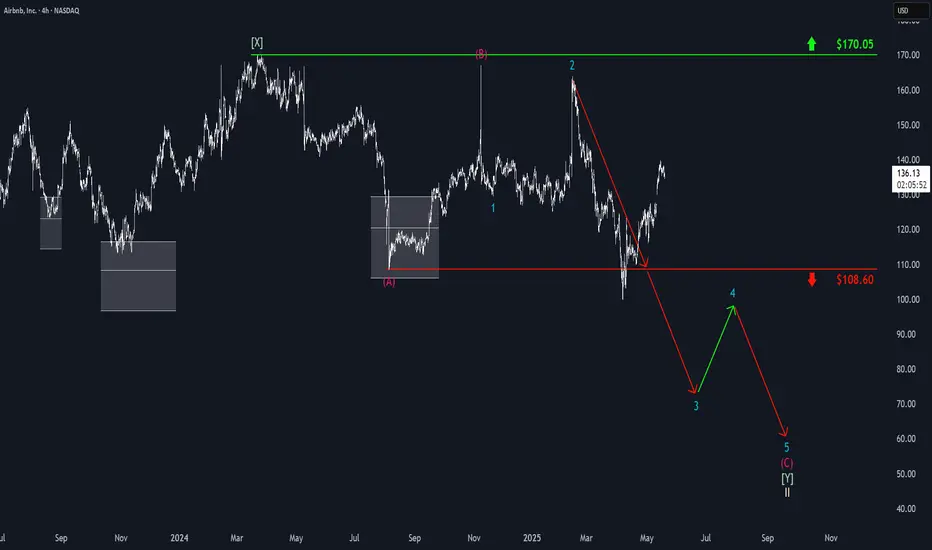
Airbnb: Upward pressureAirbnb's stock has once again come under noticeable upward pressure. However, we primarily classify these increases as a countermovement as part of the bearish wave 3 in turquoise – and accordingly expect a downward reversal soon. During wave 3, the price should finally fall below the support level at $108.60, and the subsequent wave 4 should also remain below this mark, so that the subsequent wave 5 can ultimately complete the entire turquoise downward impulse and the overarching corrective movement of the beige wave II.
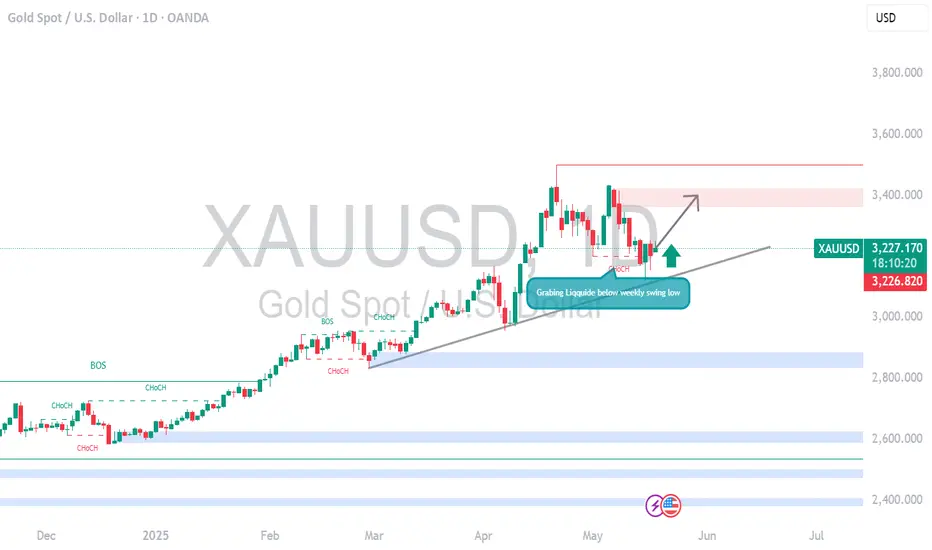
XAUUSD GOLD Just Grabbed liquidity Below a key low analysis Full Guide: How to Use COT Data for Trading XAUUSD (Gold)
1. What is COT Data?
The Commitment of Traders (COT) report is a weekly publication by the Commodity Futures Trading Commission (CFTC). It shows the aggregate positioning of different types of traders in the futures markets.
For XAUUSD (Gold), you’ll look at the Gold futures (COMEX) section.
2. Key Trader Categories in COT Report
1. Commercials (Hedgers):
Typically big institutions or producers like mining companies.
They use futures to hedge exposure, not speculate.
Usually short during rallies and long when price is low.
2. Non-Commercials (Large Speculators):
Hedge funds, money managers.
Considered the "smart money." Full Guide: How to Use COT Data for Trading XAUUSD (Gold)
1. What is COT Data?
The Commitment of Traders (COT) report is a weekly publication by the Commodity Futures Trading Commission (CFTC). It shows the aggregate positioning of different types of traders in the futures markets.
For XAUUSD (Gold), you’ll look at the Gold futures (COMEX) section.
---
2. Key Trader Categories in COT Report
1. Commercials (Hedgers):
Typically big institutions or producers like mining companies.
They use futures to hedge exposure, not speculate.
Usually short during rallies and long when price is low.
2. Non-Commercials (Large Speculators):
Hedge funds, money managers.
Considered the "smart money."
Follow trends and often drive major moves.
3. Nonreportables (Retail/Small Traders):
Smaller traders, often contrarian indicators.
Not always consistent with price direction.
---
3. Where to Find COT Data
CFTC Website
Tools like:
Tradingster.com
BarChart.com
COTbase.com
Look for "Legacy" or "Disaggregated" COT reports for Gold - COMEX.
---
4. How to Read the COT Data for Gold
Key Metrics:
Longs/Shorts: Number of contracts held.
Net Positions: Longs minus Shorts.Changes WoW: Increase/decrease in positions compared to the prior week.
Example Insight:
If Non-Commercials are heavily net long, and reaching historical highs, market may be overbought.
If Commercials increase shorts significantly, they may be preparing for a price decline.
A divergence between price action and COT data often signals potential reversal.
---
5. Using COT for Gold Trading (XAUUSD)A. Trend Confirmation
Rising net long positions by non-commercials = bullish confirmation.
Decreasing net long or rising shorts = weakening trend or reversal.
B. Reversal Spotting
Extremes in positioning (e.g., record longs by speculators) often precede reversals.
Look for non-commercials reducing longs while commercials increase shorts—potential top.
C. Liquidity Grabs and COT
If gold grabs liquidity (stop hunts) and COT shows heavy speculative positioning, that could be a smart money trap.
A strong bullish reversal after liquidity grab with increasing net longs confirms a momentum shift.
---
6. How to Combine COT with Technical Analysis
Use COT to validate or question what you see on the chart.
Example Setup:
Chart: Gold drops below key support (liquidity grab).
COT: Non-commercials increase longs that week.
Conclusion: Smart money bought the dip — potential for bullish reversal.
Combine with:
Market structure
Volume
Sentiment tools
Price action (e.g., bullish engulfing, break of structure)
---
7. Limitations and Tips
Lagging Data: COT is released every Friday for data on Tuesday.
Use it for context and macro positioning, not for intraday trades.
Look at weekly or monthly trends, not daily.
Best used alongside price action and other confirmation signals.
---
Conclusion
COT data is a powerful tool for understanding who is behind the move in gold. By tracking the positioning of major players, you can:
Confirm trends
Spot early signs of reversal
Align your trades with institutional momentum
XAUUSD M30 BEST BUY AND SELL SETUP FOR TODAYGold (XAUUSD) is trading near a 🔴 strong resistance zone (3,239–3,252). If price shows a bearish rejection from this area, it could be a sign of a 🧨 liquidity grab or fake breakout. This sets up a potential 📉 sell opportunity, targeting the support zones at 3,175 and possibly down to 3,120 where the 🧊 weak low and demand lie. A safe 🛑 stop-loss can be placed above 3,260 to manage risk. However, if the price gives a strong breakout and 📈 retest above 3,252, then a bullish continuation toward 3,325–3,350 is likely 🎯. Patience is key—wait for clear confirmation before entering the trade ⚖️📊.
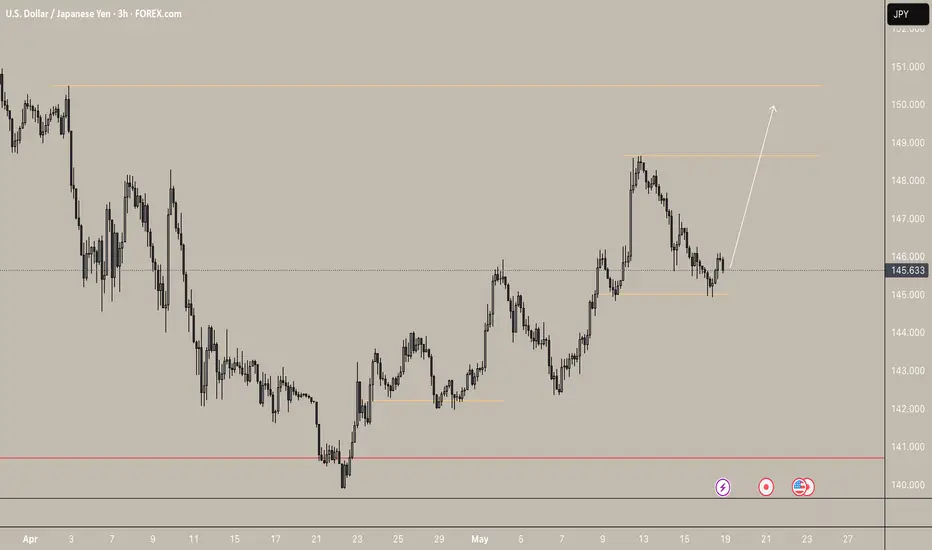
USDJPY Bullish Breakout Setup – Retest at Key Demand ZoneUSDJPY is respecting a clean bullish structure after rebounding from the 140.100 base. Price made a higher high near 148.650, followed by a pullback into the previous demand zone around 145.000.
Technical Breakdown:
Market Structure: Higher highs and higher lows indicate a strong uptrend.
Demand Zone: Clean reaction from the 145.000 zone, which previously acted as resistance-turned-support.
Target Zones:
First TP: 147.900 (previous swing high)
Final TP: 150.600 (key resistance level)
Invalidation Level : Close below 144.800 could invalidate this bullish scenario.
If price sustains above 145.000, the bullish trend is likely to continue.
As always, manage risk carefully.
Like & Follow for more clean, high-timeframe breakdowns!
Solana: Below ResistanceOur primary scenario for Solana is that the coin is already close to the top of the green wave 4. Therefore, we expect a bearish trend reversal below the resistance at $192.33, followed by a move toward our blue Target Zone (coordinates: $56.56 – $29.87) with the green wave 5. Down there, we see an opportunity for long trades with the low of the blue wave (ii), which should be followed by a fresh upward impulse. According to our alternative scenario (probability: 38%), however, we may have already seen the low with wave alt.(ii) in blue prematurely. To validate this alternative scenario, the price would have to rise directly above the resistance at $192.33 from here and extend the blue wave alt.(iii) .

Pound Gains on Strong UK GDPThe British pound climbed to $1.3320 on Friday after strong UK GDP data showed the economy grew 0.7% in Q1 and 1.3% year-over-year, easing pressure on the Bank of England to cut rates aggressively. While a cut is still likely, the solid growth figures suggest urgency has diminished. At the same time, a softer U.S. dollar, driven by speculation that the U.S. may be allowing depreciation to support exports, has supported sterling. However, the UK’s broader outlook remains mixed, with rising unemployment and slowing wage growth signaling uneven momentum.
GBP/USD faces resistance at 1.3350, with additional levels at 1.3450 and 1.3550. Support levels are at 1.3160, 1.3000, and 1.2960.
