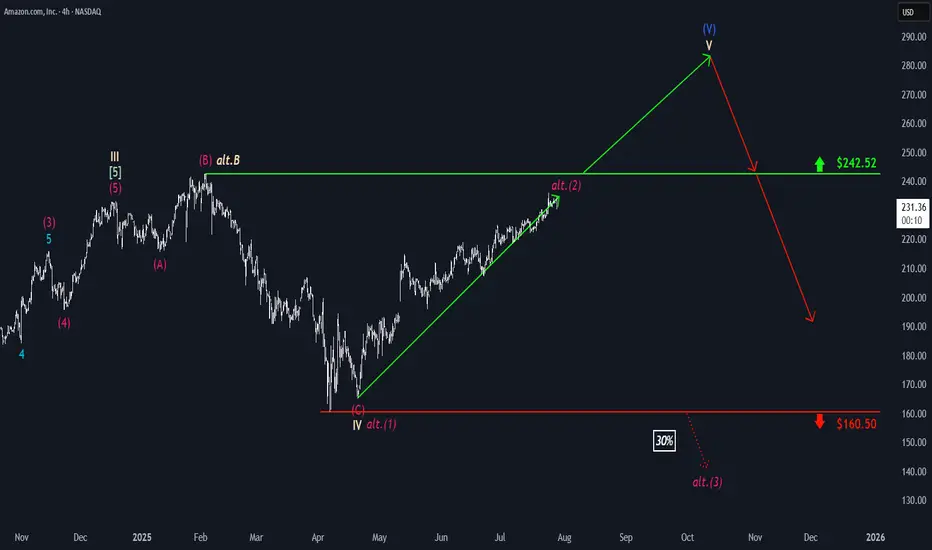
Amazon: Extending the Rally...Amazon maintaines its strong upward momentum. As this trend continues, the large blue wave (V) is expected to complete well above the resistance level at $242.52. However, an alternative scenario with a 30% probability remains on the table: in this case, the magenta corrective wave alt.(2) would peak below the $242.52 resistance, and a significant pullback below support at $160.50 would be anticipated afterward. In this scenario, the high of beige wave alt.B would have been set at $242.52, after which the stock would enter the broader downward movement of wave alt.C .
📈 Over 190 precise analyses, clear entry points, and defined Target Zones - that's what we do (for more: look to the right).
Chartanalysis
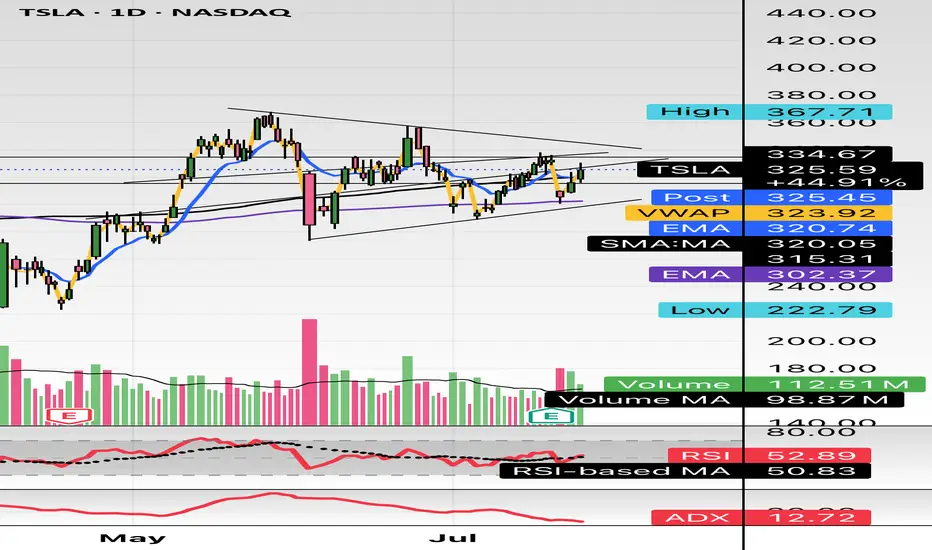
$TSLA either one big flag or massive short setting upHello,
Just some browsing, NASDAQ:TSLA hasn’t had any major moves prior to early May - June IMO. This is on my watch for a short swing setup. This is bull flagging but I see a short here. I’m conflicted. I do see the higher low but we are in a pitchfork and this has been consolidating in this $290-$340 area for about a month and half. There’s also a lower high. Just posting for some free dialogue and open ideas. Talk to me. Let me know what you see and think. We aren’t too far from 200EMA and 200SMA. It’s just curling above the 50 as well. Maybe we consolidate for another week or two? A massive move is brewing here I think. I’m talking $100 in a week up or down soon.
WSL
XRP: PullbackRipple’s XRP has once again seen a significant pullback since last Monday, raising the possibility that the high of turquoise wave B may already be in. For now, however, we continue to allow room for this corrective move to extend up to resistance at $4.09, before turquoise wave C drives the altcoin lower toward the magenta wave (2) low. With XRP still trading well above the $0.38 support level, the next upward impulse—magenta wave (3)—should then begin to take shape. Alternatively, there is a 33% chance that this bullish move has already started; however, this scenario would only be confirmed by a decisive break above the $4.09 level.
📈 Over 190 precise analyses, clear entry points, and defined Target Zones - that's what we do (for more: look to the right).

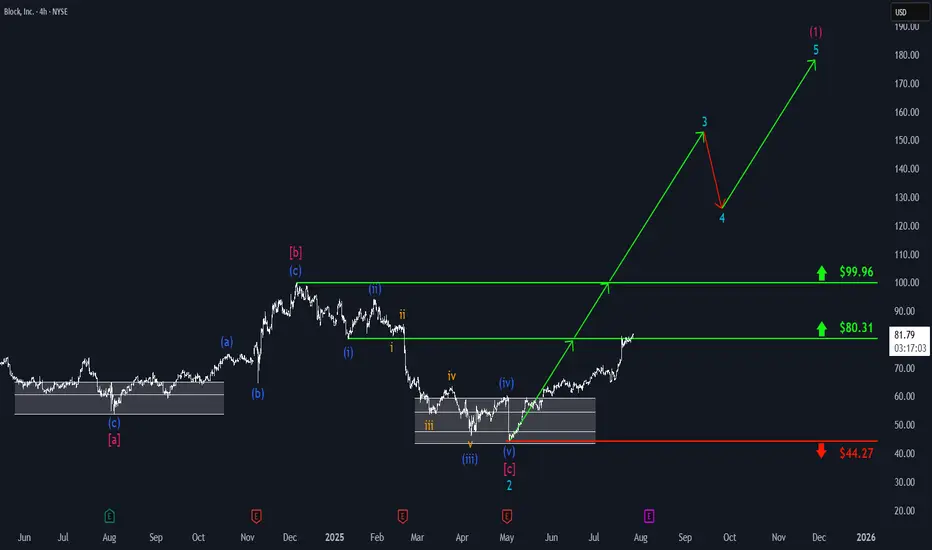
Block: Key Resistance HitBlock has made a strong upward move, reaching resistance at $80.31. Thanks to this positive momentum in our primary scenario, we fully focus on further gains as part of turquoise wave 3, which is expected to push the price decisively above the next resistance at $99.96. The subsequent pullback in wave 4 should also occur above this level, before wave 5 ultimately completes magenta wave (1) – marking the first major leg up in the ongoing bullish impulse.
📈 Over 190 precise analyses, clear entry points, and defined Target Zones - that's what we do (for more: look to the right).
AUDUSD Engineered to Drop?🧠MJTrading:
📸 Viewing Tip:
🛠️ Some layout elements may shift depending on your screen size.
🔗 View the fixed high-resolution chart here:
🔻 OANDA:AUDUSD – Tagged the Top | Smart Money Eyes Lower Levels??
📍 Perfect Respect of Channel Structure
AUDUSD has just kissed the upper boundary of a long-standing ascending channel, showing sharp rejection — a sign that premium pricing might now shift toward discount levels.
📈 The aggressive push into the highs likely aimed to clear buy stops — fulfilling smart money objectives before a potential reversal.
📉 And here’s the subtle clue:
Just below the last bullish candle lies a thin slide — a structural weakness.
If price breaks and closes below that full body bearish candle (Below 0.66000), the market could slip fast, unleashing a momentum-driven drop into the first liquidity zone (0.6520s).
🧠 For smart money lovers, this is the classic:
Sweep → Trap → Slide
📏 And for fans of parallelism, the chart’s geometry offers a rare beauty — lines in harmony, structure in rhythm, and opportunity in alignment.
🔍 What to Watch For:
Break below 0.66000 (last candle body) = entry signal
0.6520–0.6540: first liquidity zone
0.6400–0.6300: deeper cleanout, if bearish pressure sustains
Inset: DXY bouncing from long-term demand supports bearish thesis
Manage your risk wisely...
For Lower time frame traders:
Psychology Always Matters:
(Click on the pictures for caption and concepts)
#AUDUSD #SmartMoney #LiquiditySweep #ChannelTrading #ChartDesigner #MJTrading #PriceAction #Forex

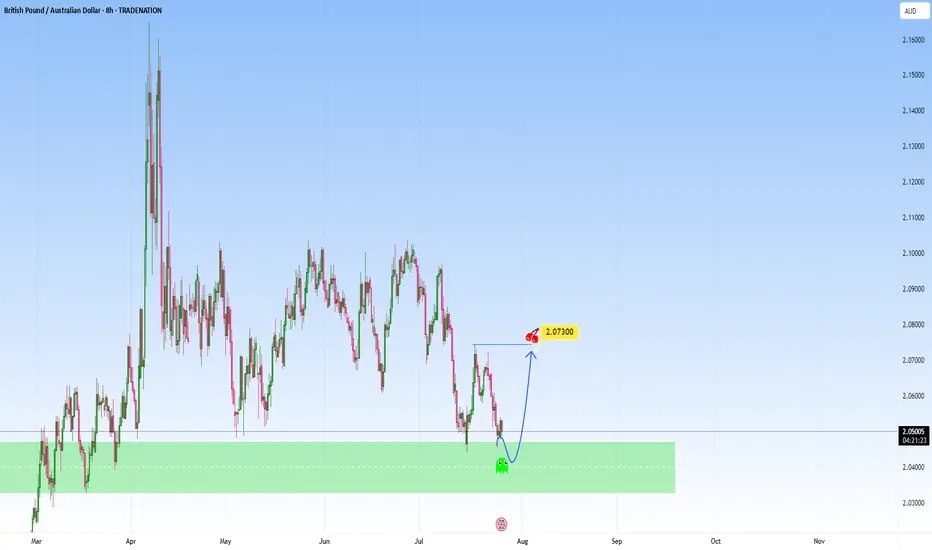
GBPAUD: Possible bounce at supportI am watching for a possible reversal GBPAUD, expecting a rejection with a upside target at around 2.073.
This area is where it can become a decision point, either price finds support and bounces, or it breaks below, and the move can start to extend lower.
Just sharing my thoughts for the charts, this isn’t financial advice. Always confirm your setups and manage your risk properly.
Disclosure: I am part of Trade Nation's Influencer program and receive a monthly fee for using their TradingView charts in my analysis.
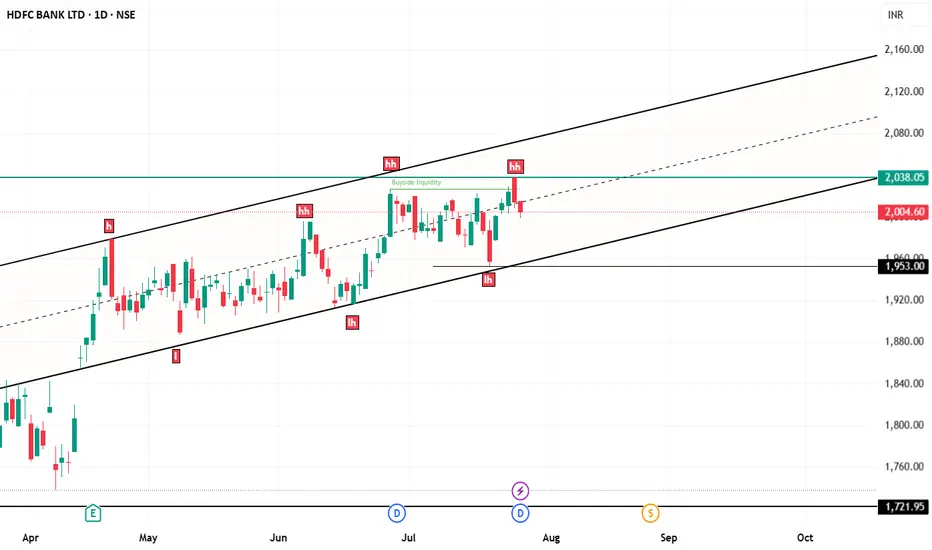
hdfc bank chart analysishdfc bank chart here in your screen
price working in parallel channel and 2038 is most important level for upside rise...
if 2038 break out with powerful vollume and candle then again we can see rally.
but a pattern here that is higer high and lower low...
EURJPY Bullish Breakout with IFC Confirmation | MMC Retest Play🔍 Market Structure & Price Behavior Explanation
🔹 1. Channel Structure and Bearish Trap:
The pair was previously trading within a downward sloping channel, forming lower highs and lower lows. This structure was respected for several sessions, creating a bearish bias for most retail traders.
However, as per Mirror Market Concepts, such channels often act as liquidity traps — designed to build sell-side liquidity before a strong reversal.
🔹 2. IFC Candle Break — Smart Money Confirmation:
A powerful bullish impulse candle (IFC - Institutional-Filled Candle) broke through all previous swing highs formed inside the channel. This is a critical sign that institutional buyers have stepped in and the bearish trend is likely over.
This candle is not just a breakout but also a signature of smart money transitioning the market structure from bearish to bullish. The breakout occurred with high momentum and volume, piercing through the upper channel boundary, invalidating the bearish trend.
📘 Key Note: IFC candles usually represent imbalance, strong directional intent, and are often followed by continuation after retest.
🔹 3. Retesting Phase – Key to Confirmation:
After the breakout, price retested the broken structure, which is now acting as a new demand zone. The retest is clean, holding firmly above minor support — giving confirmation of bullish control.
This zone is also aligned with a QFL (base structure) concept, where price returns to the base before a new leg of the trend begins.
🔹 4. Current Price Action: Building for Next Leg
Price is now consolidating just below the next key reversal zone (marked in green). This zone represents potential supply or resistance.
There are two likely outcomes here:
Rejection at the reversal zone, with a potential pullback before continuation.
Clean break above, followed by "Demand Doubling", where price re-tests this level again, confirming further upside momentum.
In case the second scenario plays out (as marked on the chart), EURJPY could aggressively rally toward 174.400 and beyond.
🔹 5. Demand Zones & Key Levels:
✅ Minor Demand Zone (~173.00):
Currently respected — origin of last bullish move.
✅ Major Demand Zone (~171.200):
Acts as macro support in case of deep retracement.
✅ Reversal Zone (~173.800 – 174.200):
Price may slow down, reject, or consolidate here. Smart money usually decides at this level.
📈 MMC Trading Plan (Mirror Market Concept Approach):
Buy Bias is active as long as price remains above the minor demand zone.
Any rejection from reversal zone with wick traps followed by bullish engulfing setups = potential long entries.
Break & hold above 174.200 will likely trigger momentum-based entries, targeting extended bullish continuation.
💹 Trade Setup Parameters:
📥 Entry #1: After successful retest and bullish confirmation at demand
🛑 Stop Loss: Below retest structure (~172.850)
🎯 Take Profit 1: 173.950 (within reversal zone)
🎯 Take Profit 2: 174.350+ (post-demand doubling continuation)
🧠 Trader’s Mindset – What to Expect Next:
The chart is a classic example of MMC in real-time, where:
Price traps sellers inside a fake bearish channel
Breaks structure using high-volume impulsive moves
Retests demand zone cleanly
Builds up toward the next decision-making zone
Patience is key here. Let price either break and confirm above the reversal zone or give us another deep retest for the best R:R long setup.

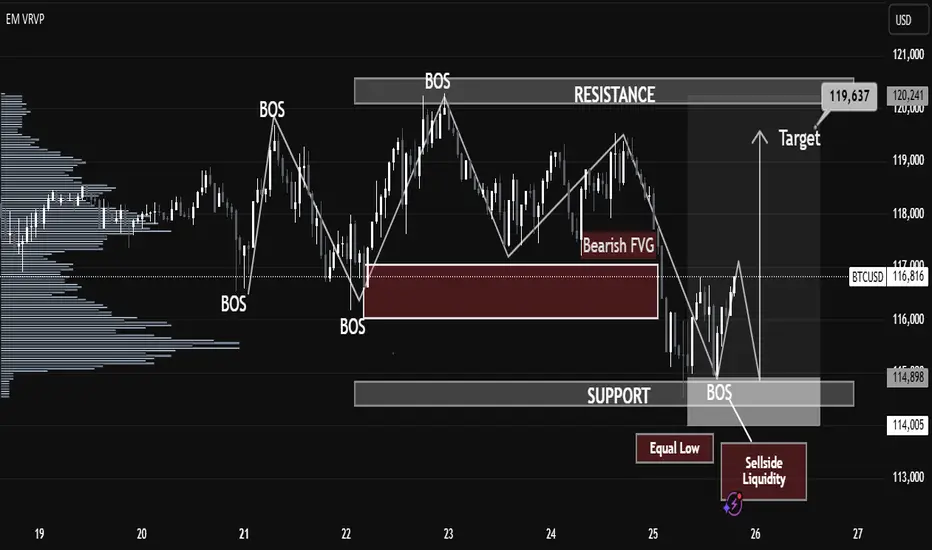
BTC Breaks Structure After Liquidity Grab! Massive Move Loading…BTC/USD Technical Analysis – July 25, 2025
Structure Overview:
The current BTC/USD price action showcases a classic market structure shift, with multiple Breaks of Structure (BOS), liquidity grabs, and a clear intent to revisit premium pricing zones. The chart follows a Smart Money Concepts (SMC) methodology, identifying key supply and demand areas.
Key Highlights:
🔹 Break of Structure (BOS):
Several BOS events indicate momentum shifts and short-term trend reversals. The most recent BOS near the support zone suggests a potential bullish move after liquidity sweep.
🔹 Sell-Side Liquidity & Equal Lows:
BTC swept the Equal Low level near $114,000, triggering Sell-side Liquidity. This liquidity grab is often a manipulative move by institutional players to collect orders before driving price higher.
🔹 Support Zone:
The support zone near $114,900–$114,000 is holding strong. Price wicked into this area, collected liquidity, and reacted with bullish intent.
🔹 Bearish Fair Value Gap (FVG):
A Bearish FVG exists around $117,500–$118,000, which may act as short-term resistance. Price could partially fill this gap before resuming direction.
🔹 Target Zone:
Projected target lies at $119,637, aligning with the prior resistance zone and offering a high-probability area for price delivery based on the current bullish market structure.
🔹 Volume Profile Support:
The volume profile suggests high volume accumulation in the current range, further supporting the possibility of a bullish expansion phase.
Forecast Summary:
Bias: Bullish (Short-term)
Entry Zone: Confirmed after BOS and liquidity sweep near support
Target: $119,637 (resistance zone)
Invalidation Level: Sustained break below $114,000
⚠️ Risk Note:
A rejection from the Bearish FVG or failure to break above $117,800 may cause a deeper pullback. Monitor reactions around key levels before continuation.
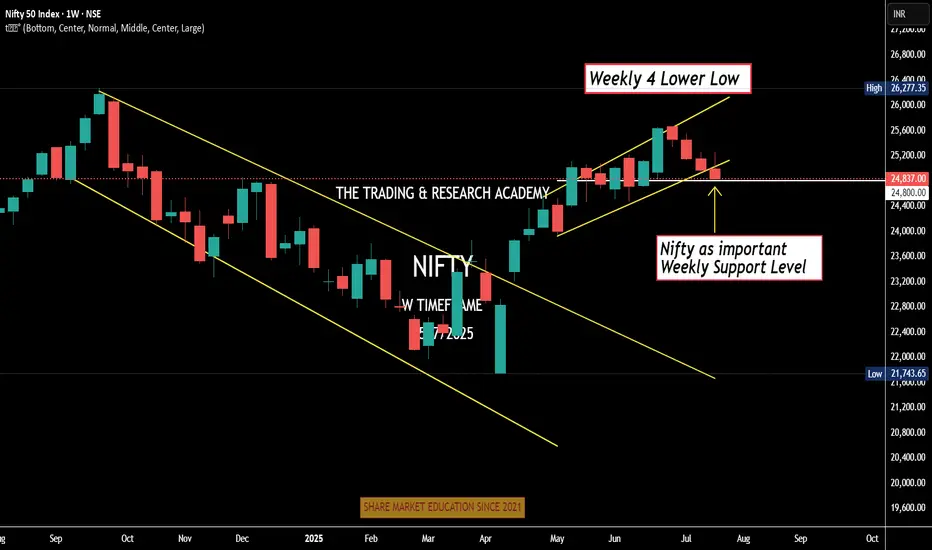
Weekly Nifty Analysis Next week, can we have a small bounce in #Nifty?
4 Lower Low
Daily channel Breakdown
Index at crucial weekly support level
Can one bullish week / Doji be expected. One news here or there & boom!
We have monthly expiry this week, let's see.
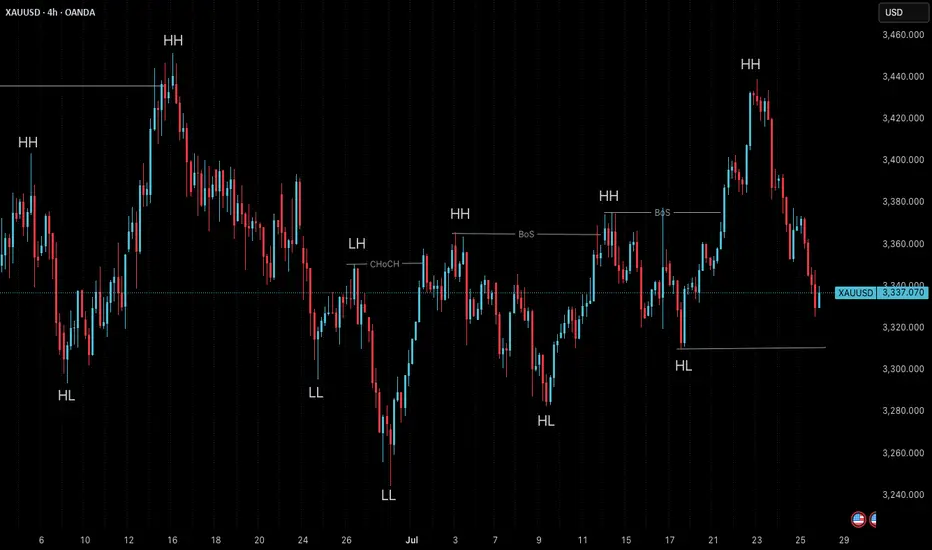
Market Structure is Not Strategy — It’s Your Starting Point“The chart doesn’t hide anything. But your mind does.”
Before any indicator, setup, or signal… comes structure.
🔍 What is Market Structure?
At its core, market structure is the sequence of higher highs (HH) and higher lows (HL) in an uptrend, or lower lows (LL) and lower highs (LH) in a downtrend.
It is the skeleton of price .
Everything else — entries, zones, signals — is just clothing.
If you can’t see the skeleton, you’re reacting to noise.
🎯 Why It Matters:
It’s not a signal. It’s context .
It tells you whether you’re trading with the market or against it .
It defines where your patience begins — not where your entry is.
Market structure helps you let go of the urge to chase. It brings order to the chaos.
🧩 Key Components to Track:
Break of Structure (BoS): Confirms trend continuation
Change of Character (ChoCH): Signals a potential reversal
Swing Points: Define the intent behind price moves
Liquidity Sweeps: Often mask real structure beneath short-term traps
🛑 Common Mistake:
Most traders jump straight to the setup without asking the most important question:
“Where am I in the structure?”
They try to buy a pullback — in a downtrend.
They try to fade a move — right before continuation.
They chase candles — instead of waiting for alignment.
That’s not strategy. That’s stress.
🛠 Tip to Practice:
Use this simple framework to build clarity:
Start from the H4 chart — this gives you the broader directional bias
Drop to M15 — here’s where structure begins to form tradeable setups
Finally zoom into M1 — this is where confirmation happens before entry
Ask yourself:
Where did the last BoS or ChoCH happen on each timeframe?
Is M15 aligning with H4 intent — or contradicting it?
Did you enter after M1 confirmation , or based on impulse?
You don’t need to predict price. You need to align with it.
🪞 Final Thought:
Structure isn’t strategy.
It’s the mirror that shows what’s real before your bias speaks.
When you master structure, you stop forcing trades — and start flowing with them.
💬 Want more like this?
If this post resonated with you — drop a comment below.
Let me know what you'd like to dive deeper into — price action, gold setups, market structure, or the psychology behind your trades.
I’ll build future tutorials based on what matters to you.
📘 Shared by @ChartIsMirror
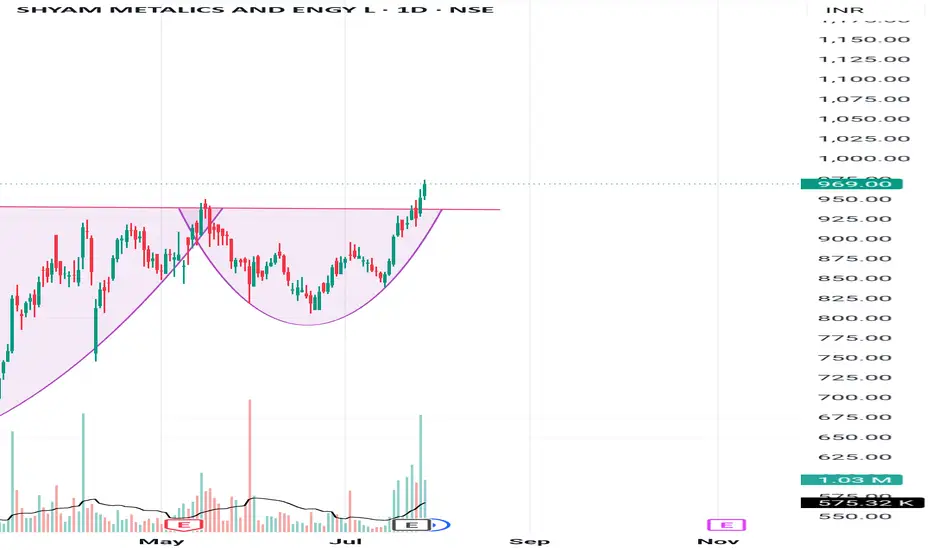
Cup and handle patternBreaks cup and handle pattern and going up. Looks bullish. Make sure to do your own analysis and maintain your risk management. This is only for educational purposes
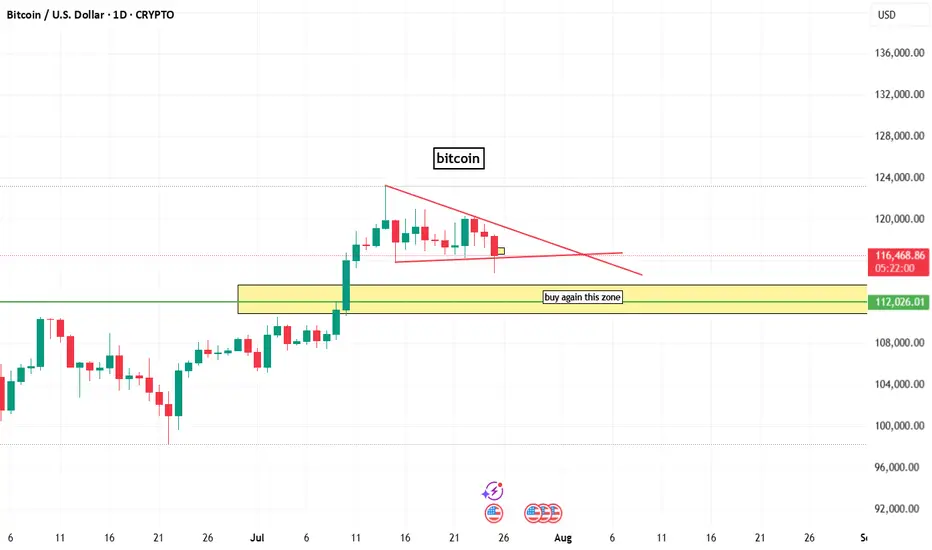
bitcoin chart analysisbitcoin chart analysis on daily time frame
here a buy zone that indicated by box and line.
and on chart bitcoin bullish but lower time frame btc is berrish.
Understanding Market Structure: GBPJPY Trendline Support 📊 GBPJPY Technical Analysis — 15-Min Chart (As of July 24, 2025)
Trend Structure & Price Action
The chart shows a clear ascending trendline, connecting higher lows across the last sessions.
Multiple Break of Structure (BOS) points confirm bullish market behavior, with price consistently forming higher highs and higher lows.
The most recent BOS and price rejection from the lower boundary of the cloud band indicate bullish intent is still active.
Indicators Used
Custom Cloud Band (EMA Based 20, 1.5 settings):
Price is oscillating within and around the cloud band.
Recent candles are attempting to reclaim the upper band, suggesting building bullish momentum.
Volume Profile (VRVP) shows strong volume support around the 198.200–198.500 range, aligning with the trendline.
Support & Resistance
Support Zone: 198.200 (trendline confluence + volume shelf)
Immediate Resistance: 198.800–199.000
Major Resistance: 199.400 (next psychological level and prior high)
Forecast & Trade Idea (Educational Purpose)
If price continues to respect the ascending trendline and breaks above the recent local high (~198.750), we could see a bullish breakout toward 199.200+.
A bullish flag or small consolidation above the trendline before breakout is likely, as illustrated by the arrow.
Invalidation occurs if price breaks and closes below the trendline and 198.200, which may trigger a short-term correction.
✅ Conclusion
GBPJPY is currently in a bullish market structure with support from both trendline and volume profile. A clean breakout above 198.800 with volume confirmation could fuel continuation toward 199.200 and beyond. Risk management is crucial — watch for false breakouts or a shift in structure below the rising trendline.

GBPUSD Idea – Demand Zones & Potential Reversal Play🧠 MJTrading:
After a steady downtrend, GBPUSD is now approaching a strong 4H demand zone (Support 1), where we previously saw explosive bullish reactions.
Price is also extended from both EMAs, showing potential for a technical pullback or full reversal.
💡Scenarios to consider:
🔹 If Support 1 holds → we may see a bounce toward 1.3500+
🔹 If broken → Support 2 & 3 offer deeper liquidity and high-probability demand zones
👀 Watch for:
Bullish reversal candles (engulfing / hammer)
Bullish divergence on lower timeframes
Volume spikes on reaction
⚠️ Invalidation:
If Support 3 breaks with strong momentum, we might enter a bearish continuation phase.
#GBPUSD #Forex #ChartDesigner #SmartMoney #PriceAction #MJTrading #ForexSetup #TrendReversal #SupportZones

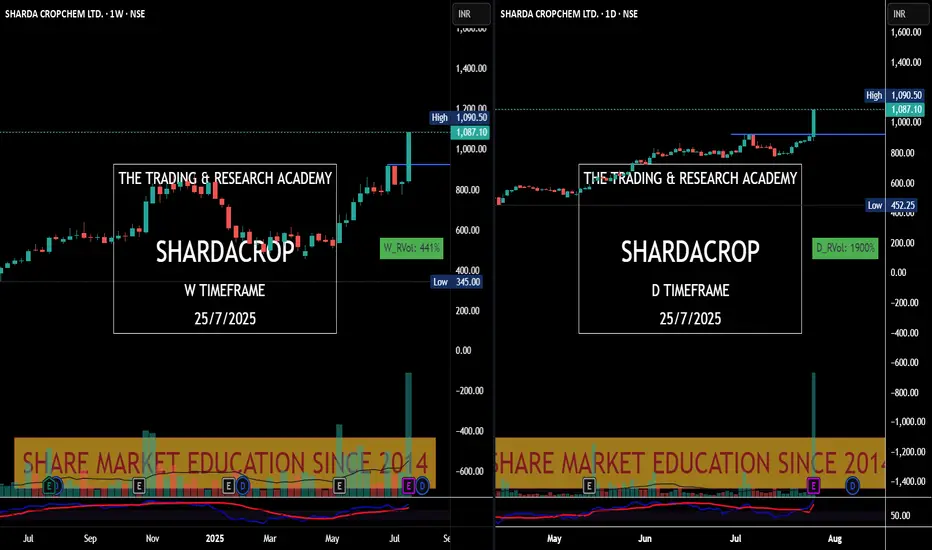
Charts Speak #Sharada Cropchem
Sharada Cropchem
Charts always lead the News! This is yet another example where price was leading & News came later.
Stock was under accumulation since June with higher qty. In fact since May 25, it was getting bought in average 2-3M qty weekly. What a planned buying..
28th May, 4 June, 18th July were nice buying alarms for us. Today it was just a final nail in the coffin.
Shriram Finance on Radar ! Bullish Setup !This is the daily chart of SHRIRAMFIN.
SHRIRAMFIN having a good law of polarity near at 580-600.
if this level is sustain then we may see higher prices in SHRIRAMFIN.
Thank You !!

Gold – Bear-to-Bull Transition in Motion?🧠 MJTrading:
TVC:GOLD – 8H Chart: Bulls, It’s Your Move.
📸 Viewing Tip:
🛠️ Some layout elements may shift depending on your screen size.
🔗 View the fixed high-resolution chart here:
The impulsive move from 3000 to 3500 wasn’t just a trend — it was a statement of strength.
That rally carved the ATH, then left behind weeks of digestion and structural compression.
Now, the market may be setting up for its next decision.
Notice how each bearish leg has been shrinking — a classic behavioral signal that sellers are losing momentum — possibly a shift in control underway.
We’re also pressing above the downtrend line from the ATH (3500), while the uptrend from 3000 remains clean and respected.
We’re now testing the 3400 zone — a key battleground.
📍 If bulls want to reclaim the momentum and show dominance, this is the moment to act.
🔹 1st Support: 3363–3377
🔹 2nd Support: Rising trendline
🎯 Target Zone: 3455–3500+ (Liquidity Pool & ATH proximity)
⚠️ Break back inside the triangle could delay the breakout narrative.
⚠️ If momentum fails to increase from here, and bulls can’t break out with conviction, the market is likely to remain range-bound for longer — extending the sideways phase between 3250–3500.
💭 If you’re watching for a new ATH… stay sharp, stay structured — the market rewards patience and readiness.
“If the structure speaks to you, let it echo, boost it.”
📐 MJTrading 🚀
What do you think?
#GoldAnalysis #XAUUSD #MarketStructure #LiquiditySweep #AnythingCanHappen
#MJTrading
#ChartDesigner
Psychology Always Matters:
Click on them for the caption...

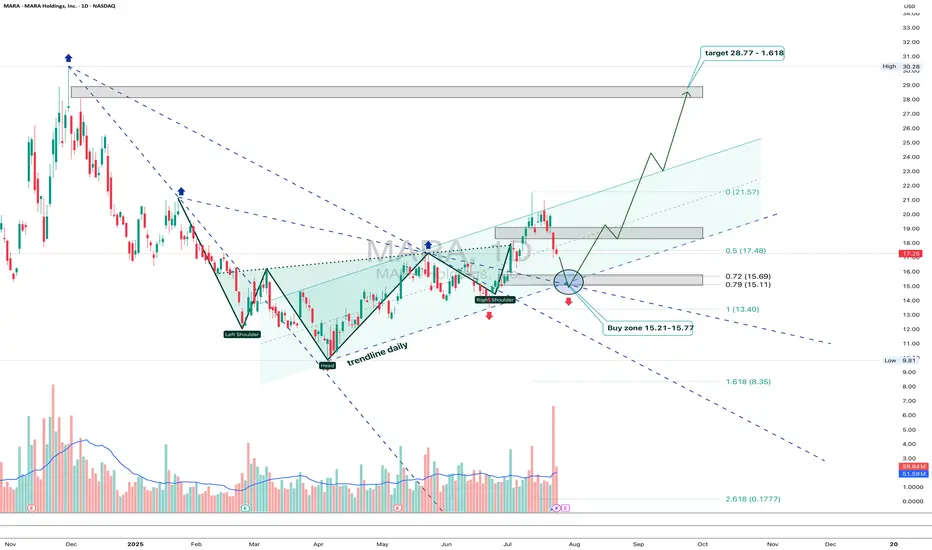
MARA: shoulders done, now walk toward the targetOn the daily chart, MARA completed a textbook inverse Head & Shoulders reversal with a clear breakout above the descending trendline. A corrective pullback followed, and the price is now heading into the key buy zone at 15.21–15.77 - aligning with the 0.72 and 0.79 Fibonacci retracements, and the upper boundary of the broken channel. This is the area to watch for a potential continuation of the bullish impulse.
Volume on the breakout was above average, confirming strong buyer interest. The EMAs are trending below the price, supporting the upward structure. The first target is located at 21.57 (previous resistance), with a potential extension to 28.77 (Fibonacci 1.618).
Fundamentally, MARA remains highly correlated with BTC and crypto sentiment. As interest returns to crypto-related assets due to ETF flows and possible Fed easing, mining stocks like MARA gain attention. Recent reports also show improved production efficiency and lowered costs - a tailwind for bulls.
Tactically, the best setup would be a confirmed reaction from the buy zone — whether a strong candlestick formation, volume surge, or reclaim of a key level. If that happens, aiming for 21.57 and 28.77 becomes a solid plan.
The pattern played out - now it's time for the market to walk the talk.
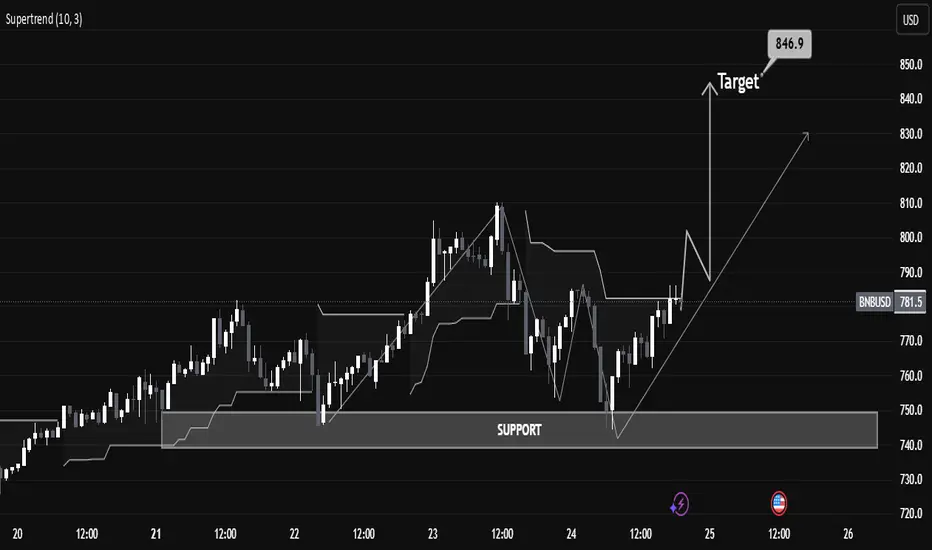
“BNBUSD Educational Breakdown – Support Rejection “BNBUSD Educational Breakdown – Support Rejection with $846 Target in Sight”
Market Structure Overview:
BNBUSD is exhibiting a bullish market structure after forming a textbook higher low at the major demand zone near $740–$750. This zone has been historically significant, offering strong rejections and triggering aggressive bullish rallies.
A new bullish wave appears to be forming after price respected the ascending trendline and reclaimed the supertrend level, now acting as dynamic support around $782.2.
⸻
🔧 Technical Confluences:
• Support Zone: Highlighted between $738–$750, serving as a demand base. Recent price rejection here confirms buyers’ dominance.
• Trendline Support: Price has respected an ascending trendline, signaling short-term trend continuation.
• Supertrend Confirmation: Trend flip has occurred—price is now trading above the Supertrend line, indicating a fresh bullish momentum phase.
• Break of Structure (BoS): Minor resistance around $784–$790 was breached, suggesting bullish continuation.
⸻
🎯 Target Projection:
Using recent swing highs and market symmetry, the next logical resistance lies at $846.9, aligning with the previous supply zone. This target also fits within the measured move from the support base to previous highs.
⸻
📈 Trade Plan (Educational Only):
• Long Bias Zone: Between $770–$780
• Invalidation Level: Below $738 (loss of support structure)
• Target: $846.9
• Risk-Reward: Roughly 1:2.5 – favorable for swing traders
⸻
📚 Educational Note:
This chart is an excellent example of:
• Structure trading (support/resistance)
• Trend confirmation using a dynamic indicator (Supertrend)
• Risk-managed entries with clearly defined stop-loss and take-profit zones.
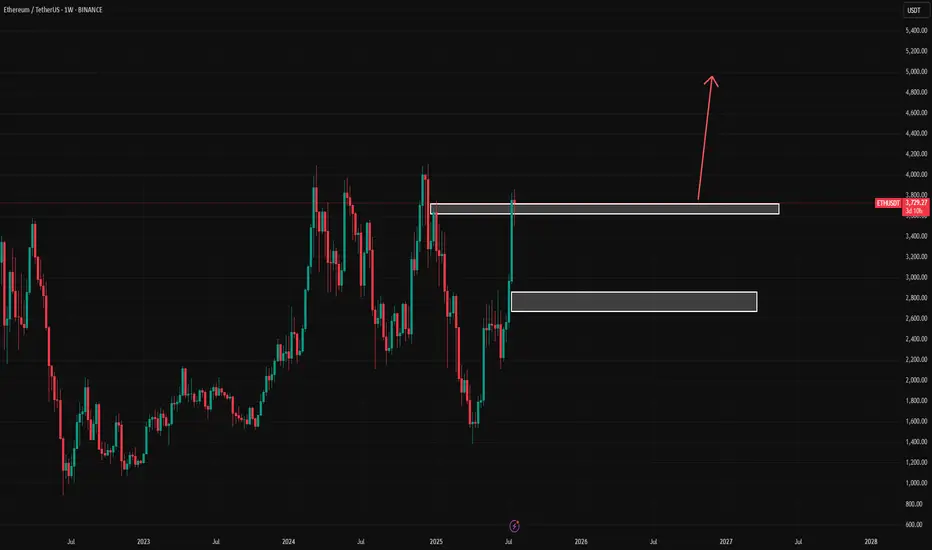
ETH/USDTHello friends, my analysis for Ethereum is bullish and I think it will continue its recent gains. What do you think?
Visa: Waiting in the Wings Visa has entered a phase of sideways consolidation — but this does not affect our primary scenario. We continue to see the stock moving within magenta wave , which is expected to complete the larger turquoise wave 4 inside our turquoise Target Zone between $308.09 and $292.19. After that, we anticipate a renewed upward impulse. Turquoise wave 5 should then push the stock beyond the resistance levels at $375.51 and $394.49. Meanwhile, we are keeping two alternatives on our radar. The first has a 35% probability and assumes the correction is already over, meaning turquoise wave alt.4 is complete. The second is a more bearish scenario (32% probability) visible on the daily chart. It suggests that the high of green wave alt. may already be in, which would imply that the ongoing alt. wave is headed toward a lower low below the $234.30 support level.
📈 Over 190 precise analyses, clear entry points, and defined Target Zones - that's what we do (for more: look to the right).

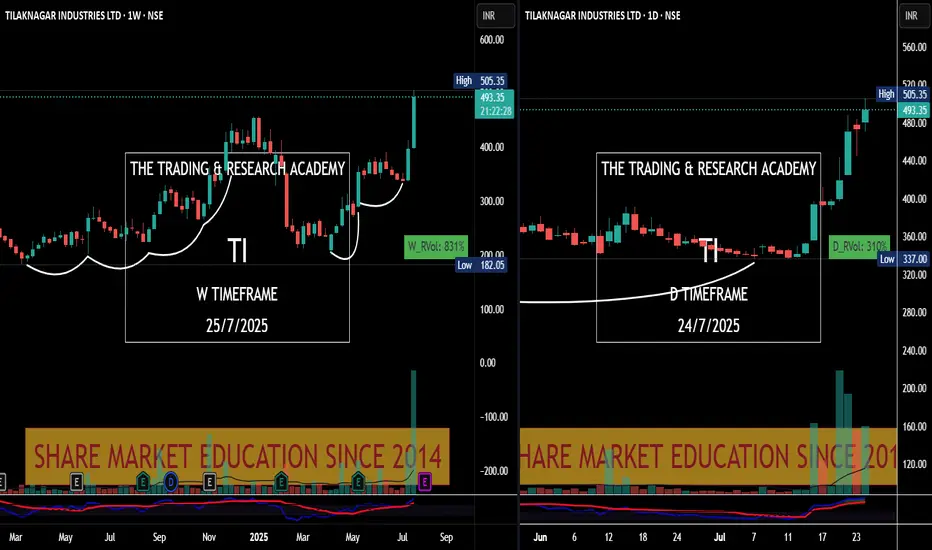
Chart Speaks- Tilak Nagar Ind
#Price leads the #News! Tilak Nagar Ind #tilaknagar see the chart v/s News.
News came yesterday, have a look at chart. Someone was accumulating it since long.
Chart Speaks