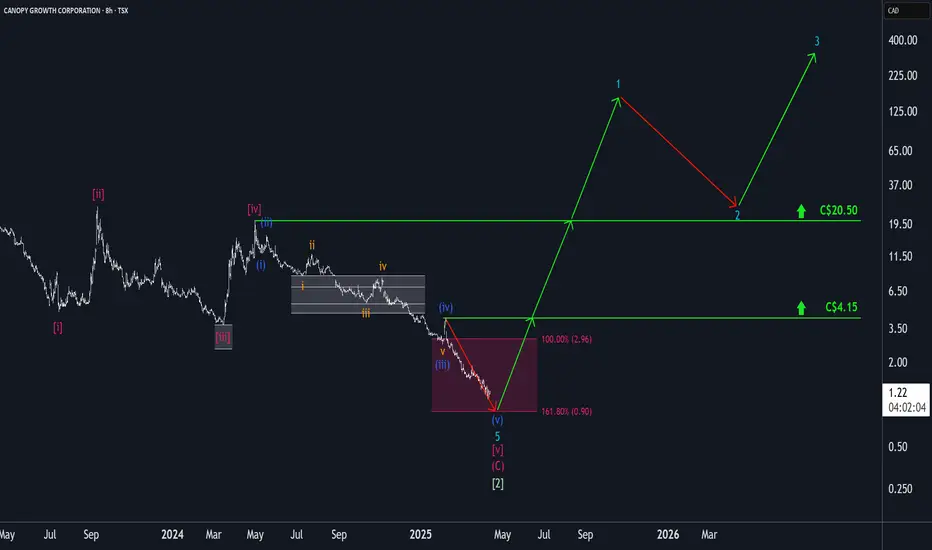
Canopy Growth: Some Room Left...WEED has continued to move downward within the magenta Target Zone between C$2.96 and C$0.90, and it is now trading in the lower quarter of this range. Currently, the stock should be working on a blue five-wave move and should soon reach the low of wave (v), thus completing this structure and also the large green wave . Primarily, we still grant the stock some more room to fully utilize the Target Zone, but a trend reversal should be initiated with the low. Afterward, the high from April 29, 2024, at C$20.50 should be exceeded during the turquoise wave 1.
Chartanalysis
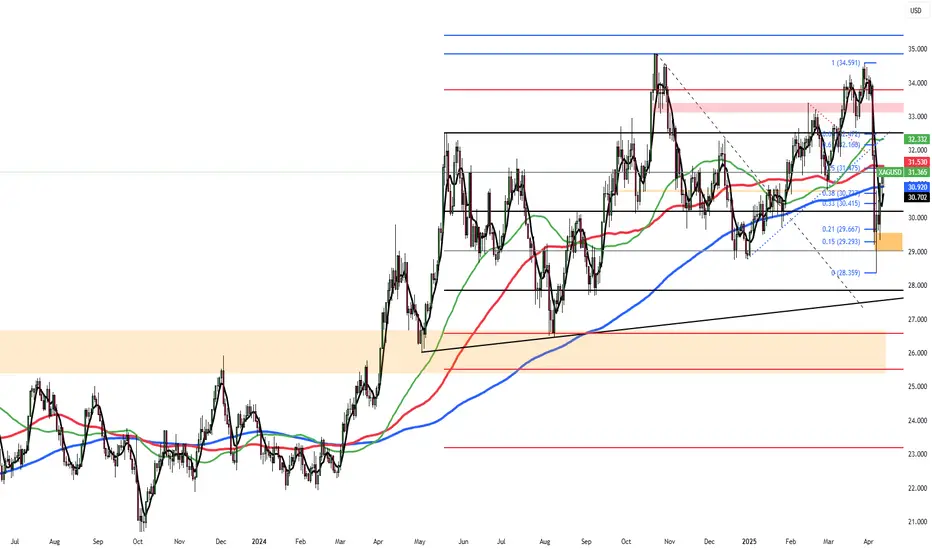
XAG/USD Climbs on FOMC WorriesSilver prices climbed above $31 per ounce on Thursday, extending gains for a second straight session as commodities rebounded following President Trump’s rollback of his reciprocal tariff policy. The new measure lowers tariffs on most trade partners to 10% for 90 days to support negotiations. However, China, a key silver consumer, still faces a steep 125% tariff, keeping geopolitical tensions elevated and sustaining safe-haven demand. Meanwhile, FOMC minutes revealed growing concerns about stagflation and the impact of Trump’s trade agenda on the Fed’s dual mandate of price stability and full employment.
Resistance starts at 31.50; if breached, the next levels are 32.15 and 33.30. Support sits at 30.20, with 29.50 and 29.20 below if that level gives way.
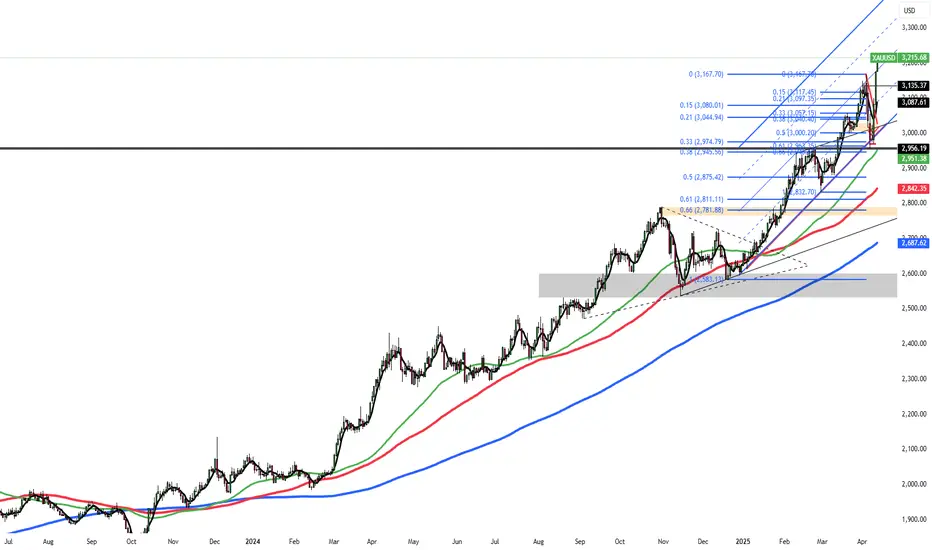
Gold Surges, Hits Record Above $3,200Gold spiked to a new record above $3,200 per ounce on Friday, driven by safe-haven demand and a weakening dollar amid intensifying U.S.-China trade tensions. The U.S. hiked tariffs on China to 145%, while easing duties for other partners. At the same time, U.S. consumer prices unexpectedly fell in March, fueling bets on a Fed rate cut in June and a full percentage point cut by year-end. Despite this, inflation risks remain due to ongoing tariff pressure. Gold is set for its strongest weekly gain since November.
Key resistance is at $3,250, followed by $3,300 and $3,350. Support stands at $3165, then $3135 and $3090.
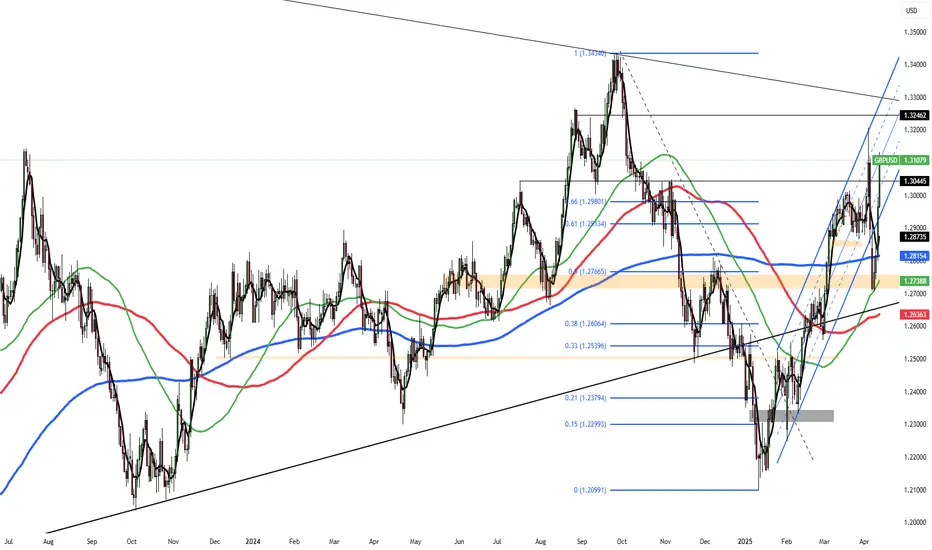
Pound Gains on Dollar Softening, GBP/USD at $1.30The pound extended gains to $1.30 for a third session, as the dollar softened following Trump’s 90-day tariff pause for most countries. However, the 145% hike on Chinese goods kept risks elevated. While volatility persists, traders now expect 66 bps of BoE rate cuts this year, down from 79 bps a day earlier. UK GDP is forecast to grow 0.1% in February, suggesting a slow recovery.
If GBP/USD breaks above 1.3050, resistance levels are at 1.3100 and 1.3200. Support is at 1.2960, followed by 1.2900 and 1.2850.
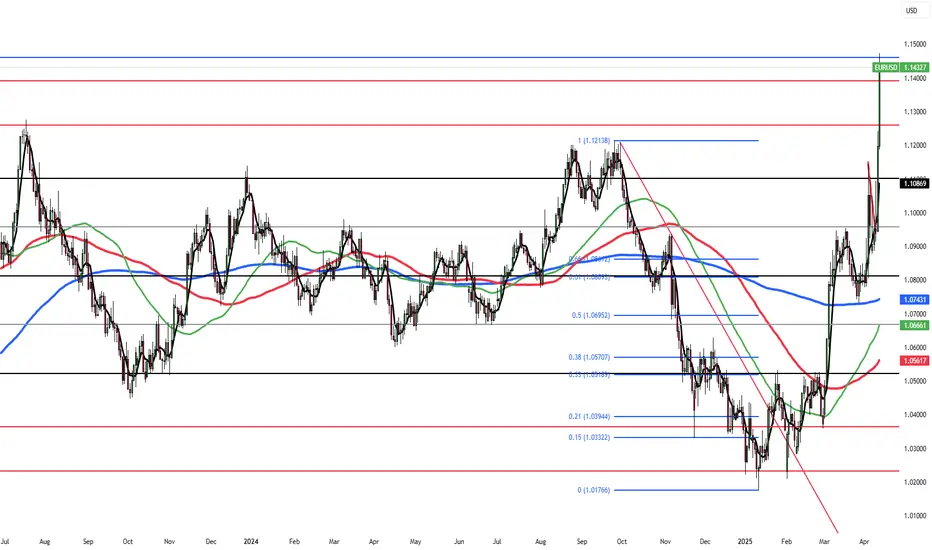
EU Tariff Relief Drives Euro Above $1.13The euro climbed above $1.13, its highest since September 2024, after the EU suspended new U.S. tariffs for 90 days to allow trade talks. This followed President Trump’s move to cut tariffs to 10% for non-retaliating countries while raising Chinese duties to 125%. While easing global slowdown fears, the mixed signals fueled uncertainty. Money markets adjusted ECB expectations, pricing the deposit rate at 1.8% by December, up from 1.65%, and lowered the probability of an April cut to 90%.
Key resistance is at 1.1390, followed by 1.1425 and 1.1500. Support lies at 1.1260, then 1.1180, and 1.1100.
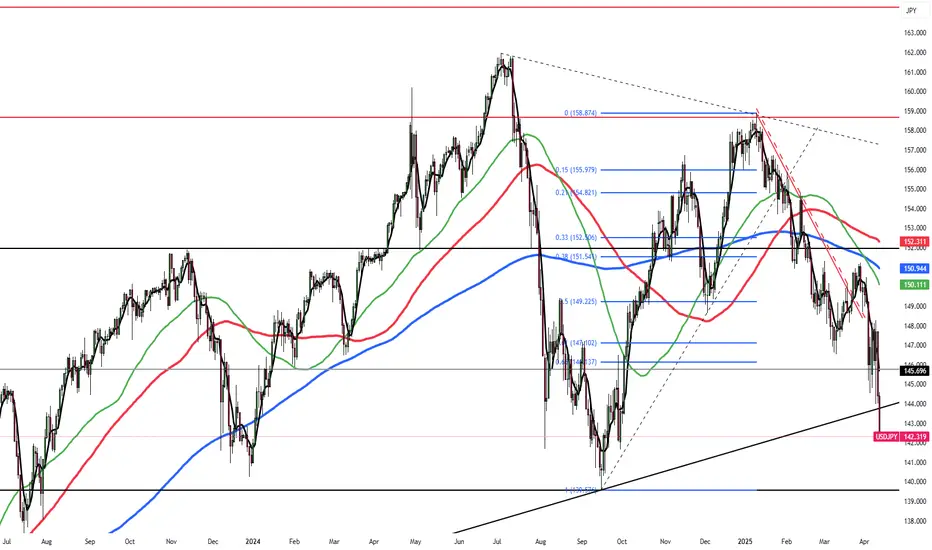
Yen Gains on Recession FearsThe yen rose past 144 per dollar, a six-month high, as U.S. recession fears and a Treasury selloff boosted demand for safe-haven assets. Although Trump paused new tariffs for 90 days, total U.S. tariffs on China now stand at 145%, prompting retaliation with China imposing 84% tariffs on U.S. goods. The U.S.-Japan trade outlook remains in focus, with Japan still facing a 10% U.S. tariff but seeking better terms.
Key resistance is at 145.80, with further levels at 148.00 and 152.70. Support stands at 142.00, followed by 139.65 and 138.00.
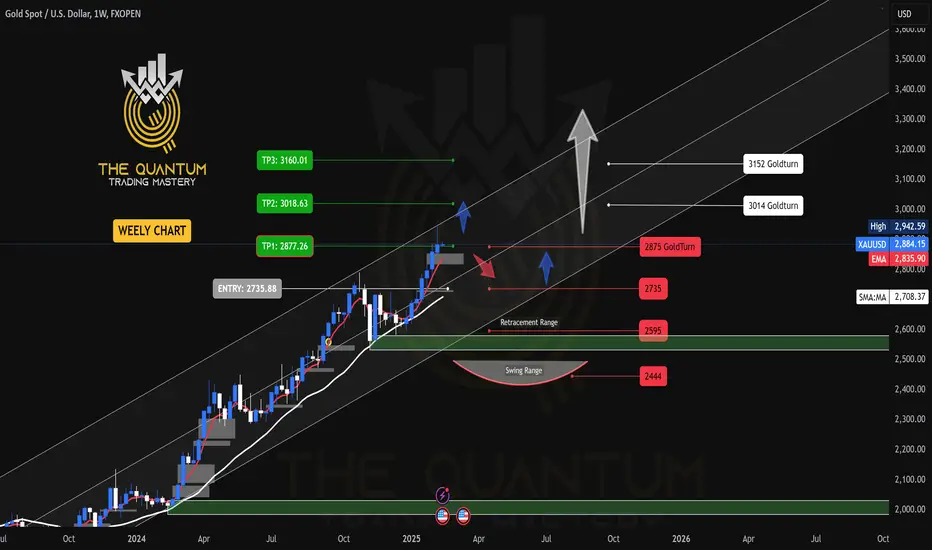
GOLD WEEKLY CHART MID/LONG TERM ROUTE MAP UDPATEDWeekly GOLD Analysis – Quantum Trading Mastery
Hello Everyone,
Here’s the latest update on the GOLD weekly chart we’ve been diligently tracking and trading. Below is a comprehensive breakdown of the current range and key levels we’ve identified.
Recap of Last Week’s Analysis:
Last week, our predictions aligned perfectly with market movements:
* A strong resistance level at 2790 caused a short-term reversal near 2735.
* The FVG acted as dynamic support at 2735, sustaining the bullish momentum.
* The EMA5 crossed and locked above the key level at 2735, solidifying upward movement.
* As predicted, the resistance was broken, leading to a new all-time high of 2817.
Our analysis delivered precise predictions, allowing you to trade confidently and minimize risks.
What’s Next for GOLD This Week?
Key Level: 2735
Bullish Targets:
* TP1: 2877
* TP2: 3018
* TP3: 3160
Bearish Targets:
* 2735
* 2680
* 2595
This week, we have identified two critical GOLDTURN levels at 2735 and 2595. While we anticipate GOLD reaching TP1 at 2877, there may be short-term reversals around these key levels and GOLDTURN zones.
Recommendations:
To better understand the support structure and identify optimal dip-buying opportunities, review our smaller time-frame analyses (daily, 12H, 4H, and 1H). These insights will help you navigate the market with precision, keeping long-term gaps in perspective.
We’ll continue to provide daily updates and insights to keep you informed.
Thank you for your continued support! Don’t forget to like, comment, and share this post to help others benefit as well.
The Quantum Trading Mastery

GOLD WEEKLY CHART MID/LONG RANGE ROUTE MAP UPDATEDWeekly GOLD Analysis: 17th February 2025
Hello Traders,
Here’s a weekly chart analysis of GOLD, offering an in-depth look at recent market trends and future outlook. Since October 2023, our consistent tracking has achieved 100% target accuracy, as shown by the Golden Circle markers on the charts. Let’s break down the highlights and what’s next.
Recap of Last Week’s Successes
Weekly Chart Highlights:
* EMA5 crossed and settled above Entry ✅ 2735 reached
* Bullish Target TP1: 2877 ✅ Achieved
* GoldTurn Levels at 2875 activated twice ✅ Reached
What’s Next for GOLD? Bullish or Bearish?
After hitting ENTRY LEVELS at 2735 and TP1 2877, we saw a small close above 2877 last week, leaving 3018 open as a potential target. We mentioned that an EMA5 lock would confirm this movement.
While EMA5 hasn’t locked yet, the close from last week provided a solid push upward, gaining over 500 pips. The long-term gap remains open, with more movement likely after last week’s candle body close.
Key Level: 2735 remains a critical zone.
GoldTurn Levels at 2875 and 2735 are active, and the price may revisit these levels before bouncing back to reach TP1 and beyond.
Recommendations & Strategy:
* Focus on EMA5: Watch its behavior around 2877 for key signals on short- and long-term trades.
* Support Levels: GoldTurn levels at 2875 and 2735 are vital for identifying reversal points and prime dip-buying opportunities.
* FVG Support: A range between 2835 and 2850 is also supportive.
For precise entry and exit points, check our daily, 12H, 4H, and 1H analyses for clearer market guidance.
We’ll continue to provide daily updates, insights, and strategies on our TradingView and YouTube channels every Sunday. Don’t forget to like, comment, and share to support our work and help others benefit!
The Quantum Trading Mastery
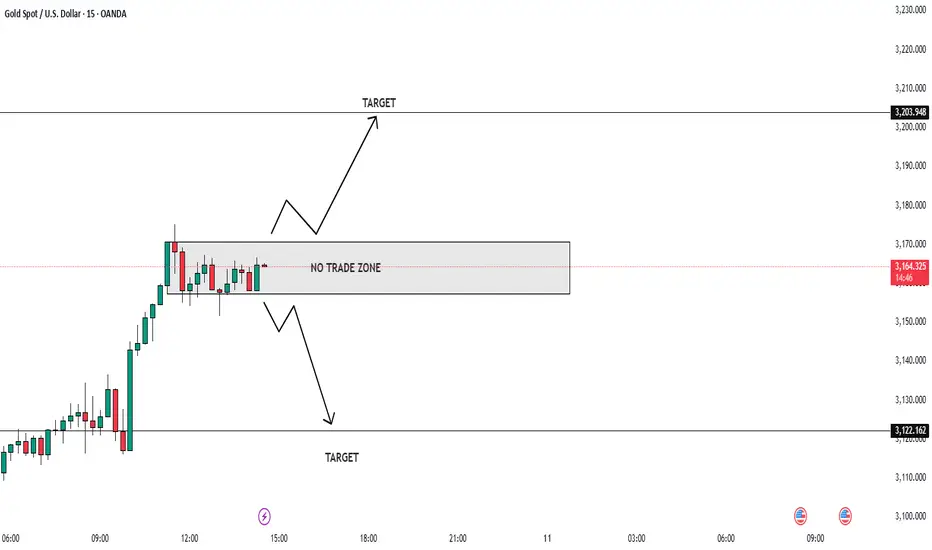
XAUUSD Alert: Critical Zones in Play — Trade Smart, Trade Safe!📊 XAUUSD Market Insight 🌍
Gold is heating up once again, currently testing a tight range between 3160 and 3174. A breakout in either direction could set the tone for the next big move.
🔻 If price breaks below, we may see a slide toward 3150 and 3130—potential areas to watch for bearish momentum.
🔺 However, a strong push above 3174 could spark bullish energy, aiming for short-term targets at 3200 and 3227.
💡 Trade Smart
The market is full of opportunity, but don’t forget: risk management is key. Use proper position sizing, set clear stop-losses, and never overexpose your capital. Stay sharp, trade safe, and let the market come to you. 🧠💼
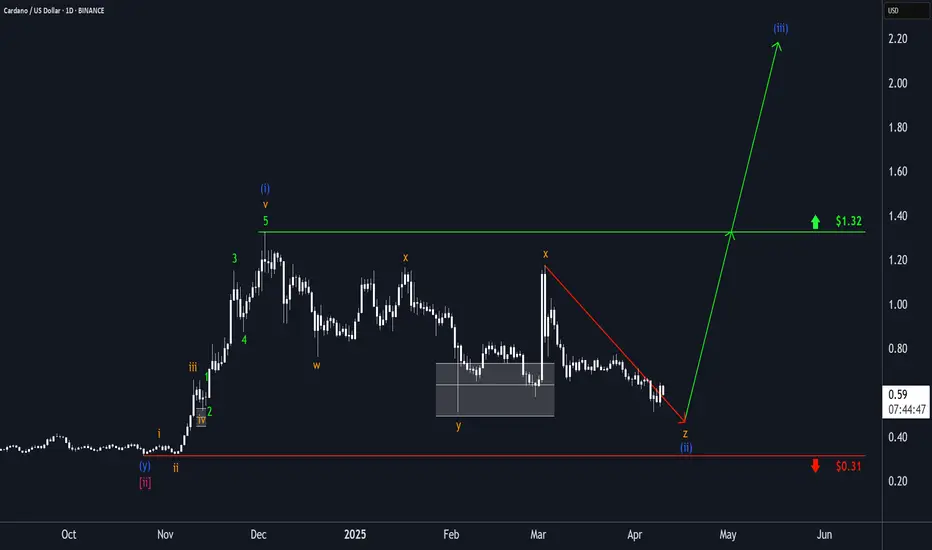
Cardano: New Low or Off We Go?!For Cardano, we primarily still expect a new low in the blue wave (ii), but the price should stay above the support at $0.31. Once the wave (ii) corrective movement is completed – which theoretically could have already happened – the blue wave (iii) should drive the price significantly above the resistance at $1.32.
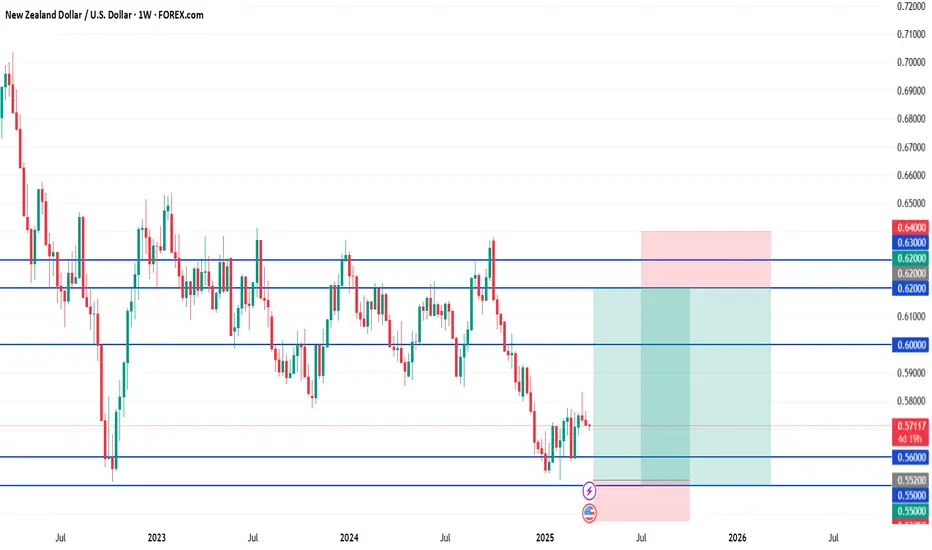
NZDUSD Long✅ NZD/USD Long Setup
Entry: 0.5520
Stop Loss (SL): 0.5375 (below historical multi-decade support and spike lows — gives room for volatility)
Take Profits (TPs):
TP1: 0.6000 (psychological + historical S/R level)
TP2: 0.6200 (structural supply level)
TP3: 0.6400 (historical resistance zone + cycle high area)

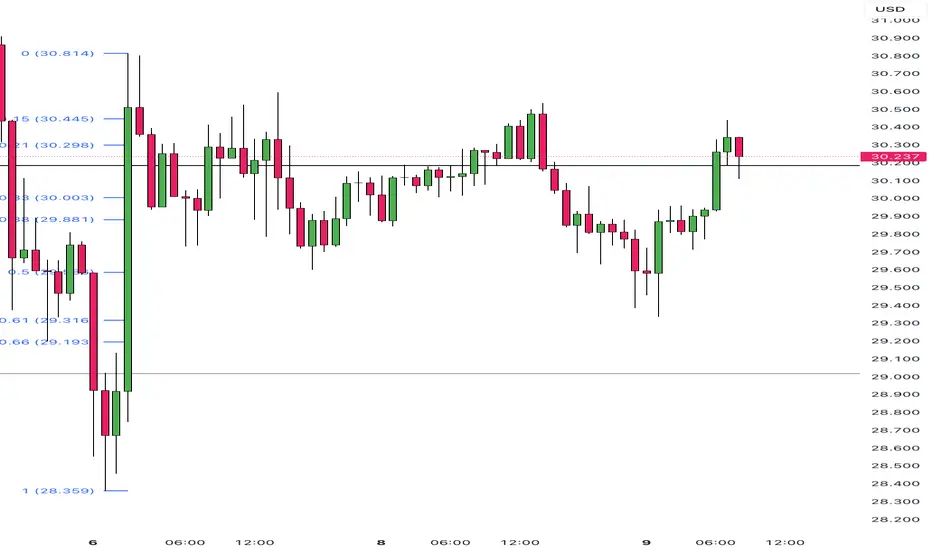
Silver Remains Volatile Amid Trade War and Recession FearsSilver stayed above $30.50 per ounce on strong safe-haven demand amid U.S.-China trade tensions. Prices held a 3.5% gain after President Trump announced a 90-day tariff pause and a 10% rate for all but China, which now faces a 125% tariff. China raised tariffs on U.S. goods to 84%, and the EU approved duties on €21 billion of American exports. Fed minutes showed concerns about stagflation and the impact of Trump’s trade policies. Markets now await March U.S. inflation data on Thursday for clues on the Fed’s next move.
Technically, the first resistance level is located at 31.50. In case of its breach 32.15 and 33.30 could be monitored respectively. On the downside, the first support is at 30.20. 29.50 and 29.20 would become the next support levels if this level is passed.

Gold Jumps 3% on U.S.-China Tariff BattleGold jumped over 3% to above $3,095 per ounce on Wednesday as U.S.-China trade tensions escalated. President Trump announced a 90-day tariff pause and a reduced 10% rate for all but China, which now faces a 125% tariff. Treasury Secretary Bessent said the lower rate would apply during talks, excluding China and some sectors. In response, China raised tariffs on U.S. goods to 84%, and the EU approved levies on €21 billion worth of American exports. Fed minutes showed policymakers expect higher inflation from tariffs but remain uncertain about its scale and duration.
Supporting gold’s rally further, the World Gold Council reported that gold-backed ETFs attracted 226.5 metric tons in inflows during Q1, totaling $21.1 billion in value.
Key resistance is at $3,135, followed by $3,165 and $3,200. Support stands at $3030, then $3010 and $2956.

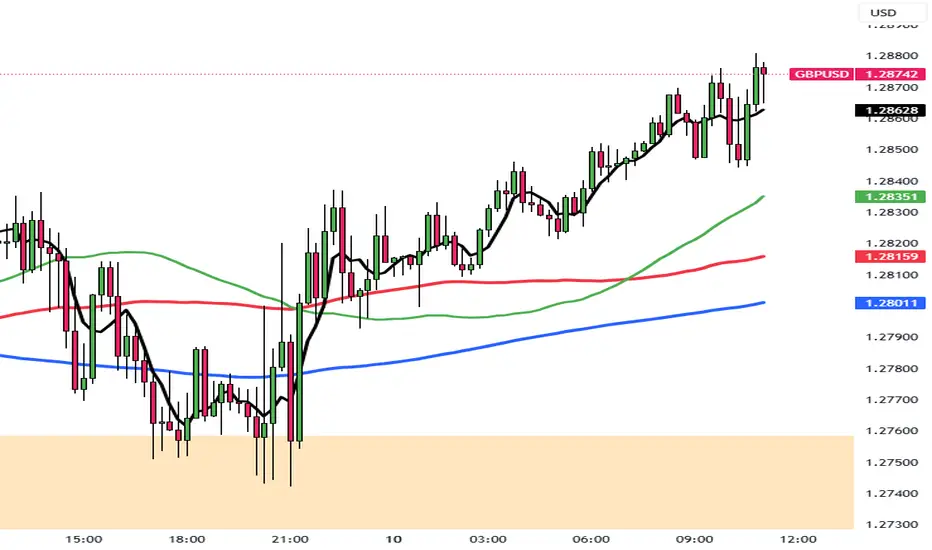
GBP/USD Awaits CPI After Tariff-Driven GainGBP/USD hovered near 1.2830 on Thursday morning, holding its upward momentum for a third straight session. The pair remained supported as market sentiment improved following Trump’s tariff pause. All eyes are now on today’s U.S. inflation data, which is expected to influence the next move.
If GBP/USD breaks above 1.2860, resistance levels are at 1.2900 and 1.2940. Support is at 1.2715, followed by 1.2650 and 1.2600.
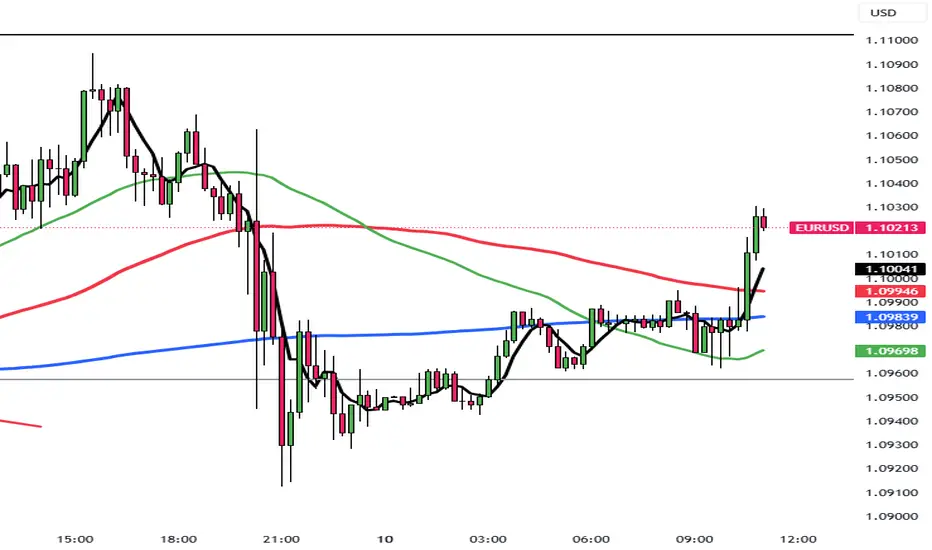
Euro Steady as EU Retaliates on TariffsThe euro hovered around 1.0980 on Thursday, supported by rising trade tensions and renewed political stability in the Eurozone. Sentiment favored the currency after China raised tariffs on all U.S. goods to 84% from 34%, retaliating against Washington’s hike to 104% on Chinese imports. The European Commission also approved retaliatory tariffs on €21 billion worth of U.S. goods, including soybeans, motorcycles, and orange juice. The escalation pushed investors away from typical safe havens like the dollar and Treasuries. Political stability in Germany further supported the euro, as the CDU/CSU and SPD finalized a coalition, clearing the way for Friedrich Merz to become Chancellor next month. The ECB is also expected to cut rates by 25 basis points later this month.
Key resistance is at 1.1020, followed by 1.1100 and 1.1150. Support lies at 1.0880, then 1.0810 and 1.0730.
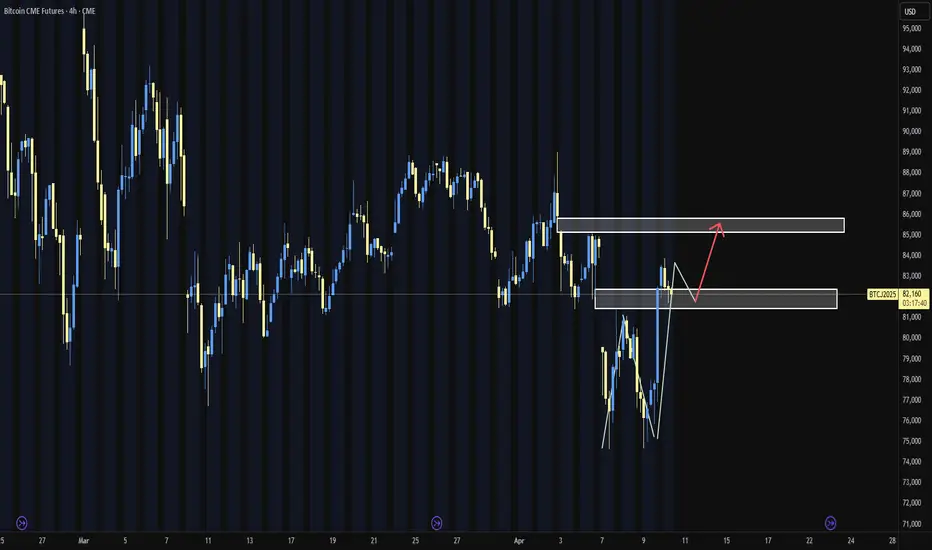
ETH/USDTbtc $85k is high liquidation and cme gap zone.
once these tariff headlines slow down bitcoin will be pulled toward these magnet levels
EUR/CHF Bullish Reversal Setup – Support Zone Entry with 1:4 Ris1. Trend & EMAs:
The EMA 200 (blue) and EMA 30 (red) are displayed.
Price is below both EMAs, indicating a bearish trend overall.
However, there's a potential reversal or retracement trade being considered.
2. Trade Setup (Long Position):
Entry Point: 0.92750
Stop Loss: 0.92526 (about 22.4 pips below entry)
Target (Take Profit): 0.93643 (about 89.3 pips above entry)
Risk-Reward Ratio (RRR): Approx. 1:4, which is favorable
3. Support & Resistance:
The entry zone is based on a demand/support area where price previously bounced.
The target

SUI: Toward All-Time Low?SUI broke the support at $1.97 and tested it once again from below with yesterday's brief countermovement. It should now proceed downward so that the turquoise corrective wave 2 can be properly completed. Subsequently, the turquoise impulse wave 3 should provide new upward momentum, racing toward new all-time highs. The resistance at $5.36 should only be a milestone.

#NEIROETHUSDT maintains bearish momentum❗️Keep an eye on the BYBIT:NEIROETHUSDT.P — the structure suggests a possible local rebound or a breakout of the wedge to the upside. Opening a short here goes against the structure and lacks confirmation
📉 SHORT BYBIT:NEIROETHUSDT.P from $0.01612
🛡 Stop loss $0.01693
🕒 Timeframe: 1H
✅ Overview:
➡️ The chart shows BYBIT:NEIROETHUSDT.P forming a bearish continuation move after breaking out of a consolidation range.
➡️ Entry at $0.01612 corresponds to a retest of former support turned resistance.
➡️ Selling volume is increasing, supporting bearish pressure.
➡️ The POC level at $0.02084 remains far above the current price, highlighting downward imbalance.
🎯 TP Targets:
💎 TP 1: $0.01586
💎 TP 2: $0.01535
💎 TP 3: $0.01500
📢 Additional scenario notes:
📢 A false breakout above the entry zone is possible — wait for confirmation of the $0.01620 break.
📢 Watch for volume spikes near TP1 and TP2 — could signal partial take profits.
📢 If price reclaims $0.01693, the setup becomes invalid.
🚀 BYBIT:NEIROETHUSDT.P maintains bearish momentum — downside move expected!

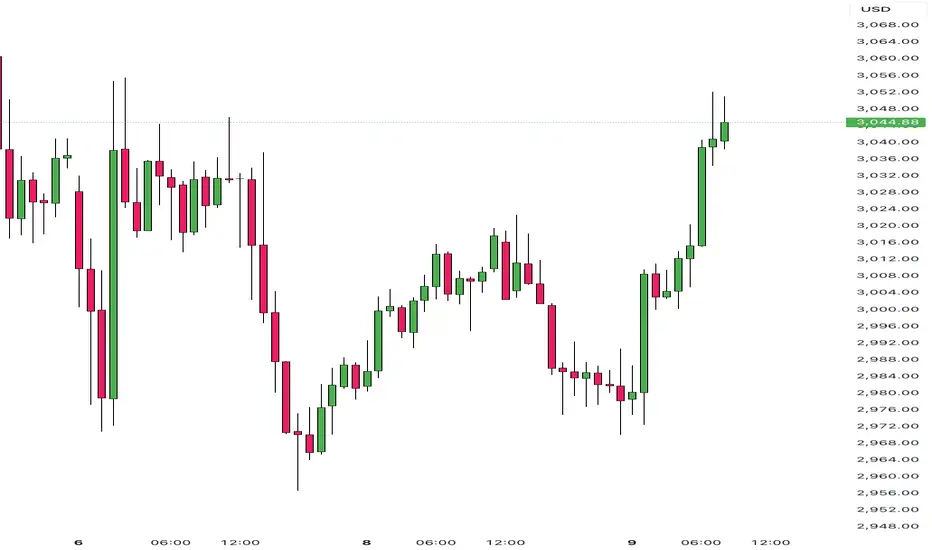
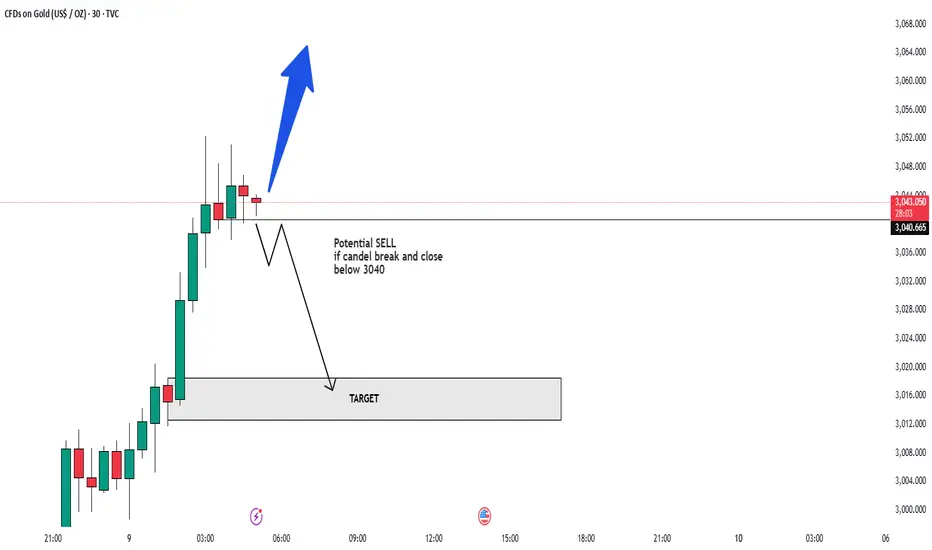
WILL GOLD PUMP AGAIN IN FOMC NEWS ALERT🚨 XAUUSD Market Update! 🚨
Gold is on the move, battling key levels between 3040! Will we see a breakout soon? 🔥
Bearish Watch: If the price drops below this range, we could target 3015 and 3020. ⚠️
Bullish Opportunity: A break above 3042 could signal a buying surge, with targets set at and 3100. 🚀
💬 What’s Your Move? Join the conversation and share your thoughts! Let’s navigate this golden opportunity together and aim for new highs! 💰
Yields and Trade Wars Induce Silver InstabilitySilver dropped below $30 per ounce, hitting $29.57 on April 4, its lowest since mid-January, as rising U.S. Treasury yields made non-yielding assets less attractive. The U.S. announced a 104% tariff on Chinese imports starting at midnight, intensifying trade war concerns. Although over 70 countries have reportedly requested tariff relief, market sentiment remains cautious. The EU’s retaliatory tariff plans further fueled risk aversion, pressuring industrial metals. Still, expectations of Fed rate cuts and safe-haven demand offer some support.
Technically, the first resistance level is located at 30.90. In case of its breach, 31.40 and 32.50 could be monitored respectively. On the downside, first support is at 29.00. 28.40 and 27.50 would become the next support levels if this level is passed.
Gold Experiences Surge with Economic FearsGold soared to around $3,000 per ounce as investors sought refuge from intensifying trade war concerns and recession risks. The U.S. confirmed a new round of tariffs with no exemptions, China faces a record 104% hike. Trump also warned of a forthcoming pharmaceutical import tariff. The market is now focused on the Fed's March meeting minutes, set for release later today, for potential rate cut clues. Ongoing central bank purchases and strong ETF demand, China’s ETF added 233,000 ounces, also supported the rally.
Key resistance is at $3,035, followed by $3,085 and $3,105. Support stands at $2,956, then $2,930 and $2830.