EUR/USD – Buy Setup Analysis (1H Chart)EUR/USD – Buy Setup Analysis (1H Chart)
📈 **Trend**: Uptrend
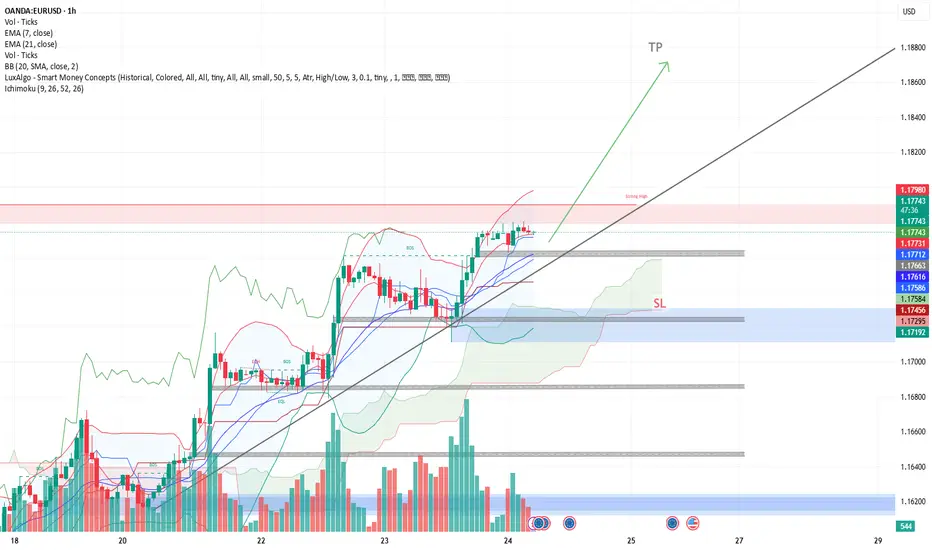
The pair is respecting the ascending trendline and is trading above both the EMA 7 and EMA 21, indicating bullish momentum.
**🔹 Long Setup**
* **Entry:** Around 1.1774 (current price)
* **Stop-Loss (SL):** 1.1731 (below trendline & EMAs)
* **Take-Profit (TP):** 1.1872 (based on recent swing high)
**🔎 Technical Signals**
* Price is forming higher highs and higher lows.
* Strong volume surge on bullish candles.
* EMA crossover (7 > 21) supports continuation.
**Conclusion**
As long as EUR/USD holds above the trendline and the EMAs, the bullish setup remains valid. A break below 1.1730 would invalidate this outlook.
Chartanalysis
S&P500: Rally ContinuesYesterday, the S&P 500 managed to notch modest gains once again. In line with our primary scenario, the ongoing magenta wave (B) is likely to continue climbing toward resistance at 6,675 points. Once this corrective upswing reaches its peak—still below that level—we anticipate a pullback as part of wave (C), which should drive the index below support at 5,127 points. Beneath this threshold, our green long Target Zone spans from 4,988 to 4,763 points. We expect the low of wave (C) and the conclusion of the broader green wave to occur within this range. From there, a sustained rally is expected to unfold in wave , which should lift the index above resistance at 6,675 points and complete the cyclical blue wave (III). As a result, this price range can be considered for long entries. The alternative scenario, which calls for a direct breakout above the 6,675-point level without a prior pullback, remains in play with a 40% probability.
📈 Over 190 precise analyses, clear entry points, and defined Target Zones - that's what we do (for more: look to the right).

Educational EUR/USD Chart Breakdown – Price Action at Key LevelsEducational EUR/USD Chart Breakdown – Price Action at Key Levels
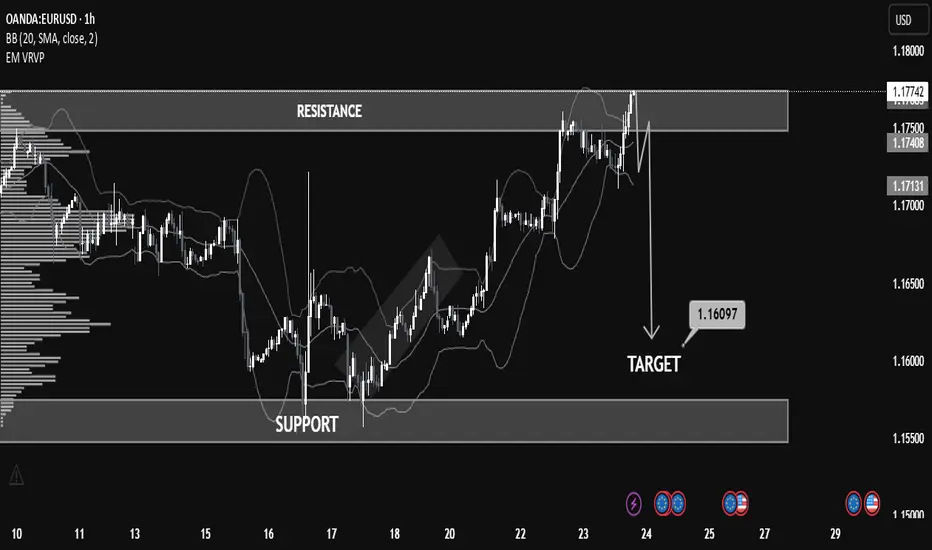
This EUR/USD (1-hour) chart provides a great example of how support and resistance zones, combined with price action and indicators like Bollinger Bands, can help anticipate market moves.
🔹 Resistance Zone Tested:
The pair recently approached the 1.17500–1.17800 resistance zone. This level had previously acted as a supply zone, and price once again showed rejection here, indicating selling pressure.
🔹 Bollinger Band Overextension:
Notice how the price extended beyond the upper Bollinger Band—this often signals that the market is overbought in the short term, leading to a potential reversal or correction.
🔹 Bearish Reaction & Target:
After rejection from resistance, the chart outlines a bearish move with a target at 1.16097. This level lies just above the next strong support zone (1.15500–1.16100), offering a realistic area for price to stabilize if the downtrend continues.
🔹 What to Learn:
Support & Resistance: Prices often react at key zones; previous resistance can turn into support and vice versa.
Confluence Tools: Use indicators like Bollinger Bands with price structure to increase confidence.
Target Planning: Identify likely reaction zones for risk management and profit-taking.
📚 Summary
This setup is a clean example of trading within a range and using technical confluence to plan entries and exits. If price breaks below 1.17130 with strong momentum, the probability increases for the market to reach the 1.16097 target.
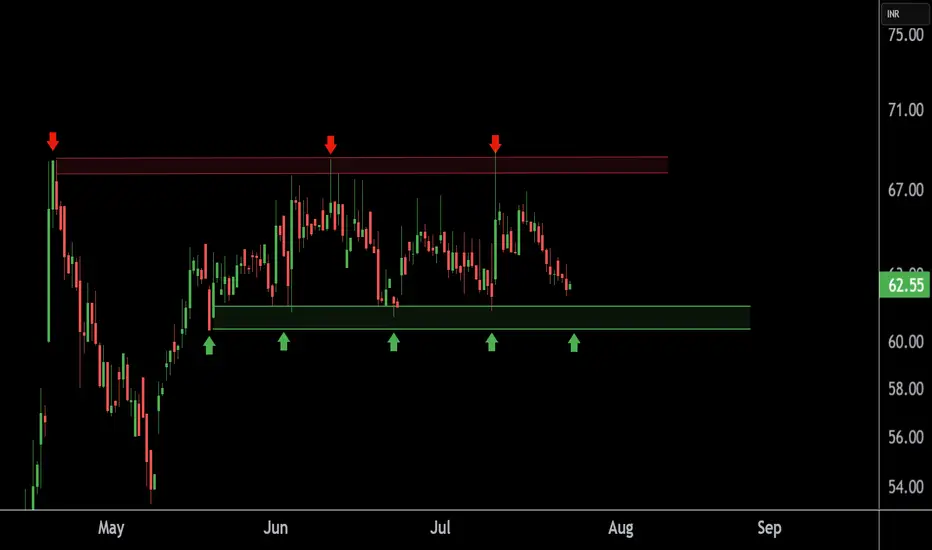
TEXMOPIPE Chart Speaks Strength – Buying Opportunity Near SupporThis is the 4 hour chart of TEXMOPIPES.
TEXMOPIPES having a good support zone near at 60 level.
If this level is sustain , then we may see higher prices in TEXMOPIPES.
Thank You !!
The Bessent Effect: Part I-Challenge the FedThe Bessent Effect: Part I-Challenge the Fed
Originally posted on June 30th, 2025, but it was removed by a moderator — I misinterpreted the posting guidelines (I tend to read a little too deep between the lines sometimes).
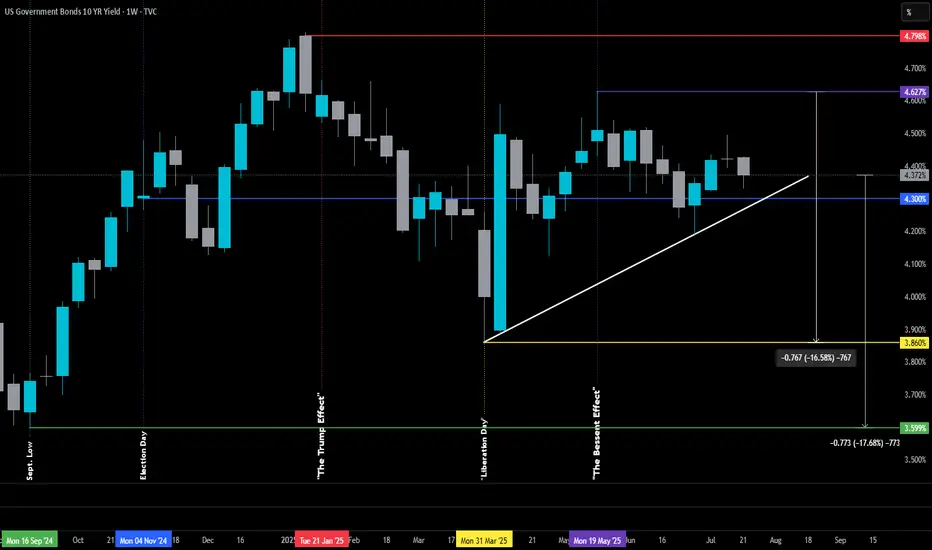
For context, the original version didn’t include the White or Green lines.
June 30th post:
The 10-year Treasury yield is the heartbeat of commercial lending — it’s what sets the tone for everything from real estate financing to economic sentiment. And interestingly, it’s now hovering right around the same level it was on Election Day 2024 (Blue Line), which feels like a lifetime ago in policy terms.
So what’s happened since then? Quite a bit.
Yields peaked the week before Inauguration Day (Red Line), then began a steady decline — until we were hit with what can only be described as "Liberation Day Tariff Whiplash."
The tariffs, announced in early April (Yellow Line), spooked the markets — particularly the ever-watchful Real Money Investors (think central banks, pension funds, and the ruthless whales). Their reaction? A spike in the 10-year, as they scrambled to reassess risk and reposition.
Plot twist: Trump’s unleashing of Scott Bessent.
Since stepping into the role of Treasury Secretary, Bessent has taken the reins of U.S. economic diplomacy. By late May (Purple Line), he was already deep in talks at the G7 meeting in Banff, hashing out trade dynamics and currency cooperation with global finance leaders. And — perhaps not so coincidentally — since then, the 10-year has been on the decline again, even as the Fed remains firm in its refusal to cut rates.
Here’s the big takeaway: there's a strong chance we could see rates — the ones that actually move the real estate market and reflect how the “real players” feel — drift back down to their pre-tariff levels. That is, before Tariff Derangement Syndrome set in. And probably before they shoot back up to the peaks we saw just as Trump returned to the White House.
In short: the 10-year might be hinting that the worst isn't over — but we could be in for a stretch of green pastures before we hit the next storm.
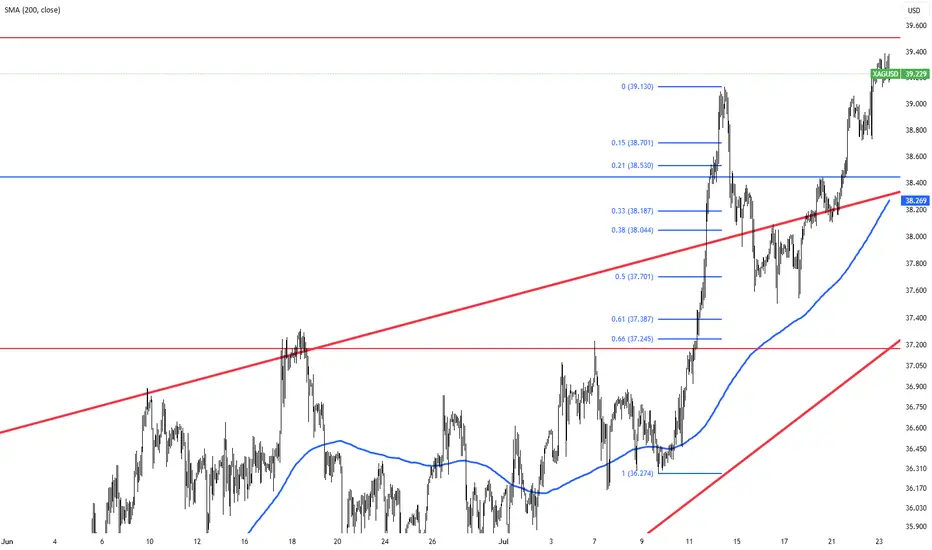
Silver Stays Strong on China Growth HopesSilver remained firm around $38.90 per ounce, holding near its highest levels since 2010. A weaker dollar and lower U.S. yields underpinned the metal, while traders await Fed Chair Powell’s comments and trade updates ahead of the August 1 deadline. China’s pledge to boost industrial growth also added to silver’s positive outlook.
Resistance is at $39.50, with support at $37.40.
Australian dollar rose 0.8% but there is a "Wall" of naked callsAustralian dollar is up 0.8% in 24h — and almost eyeing the 0.66–0.665 zone .
That’s exactly where we’ve been seeing a systematic build-up of naked calls on the futures.
More “bricks” added to the wall yesterday.
Early, looking at the CME data , there’s been a meaningful inflow in deep-out-of-the-money call options at the 0.665 strike . And this has been happening for several days for now
We can’t say it’s one single player — CME reports don’t show that.
But the pattern is too consistent to ignore.
🧠 Why it matters:
As I’ve said before — these long call stacks can easily turn into zero-cost put spreads by selling futures at those levels.
🎯 Bottom line:
Seems the market isn’t betting on a rally in long term.
It’s preparing to defend the range .
Strategy: open shorts at "build-up" resistance zone

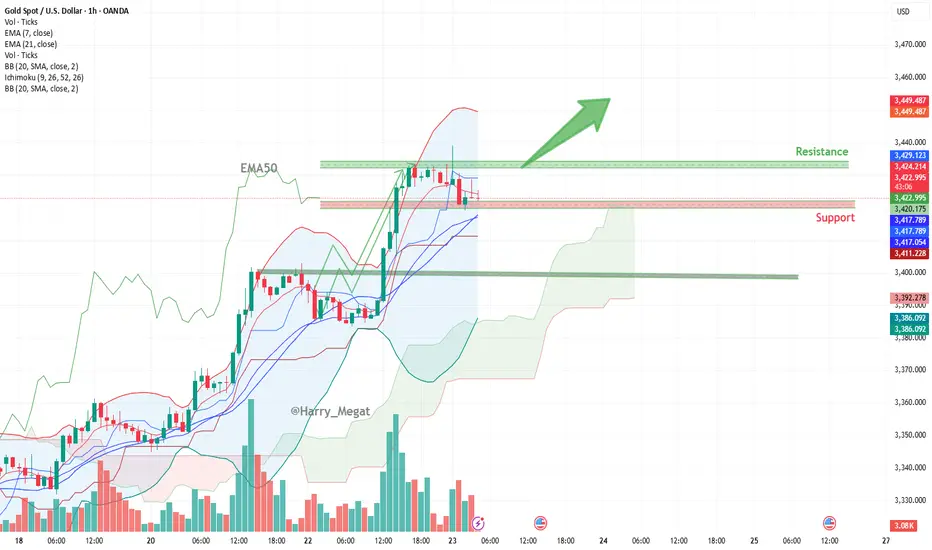
Gold Spot (XAU/USD) Chart analysis Gold Spot (XAU/USD) Chart analysis
**Chart Overview**
* **Current Price:** \~\$3,423.68
* **Recent Trend:** Bullish (Strong upward movement before recent consolidation)
* **Timeframe:** 1-hour chart
* **Indicators Used:**
* EMA 7 (Blue)
* EMA 21 (Purple)
* Bollinger Bands (Red/Green lines)
* Volume bars at bottom
**Bullish Momentum Signals**
1. **Strong Uptrend**:
* Price surged rapidly above \$3,400, breaking multiple resistance levels.
* Higher highs and higher lows confirm bullish structure.
2. **EMA Crossover**:
* The shorter-term EMA (7) is above the longer-term EMA (21), signaling a bullish bias.
* Price is currently near the EMAs, suggesting a possible retest of dynamic support.
3. **Bollinger Bands**:
* The price touched the **upper band**, indicating strong momentum.
* Bands are widening — a sign of increased volatility and continuation potential.
**Support and Resistance Zones**
* **Resistance Zone**: \~\$3,430–\$3,435
* Price was rejected here multiple times, indicating strong selling pressure.
* A breakout above this could send price toward the next level at \~\$3,450.
* **Support Zone**:
* Minor: \~\$3,417–\$3,418 (aligned with EMAs and lower Bollinger Band)
* Major: \~\$3,400 zone (previous breakout area and volume support)
**Bullish Setup**
* The **green arrow** suggests a bullish breakout is anticipated above \$3,430.
* If price holds above \$3,417 (EMA + BB support), the bulls could push it to **\$3,445–\$3,450** short-term.
**Risk**
* A break below \$3,417 and especially below \$3,400 could invalidate the bullish scenario and invite a correction.
* Watch for volume confirmation on any breakout to confirm strength.
**Conclusion**
Gold is in a **consolidation phase** after a strong rally. If support around \$3,417–\$3,418 holds, a breakout above \$3,430 could trigger a move to **\$3,445–\$3,450**. However, a break below EMAs would shift momentum back to neutral or bearish.
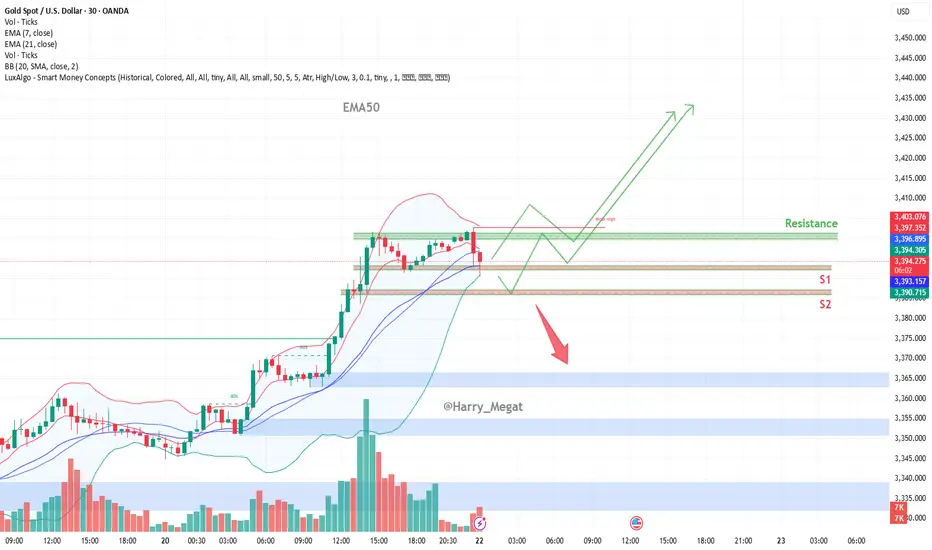
XAU/USD (Gold vs. USD) chart structureXAU/USD (Gold vs. USD) chart structure
**Chart Overview**
* **Current Price:** \~\$3,393
* **Indicators Used:**
* EMA 7, EMA 21 (short-term momentum)
* Bollinger Bands (20 SMA, 2 Std Dev)
* **Support Zones:**
* **S1:** \~\$3,392 – recent demand zone and confluence with EMAs
* **S2:** \~\$3,380 – deeper demand zone below
* **Resistance Zone:** \~\$3,403 – recent swing high and upper Bollinger Band
**Structure & Price Action Analysis**
**Bullish Impulse**
* A strong uptrend is visible prior to the current retracement, with consecutive higher highs and higher lows.
* Volume surged during the breakout around July 21, confirming strong bullish participation.
**Current Pullback**
* Price has rejected the **\$3,403 resistance**, causing a drop back to the **S1 demand zone**.
* This pullback is landing near the **EMA21 and lower Bollinger Band**, where buying interest may reappear.
**Possible Scenarios**
1. **Bullish Scenario (Green Path):**
* Price holds **above \$3,390–\$3,392 (S1)** support zone.
* Forms a **higher low** and reattempts a move toward **\$3,403** and potentially **\$3,420–\$3,435**.
* Confirmation: Bullish engulfing or reversal candles with volume near S1.
2. **Bearish Scenario (Red Arrow Path):**
* Price breaks below **S1 and EMA21**, losing bullish momentum.
* Next support is **S2 near \$3,380**, and if broken, it opens downside toward **\$3,365–\$3,350** zones
**Technical Confluence**
* **EMA Support:** EMA21 and EMA7 are still bullish-aligned but price is now testing them.
* **Bollinger Bands:** The price touched the upper band and is now mean-reverting. If it finds support at the midline or lower band, the bullish trend can continue.
* **Volume:** Volume spike during the breakout; recent drop is on lower volume, suggesting it may be just a pullback.
**Conclusion**
The structure remains bullish **as long as price stays above \$3,390/S1**. A bounce here could lead to continuation toward \$3,420+. However, **a break below \$3,390** may shift the structure toward bearish correction, targeting \$3,380 or lower.
ETH: Eyes Resistance, But Correction Still LoomsEthereum has also seen a modest pullback since yesterday morning, but here too, it’s too soon to confirm a high for turquoise wave B. Accordingly, we anticipate further gains in this corrective rally—potentially up to resistance at $4,107—before the subsequent turquoise wave C takes over and drives the price down into the green long Target Zone ($935.82–$494.15). Within this range, we primarily expect the low of the wave- correction, which has now lasted more than four years, setting the stage for a long-term trend reversal to the upside. According to to our alternative scneario, magenta wave alt.(1) would complete with the next high. The following pullback, attributed to wave alt.(2), would then only extend into the slightly adjusted magenta Target Zone ($2,622–$1,914) before a move to new all-time highs (probability: 35%).
📈 Over 190 precise analyses, clear entry points, and defined Target Zones - that's what we do (for more: look to the right).

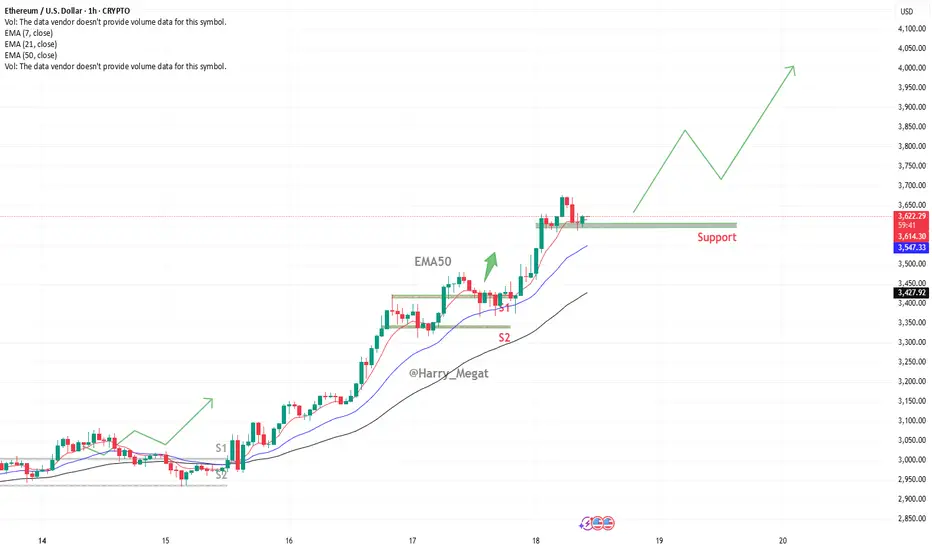
Ethereum (ETH/USD) Chart AnalysisEthereum (ETH/USD) Chart Analysis
**Trend Overview:**Ethereum (ETH/USD) Chart Analysis
* The chart shows **strong bullish momentum**, with Ethereum maintaining an upward trend of **higher highs and higher lows**.
* The price is currently around **\$3,618**, well above the key moving averages:
* **EMA(7): \$3,610**
* **EMA(21): \$3,539**
* **EMA(50): \$3,419**
**Support Levels:**
* The recent pullback found support at the **\$3,570–\$3,600 zone**, which is now acting as a **key horizontal support**.
* Below this, **EMA 21 (\$3,539)** and **EMA 50 (\$3,419)** offer additional dynamic support zones.
* Marked support areas **S1 and S2** also highlight previous breakout zones that could act as strong demand levels if retested.
**Bullish Outlook:**
* As long as ETH stays **above the support zone**, the bullish trend is likely to continue.
* A bounce from the current level could lead to a **retest of \$3,740**, followed by a move toward the **\$4,000 target** shown by the projected green path on the chart.
**Indicators & Sentiment:**
* Price respecting the EMA lines confirms **strong buyer interest** on pullbacks.
* No visible bearish divergence, and the chart structure favors **trend continuation**.
**Conclusion:**
Ethereum remains in a **bullish structure**, with strong support around \$3,570–\$3,600. As long as it holds above this zone, the next upside targets are \$3,740 and potentially \$4,000. A break below the EMAs would signal weakness, but for now, momentum supports continued gains.
BTC/USDTHello friends, I hope you are well. We should probably expect a slight increase in Bitcoin after the big drop in the financial market, which will most likely start in November. What is your opinion?

XAUUSD Bullish Setup | Liquidity Grab to Breakout📊 XAUUSD Bullish Breakout Plan | Price Action + Key Levels Analysis 🔥
Gold (XAUUSD) is currently holding above a strong support-turned-resistance zone around $3,340 - $3,345. After a clear rejection from the support area and a bullish structure forming, price is showing potential for a clean breakout toward higher targets.
🔍 Key Technical Highlights:
• Support Area: $3,310 - $3,320 held strongly
• Resistance Flip: $3,345 zone acting as new demand
• Target 1: $3,375
• Target 2: $3,390 major liquidity zone
• Structure: Bullish W pattern forming above demand
This setup favors buy on retracement, aiming for breakout above recent highs. Wait for a confirmation candle above resistance before entering.
📈 Watch for liquidity grab and strong bullish impulse.
#XAUUSD #GoldAnalysis #SmartMoney #BreakoutSetup #LiquidityHunt #ForexTrading #TechnicalAnalysis #BuySetup #PriceAction #TradingView #GoldSetup #ForYou

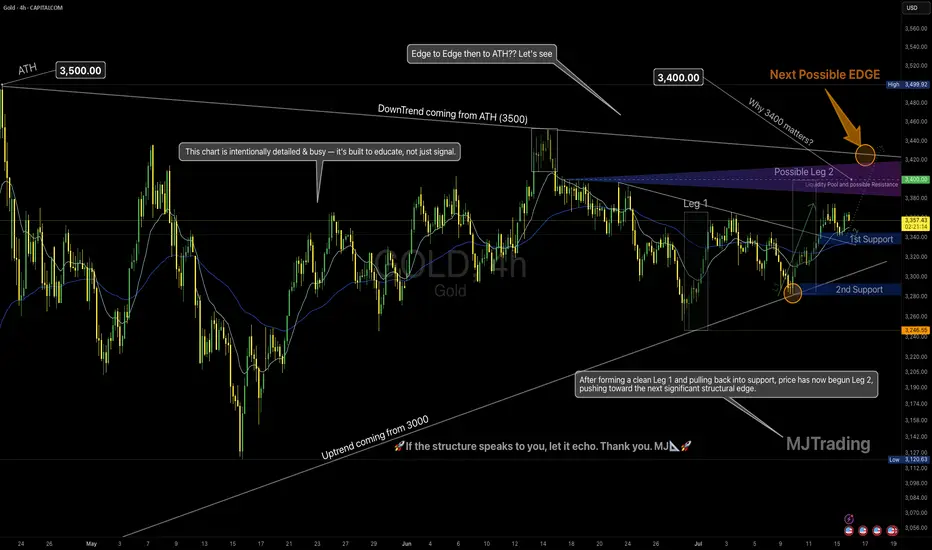
Leg 2 in Progress? | All Eyes on the Possible EDGE around 3400💡 GOLD 4H – MJTrading:
After forming a clean Leg 1 followed by a technical pullback into support, Gold has initiated Leg 2, pushing upward toward the next possible EDGE: 3400.
🟠 Why 3400 Matters
This zone is not just a round number:
It aligns with the long-term downtrend coming from the ATH (3500)
It’s the last reaction high before a deeper correction
There’s likely liquidity resting above — it’s where smart money may make decisions
This is where structure and psychology meet.
And end of 2 possible 2nd leg...
🔄 Possible Scenarios:
🟥 Scenario A – Rejection from the Edge (if could reach):
A reaction from this zone could lead to a pullback toward:
1st Support around 3340-3360
2nd Support near 3250 (also the uptrend line from 3000)
Use these zones to reassess momentum.
🟩 Scenario B – Breakout Above 3400:
A clean break above this structural edge opens the path for:
An “Edge to Edge” move back toward ATH (3500)
Possible higher timeframe trend shift — especially if retest holds
🧠 Our Strategy
We’re long-biased into the edge, not beyond it yet.
Let 3400 show its hand — we stay adaptive, not predictive.
🔍 This chart is intentionally detailed — it's built to educate, not just signal.
Focus on structure, sequence, and behavior — not just levels.
Lets Zoom in around the Breakout area...
And a Zoomout to Daily...
🧭 “If the structure speaks to you, let it echo.”
– MJTrading 🚀
📍#Gold #XAUUSD #TradingView #TechnicalAnalysis #ChartDesigner #MJTrading #MarketStructure #ForexIdeas #Edge
Gold (XAU/USD) Bullish Outlook Based on Price ActionGold (XAU/USD)**, showing a bullish outlook based on price action and support zones.
**Chart Analysis:**
* **Current Price:** \$3,359
* **EMA Signals:**
* EMA 7: \$3,353
* EMA 21: \$3,345
* EMA 50: \$3,341
**Bullish EMA alignment** (short EMAs above long) signals upward momentum.
* **Support Zones:**
* **S1**: \~\$3,345 (strong short-term demand area)
* **S2**: \~\$3,325 (deeper support zone)
* **Volume:** Spikes in green bars signal strong buyer interest near support, especially during the bounce.
* **Projected Move (Green Arrow):**
* A potential retest of the breakout zone (\~\$3,350) could happen before gold targets the **next key resistance** near **\$3,410**.
**Summary:**
Gold broke above a consolidation range supported by EMA alignment and strong volume. As long as the price stays above S1 (\$3,345), the trend remains bullish with upside potential toward \$3,400–\$3,410. A pullback may occur first, offering re-entry opportunities.

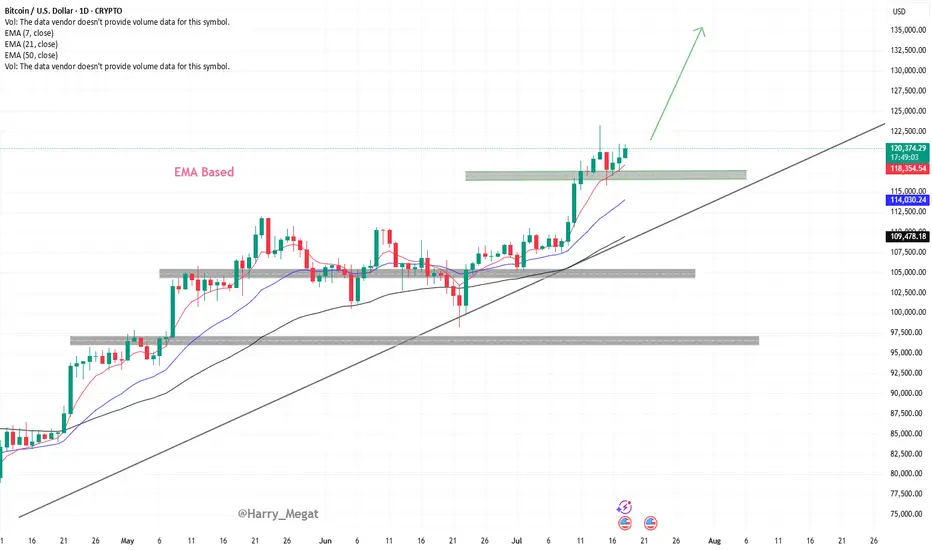
Bitcoin (BTC/USD) Technical AnalysisBitcoin (BTC/USD) Technical Analysis – Daily Chart Overview
This chart shows a **bullish continuation setup** for Bitcoin, supported by **EMA structure**, **trendline**, and **support zone** validation. Here's the detailed breakdown:
**1. Trend & Structure**
* **Uptrend:** Price is in a clear uptrend, making higher highs and higher lows.
* **Trendline:** The ascending trendline confirms strong upward momentum. It has been respected multiple times, acting as dynamic support.
**2. Key Support Zones**
* **Recent Breakout Zone (\~\$118,000 – \$119,000):**
Bitcoin broke out above this horizontal resistance and is now **retesting it as support**. This is a classic bullish retest pattern.
* The chart suggests that as long as price holds above this zone, **bullish continuation** is expected.
**3. EMA Indicators (Exponential Moving Averages)**
* **7 EMA (Red) – \$118,386**
* **21 EMA (Blue) – \$114,042**
* **50 EMA (Black) – \$109,483**
All EMAs are **sloping upwards** and aligned in bullish order (7 > 21 > 50), confirming strong upside momentum. The price is currently above all EMAs, which supports a continuation of the bullish trend.
**4. Bullish Target**
* The green arrow suggests a projected bullish move with a potential target above **\$130,000–\$132,500**, assuming price holds the support and resumes upward.
**5. Risk Area**
* If BTC closes **below the highlighted support zone (\~\$118,000)**, it could invalidate the bullish structure temporarily and push toward the next support near **\$114,000–\$115,000**.
**Conclusion**
* **Bias:** Bullish
* **Actionable Insight:**
* As long as BTC remains above the \$118K support zone and trendline, **buy dips** or **hold longs**.
* A clean break and close above recent highs (\~\$121K–\$122K) could open the door toward **\$130K+** targets.
Silver Holds Near $38.40 with Bullish MomentumAs of July 21, 2025, silver (XAG/USD) trades between $38.20 and $38.40, maintaining its upward trend. Key resistance is at $38.50; a break above could lead to $39.10–$40.00. Strong support is at $37.00 and $36.80. The RSI is nearing overbought, suggesting a possible short-term correction.
Upcoming U.S. CPI and PPI data may raise Fed rate cut expectations, supporting silver. Geopolitical risks and U.S. trade policies are supporting safe-haven demand, while strong industrial use in renewable energy and electronics also supports prices. The medium-term outlook remains positive.
Silver faces resistance at 38.50, with higher levels at 39.50 and 40.10. Support is found at 37.20, followed by 36.85 and 35.50.

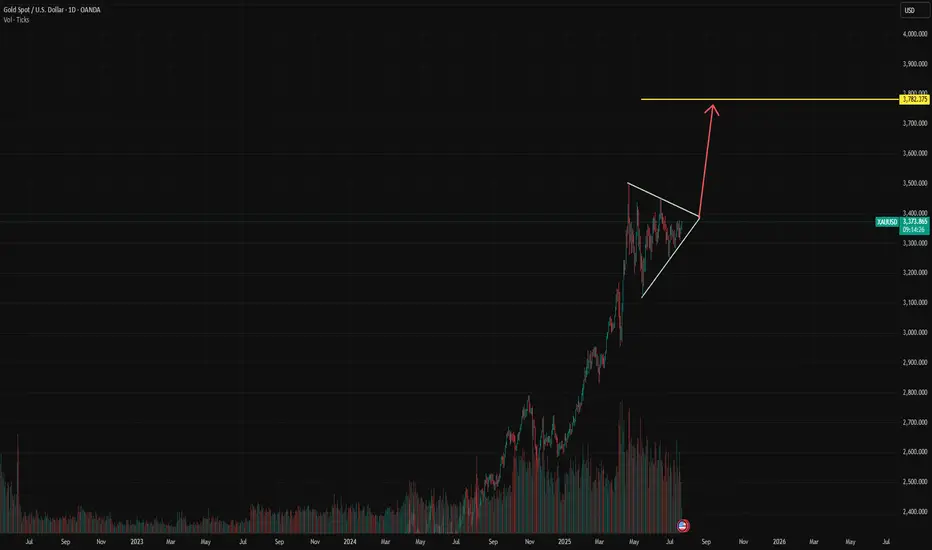
XAU/USDHello friends, I hope you are well. My analysis for gold is currently bearish, but from August we can surf and make good profits.
Today's GOLD Analysis – Structural Breakout and Bullish Setup🔷 1. Descending Channel – End of Bearish Phase
The chart initially shows Gold trading inside a well-defined descending channel, where price was consistently respecting both upper and lower trendlines. This movement reflected short-term bearish pressure, likely driven by fundamental uncertainty and lower time frame liquidity grabs.
However, the price broke above the channel with a strong bullish candle, which is a clear sign of momentum shift. Breakouts like these usually signify the end of a corrective phase and the beginning of a trend reversal or impulsive leg.
🔷 2. Minor Break of Structure (BOS) – First Confirmation
Following the channel breakout, price broke through a minor structure zone around 3,345–3,350, confirming a short-term change in market direction. This zone, previously acting as resistance, is now functioning as support (noted as “Minor SR - Interchange” on the chart).
This BOS is important because it represents the first break of a lower high in the previous downtrend, which is an early sign that buyers are stepping in with strength.
🔷 3. Retest and Clean Reaction – Support Validated
After breaking structure, the market retraced back into the broken zone, validating it as new support. This is a classic market behavior where price retests previous resistance to gather liquidity before moving higher — a key concept in Smart Money Concepts (SMC).
The bullish rejection from this zone further confirms the validity of the breakout and indicates that institutional buyers may be active in this region.
🔷 4. Current Price Action – Building Momentum
Price is now hovering near 3,355, building bullish structure with a series of higher highs and higher lows. This setup aligns with a continuation move toward the next liquidity target or resistance zone, which is:
✅ Reversal Zone: 3,375–3,380
This zone is marked as the next high-probability area where price might:
Face short-term resistance
Grab liquidity above previous highs
Possibly react with a pullback
The highlighted reversal zone (target: 3,378.23) is crucial because:
It aligns with previous supply
It could act as a decision point for larger time frame traders
It’s where a Major Break of Structure might occur if price breaks and holds above it
🔷 5. Projection & Scenario Planning
Here’s how the next move could play out:
Bullish Scenario: If price maintains support above the 3,350 zone, a rally toward 3,378 is expected. A strong close above this level would shift the larger structure bullish, confirming a major trend reversal.
Bearish Scenario (Short-Term): If price fails to break 3,378, we could see a pullback into the 3,345–3,350 area again. However, as long as this support holds, the bullish bias remains intact.
🔐 Key Technical Concepts Used:
Channel Breakout
Minor BOS & SR Flip
Liquidity Sweep
Reversal Zone (Supply Area)
Trend Structure Shift
📌 Conclusion:
Gold has broken out of its bearish channel and confirmed a short-term bullish structure. The recent breakout and retest give buyers a strong foundation to push toward the 3,378 zone. This is the key reversal area, and the reaction from here will define whether Gold continues to rally or faces a temporary pullback. For now, bulls are in control, and the market structure supports a continuation move.

#Bitcoin LTF update #Bitcoin LTF update
After making a high of $123,300, it dropped a bit and made short-term support at $117,000, and currently it is holding at this level.
But it is not strong enough to hold, we will retest the lower level.
IMO, we can see a retest up to $113,000 level approximately.
Where we have 0.382 golden fibre level, which is also aligning with some more important indicators, and most importantly, we have good numbers of liquidation at that level.
If you find my updates helpful, don’t forget to like and follow for more!
DYOR, NFA

$QQQ this might the spot. Hello and good night, evening, afternoon, or morning wherever you may be. I have been looking at names all day and I wanted to check the indexes: NASDAQ:QQQ and $SPY.
Here we have the indexes up almost 30% from the April lows and sitting about 10% YTD. The candle highlighted is the spinning stop candle and has volume to match. These candles usually take place (green or red) in downtrends or uptrends and provide pivotal indication. The market has major earnings this week (07/21/2025 to 07/25/2025) with names like Google, Tesla, General Dynamics, Verizon, Domino’s And so forth.
This week could be a catalyst to see some great volatility. I believe staying 3% from moving averages so I have noted 3.5% from the 50EMA and revisiting the 20EMA and 21EMA in the low $550 area. My target is $553 which is only a 1.4% move which can happen in one session in this environment while staying 3.5% above the 50EMA.
My trade idea will be $553p for 07/25/2025. Good luck!
WSL

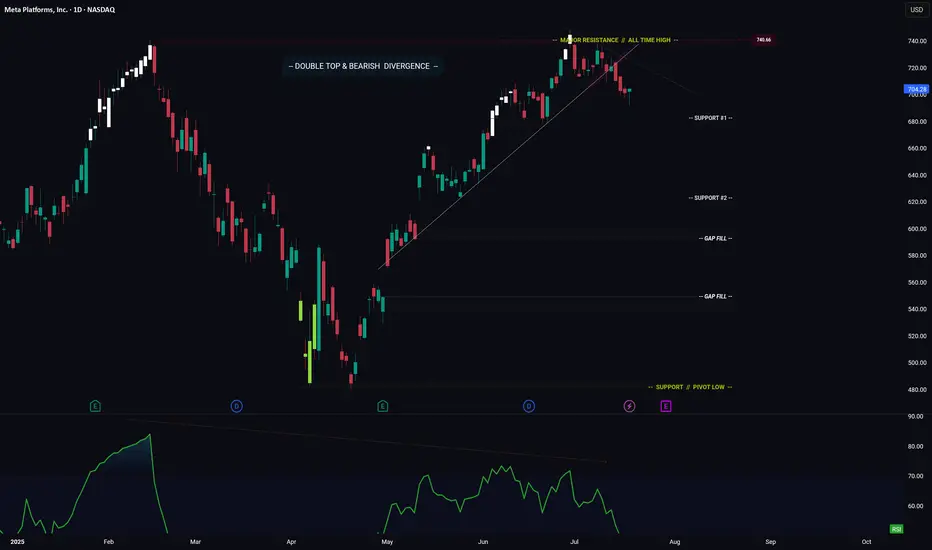
META -- Breakdown? Or Move Higher? Levels To Watch ForHello Traders!
Meta has broken down from its ascending trendline. This is bearish.
In addition price has formed a major Double Top pattern with Bearish Divergence.
Bearish Factors
1) Breakdown of ascending trendline
2) Double top
3) Bearish divergence
Two things need to happen if META is going to make a move higher...
1) Price needs to stay above "Support #1"
2) Price needs to break above the descending trendline (connecting the range highs)
IF price does breaks lower... where do we start looking for long positions?
- Support #2 is a great starting point, however if price makes it to support #2, then I could also see price trading down to fill the gap just below.
- This is where you could enter again to average down your position.
Thanks everyone and best of luck on your trading journey!
BTC/USD Fake out before Pump | Bullish Flag formationBTC/USDT (1D) Market Outlook – July 1, 2025
Introduction
BTC is currently consolidating within a bullish flag pattern after printing a swing high at 108.9K and a recent swing low at 98K. The price sits just below a major supply zone.
Context 1: Key Zones
Supply: 104.6K – 112.1K
Demand: 74.4K – 82.5K
Fair Value Gaps (FVG): 3 zones below price, with one near 88–90K
Context 2: Technical Confluence
Liquidation Zone: 106.2K
Golden Pocket (Fib 0.618): 102.1K
Psychological Levels: 105K and 110K
Context 3: Market Structure
Pattern: Bullish flag
Trend (LTF): Sideways/consolidation
Volume Profile: Heavy activity near 105K–110K
Bullish Scenario
Breaks above 106.2K (liq zone)
Pulls back to 102.1K (golden pocket), forms higher low
Retests resistance for continuation
Alt scenario: clean breakout above resistance → ATH retest
Bearish Scenario
Breaks below 106.2K and flag support
Fills FVG, breaks prior low at 98K
Triggers macro downtrend toward 88–90K zone
Summary
BTC is at a decision point inside a bullish flag, facing supply. A break above 106.2K favors upside continuation, while rejection and a lower low could trigger a deeper retracement. Watch key levels closely.
