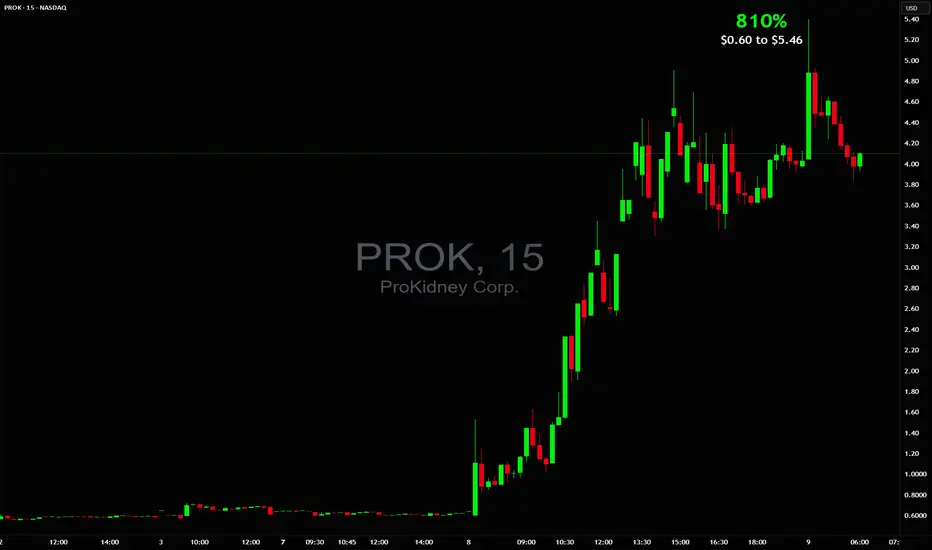
BIG 810% in 1 day $0.60 to $5.46💥BIG 810% in 1 day 📈 $0.60 to $5.46 there were almost more halts than candlesticks that's how wildly it traded NASDAQ:PROK
Other active stocks: NASDAQ:SCAG NASDAQ:BTCS NYSE:SRFM NASDAQ:BMGL NYSE:WOLF
#stocks #stockmarket #trading #trader #daytrade #strategy #teamwork #chart #analysis
Chartanalysis
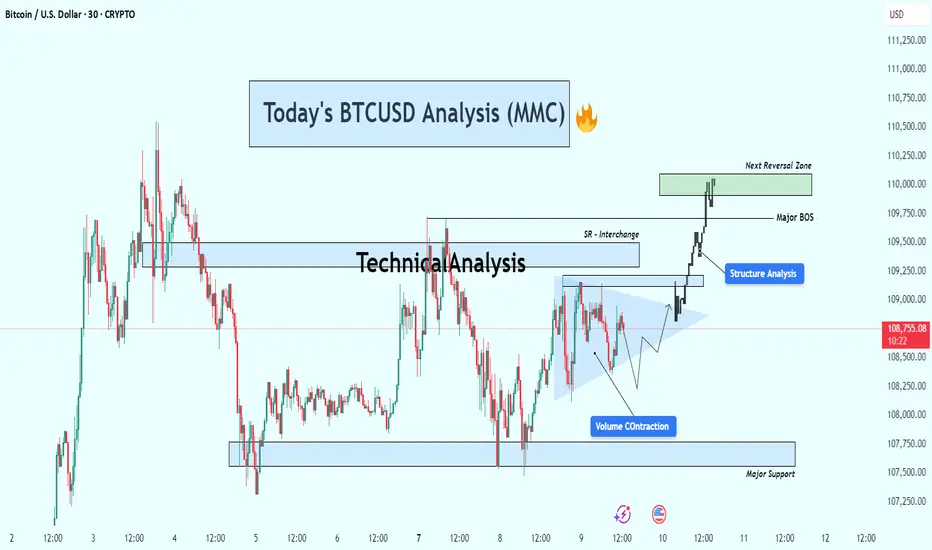
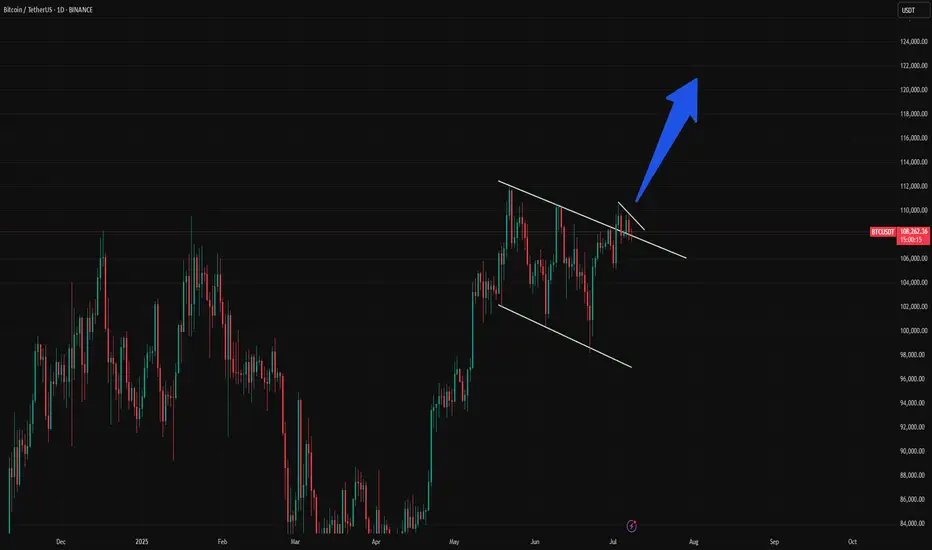
BTCUSD Breakout Confirmed – Targeting Next Reversal ZoneBitcoin (BTC/USD) is currently trading around $108,700, showing strong bullish momentum after breaking out of a consolidation structure. Price action has shifted significantly, with clear structural developments pointing toward continued upside — but not without caution around the next reversal zone.
🔍 Key Technical Insights:
🔹 1. Volume Contraction Triangle (Bullish Breakout)
The chart initially shows a volume contraction pattern forming a symmetrical triangle.
This pattern is often associated with market compression — a setup where smart money accumulates before a breakout.
BTC broke out of the triangle with strong bullish candles, confirming buyers have stepped in with conviction.
🔄 2. Structure Shift & Break of Structure (BOS)
A major BOS (Break of Structure) occurred as price broke previous swing highs, confirming a bullish market structure.
This BOS zone now acts as a potential support area if BTC pulls back.
A short-term SR interchange zone (Support becomes Resistance) was also respected and flipped again to support during the breakout — a clear sign of structural strength.
🧭 3. Next Reversal Zone – Supply in Sight
Price is approaching a major supply/reversal zone between $109,750 and $110,250.
This zone has previously shown strong selling interest.
Traders should watch for rejection or continuation patterns within this zone — such as bearish divergence, exhaustion candles, or confirmation of resistance.
🛡 4. Major Support Level
Below current price, a major support zone around $107,500–$107,800 remains intact.
This zone has provided a solid base during past consolidations and would be the first area of interest for buyers if a retracement occurs.
📌 Strategy Plan:
🔼 For Bullish Traders:
Those already in the breakout can hold with targets toward $110,000–$110,250.
If not in yet, wait for a retest of BOS/SR zone (~$109,000) for a safer re-entry.
Consider partial take-profits within the green reversal zone.
🔽 For Bearish Traders:
Watch for price exhaustion or a fake breakout in the reversal zone.
Potential short setups could form only if price fails to hold above the BOS zone and prints a lower high.
🔧 Technical Summary:
✅ Structure: Bullish Break of Structure confirmed
🔺 Momentum: Strong upside following volume contraction
📍 Next Key Resistance: $110,000–$110,250
📉 Major Support: $107,500–$107,800
⚠️ Caution Zone: Reversal area ahead – watch price action closely
Conclusion :
Bitcoin looks set to challenge the $110K psychological level as buyers remain in control. However, the reversal zone above is critical. A clean break and hold above it could open doors to further highs, while rejection here may trigger short-term pullbacks or range-bound conditions.
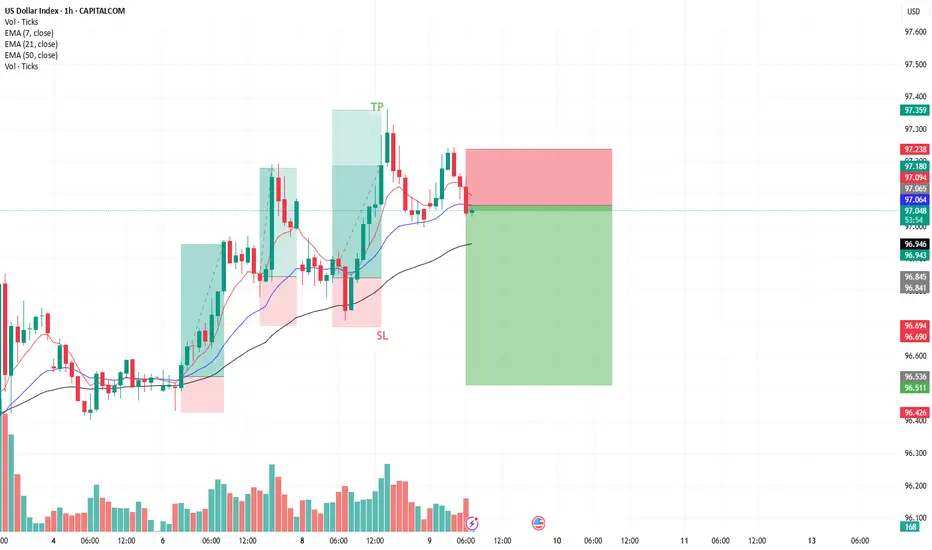
DXY Bearish Setup
Entry: 97.50 (current price)
Target (TP): 96.500 or below
Stop Loss (SL): ~97.80 (above recent swing high or resistance)
Risk Management: Essential — position size based on SL distance and account size
🔍 Trade Rationale:
Technical View: Price may be forming a lower high, suggesting possible downside continuation.
Fundamental Pressure:
Market cautious on Fed rate path
Tariff uncertainty could weaken USD
Upcoming FOMC minutes may add pressure if dovish signals emerge
Airbnb: Downtrend Set to Resume SoonSince our last update, Airbnb has experienced a rebound, which diverted the stock from the anticipated sell-off. However, the price is expected to soon resume its downward trajectory and, as the next key step, break through support at $108.60. This move should complete turquoise wave 3, with all subsequent waves of this downward impulse likely to unfold below this level. Ultimately, the stock is expected to finish the broader correction of the beige wave II.
📈 Over 190 precise analyses, clear entry points, and defined Target Zones - that's what we do.

$ETH Price Will Rising $3098 in Q3, Bullish Flag Inverse AngleCRYPTOCAP:ETH price will Rising $3098 in Q3 in 2025, Price Showing a Bullish Flag Inverse Angle. it's a Reversal Pattern and Manipulation Price. See more on Chart.
Crypto News: An Ethereum address holding 900 ETH started moving coins Monday after spending nearly 10 years dormant.
The holder received these genesis coins in 2015 when ETH traded below 50 cents.
These pre-mined tokens were distributed to early Ethereum contributors before mining began.
Their current value reaches 2.2 million with ETH trading around 2,529 per coin.
This represents potential gains exceeding 5,000% from the original sub-dollar entry price.
The move follows similar whale activity, including a 27.6 million Ethereum sale in April.
Last week saw a Bitcoin whale move 8 billion after 14 years of hodling.
ETH remains 48% below its 2021 all-time high of 4,878 despite recent stability.
The holder technically isn't a whale, which requires a minimum of 10,000 ETH at current prices.
#Write2Earn #BinanceSquareFamily #ETH #SUBROOFFICIAL
Disclaimer: This article is for informational purposes only and does not constitute financial advice. Always conduct your own research before making any investment decisions. Digital asset prices are subject to high market risk and price volatility. The value of your investment may go down or up, and you may not get back the amount invested.

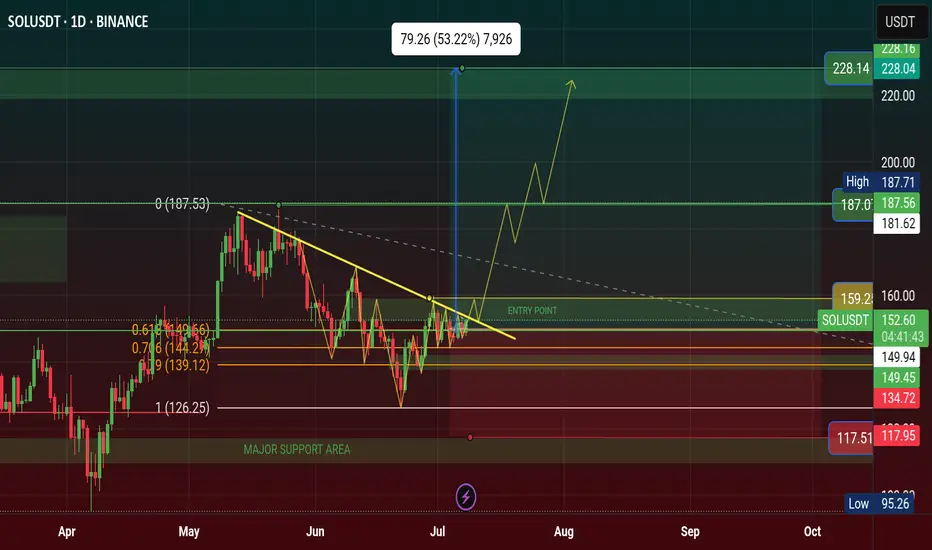
$SOL Price Will Hit $228 Q3, Inverse Head and Shoulder Pattern✨ CRYPTOCAP:SOL Price Will Hit $228 in Q3 of 2025 | Solana Chart Showing Inverse Head and Shoulder Pattern. It's a Bullish Reversal Pattern.
‣ Solana price is hovering below key resistance; a breakout above $159 and it's going to $228.
ETF Buzz Grows, but Price Action Still Caught in Limbo Here is why this could be the catalyst that sends price to all time highs Do THIS before that happens.
‣ Solana ETF Buzz Grows, but Price Action Still Caught in Limbo
🔸BlockNews The SEC has asked SOL ETF applicants to revise and refile submissions by end of July, fueling speculation of an ETF approval before October. Solana’s daily active addresses just hit a record 15.39 million, pointing to rising demand and user engagement on the network.
#Write2Earn #NFPWatch #BinanceSquareFamily #TrumpTariffs #SUBROOFFICIAL
Disclaimer: This article is for informational purposes only and does not constitute financial advice. Always conduct your own research before making any investment decisions. Digital asset prices are subject to high market risk and price volatility.
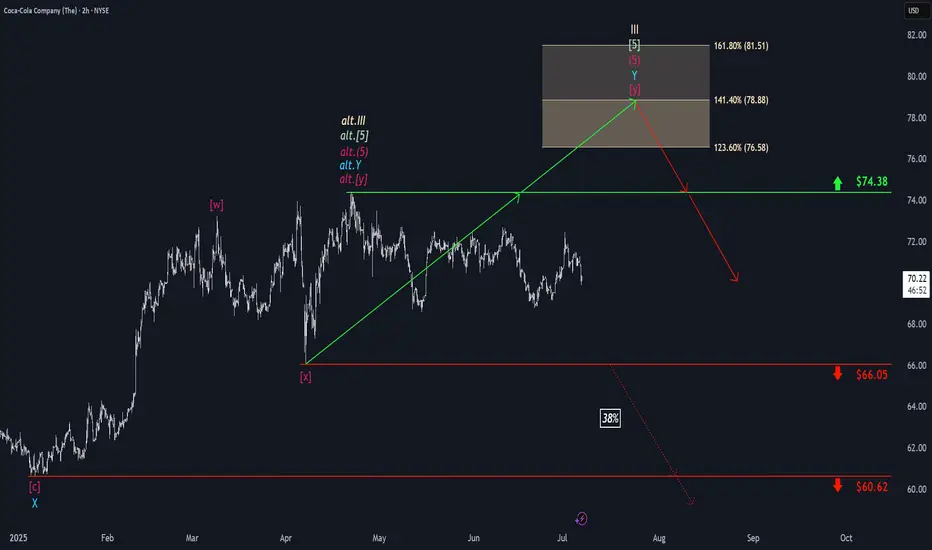
Coca-Cola: Nearing Final Wave III HighDespite recent sell-offs, we still expect Coca-Cola to reach a final high of magenta wave within our beige Target Zone between $76.58 and $81.51, which should also mark the completion of the broader beige wave III. However, an alternative scenario—with a 38% probability—remains in play: in this case, the top of beige alt.III would have already occurred, and a direct decline below $60.62 would likely follow. In either scenario, once the high of beige wave III is established, we anticipate a significant correction.
📈 Over 190 precise analyses, clear entry points, and defined Target Zones - that's what we do.
Gold Setup Expected Move📈 Bullish Scenario (Upside Move)
✅ Conditions:
Price holds above $3,327 support
EMA50 acts as dynamic support
RSI stays above 50
MACD shows bullish crossover
🔼 Targets:
TP1: $3,342 (Resistance 1)
TP2: $3,360 (Resistance 2)
Potential Breakout Zone: Above $3,360 could open path to $3,375+
🔒 Invalidation:
Bullish bias invalid if price breaks below $3,327 and EMA50
📉 Bearish Scenario (Downside Move)
✅ Conditions:
Price breaks below $3,327 support
EMA50 is broken to the downside
RSI drops below 45–40
MACD shows bearish crossover or negative histogram
🔽 Targets:
TP1: $3,308 (Support 2)
TP2: $3,295–$3,285 (next demand zone
🔒 Invalidation:
Bearish bias invalid if price reclaims above $3,335–$3,342 quickly with volume
🧭 Summary Table
Scenario Trigger Target(s) Invalidation
Bullish Holds above $3,327, EMA50 support $3,342 → $3,360+ Break below $3,327
Bearish Breaks below $3,327 + EMA50 fails $3,308 → $3,295 Regain above $3,342

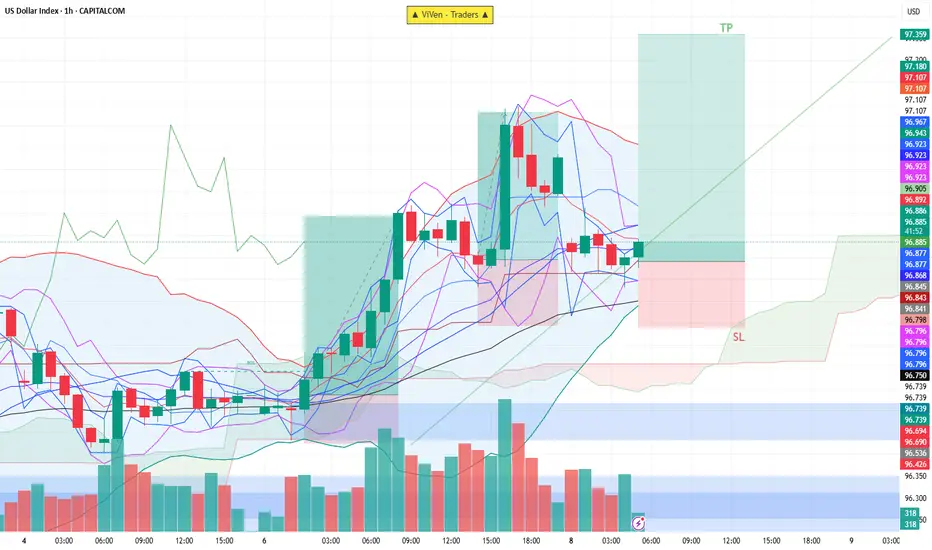
DXY Trade Setup✅ Trade Setup Details:
Entry: 96.850
Stop Loss (SL): 96.650
Take Profit (TP): 97.350
✅ This is a good RRR. A 2.5:1 ratio means you're risking $1 to potentially earn $2.50 — favorable for consistent trading.
📈 Chart & Technical Analysis (based on your image):
✅ Entry is near the middle Bollinger Band and above Ichimoku cloud — a technical support zone.
✅ SL is placed below recent support and Ichimoku base, giving some buffer in case of volatility.
✅ TP at 97.350 aligns with the recent swing high or top of the breakout channel.
⚠️ Things to Watch:
If DXY drops below 96.700, it may signal weakness or a shift in sentiment — watch volume and price reaction.
If price stays above cloud and rising trendline, your trade remains valid.
🟢 Summary:
Bias: Bullish
Setup: Good technical entry with solid support below and clear resistance target.
Risk-to-Reward: Excellent (2.5:1)
Strategy: Hold unless price breaks below 96.650 with volume.
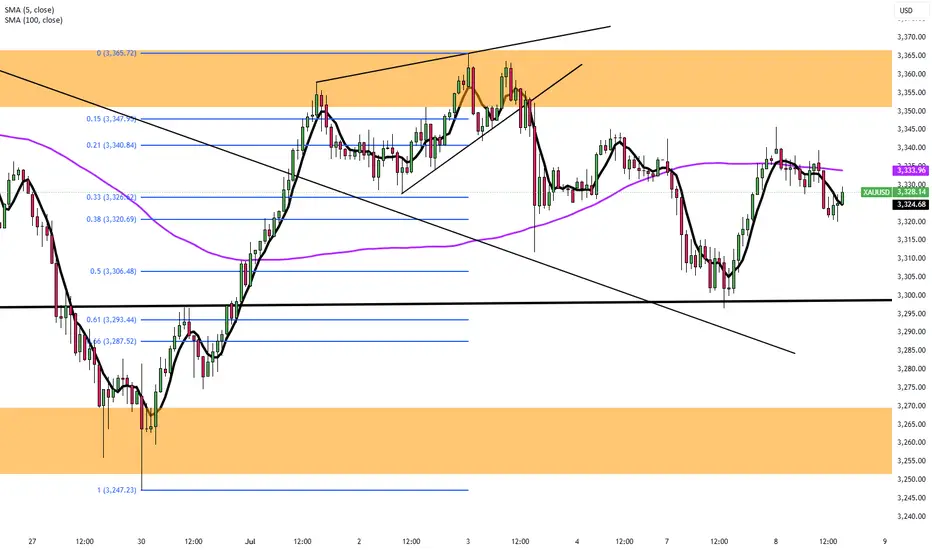
Gold Rebounds Toward $3,350Gold (XAU/USD) rebounded from a five-day low of $3,297, climbing toward $3,350 after Trump announced 25% tariffs on Japan and South Korea effective August 1, with 12 more countries receiving similar tariff warnings ranging between 25% and 40%. The rising risk of a global trade war fueled safe-haven demand, though gold’s gains were capped by simultaneous US Dollar strength.
Resistance is at $3,365, while support holds at $3,300.
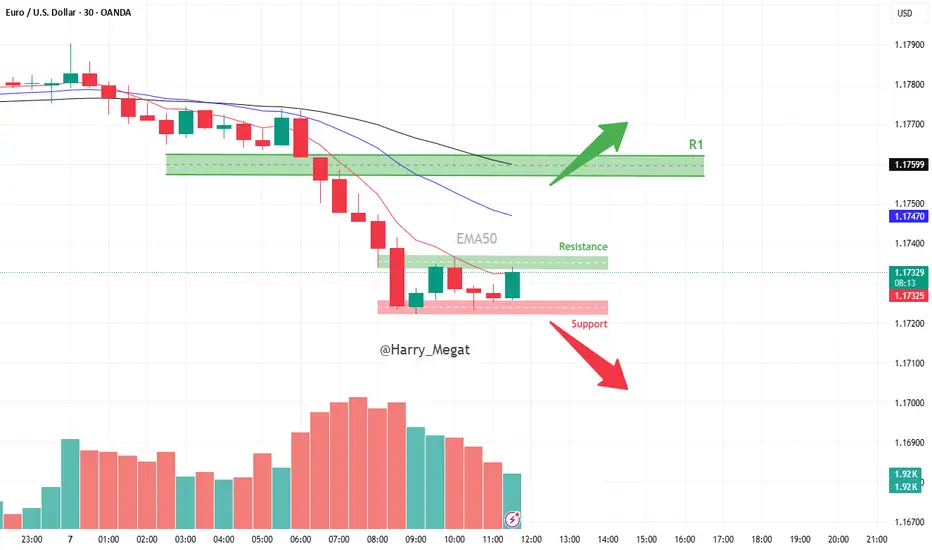
EURUSD Setup Scenario A – Bearish Continuation:
🔻 Sell near 1.17300–1.17340 (Resistance Zone)
🎯 Target: 1.17200 or lower
📉 Stop Loss: Above 1.17350
Scenario B – Bullish Breakout:
🔼 Buy if price breaks above 1.17350 with volume
🎯 Target: Next resistance zone (e.g., 1.17450 or more)
📉 Stop Loss: Below 1.17280
🧠 Summary:
Market is consolidating after a drop.
Watching for breakout above resistance or breakdown below support for next move.
Currently, the bias is slightly bearish, but breakout scenarios must be monitored.
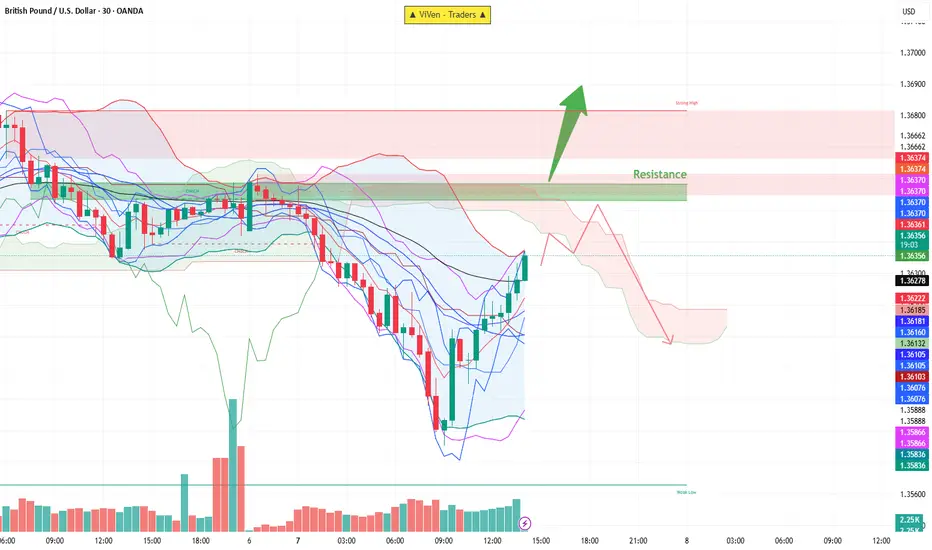
GBPUSD Chart Analysis & Scenarios✅ Bullish Breakout (if breaks 1.3666):
Target: 1.3680–1.3700
Confirmation: Price closes above resistance with strong volume
❌ Bearish Rejection (if rejected at 1.3637–1.3666):
Target: 1.3610, possibly 1.3588
Watch for: Bearish candlestick pattern at resistance + drop in volume
✅ Summary:
GBP/USD is recovering strongly but faces heavy resistance at 1.3637–1.3666.
Breakout above could open room toward 1.3700.
Rejection likely if momentum weakens near resistance, targeting previous lows.
Bullish trade idea for EUR/JPYBullish trade idea for EUR/JPY:
Buy near 171.15
Take Profit at 171.78
Stop Loss below 171.10
Risk Management is important

btc/usdtI think it's time for Bitcoin to grow. It doesn't matter what the news is. This time, Bitcoin and Tether's dominance have reached their peak and are ready to make Bitcoin grow. This is my analysis. What do you think?
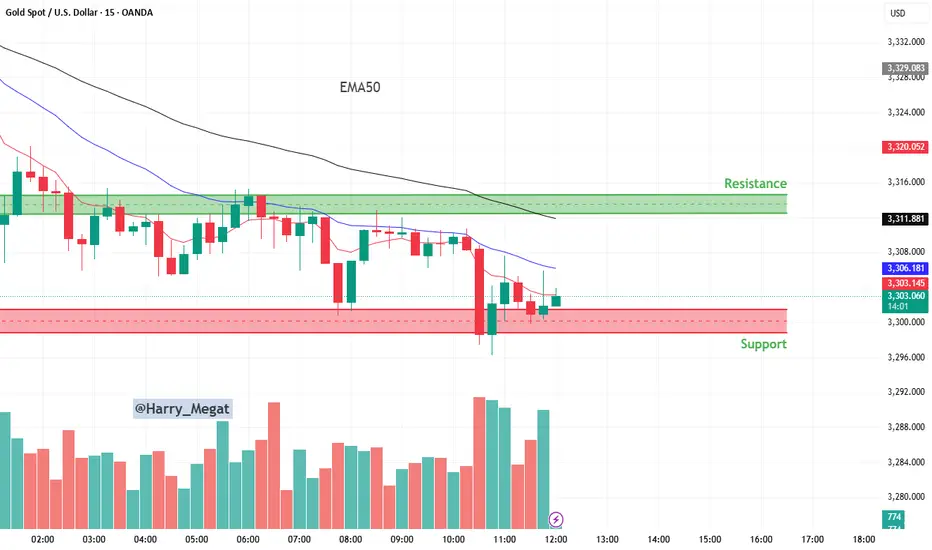
15-minute candlestick chart for Gold Spot (XAU/USD)15-minute candlestick chart for Gold Spot (XAU/USD)
📉 **1. Trend Overview:**
* The overall direction is **bearish (downtrend)** — this is confirmed by:
* **Price below the 50 EMA** (black line)
* **Lower highs and lower lows**
* Continuous rejection from resistance
---
### 🟩 **2. Resistance Zone (\~3,312 to 3,320):**
* This is the area where price has **previously failed to break above** multiple times.
* Sellers dominate this level — price tends to drop when approaching here.
* A **bullish breakout above 3,320** may signal trend reversal.
---
### 🟥 **3. Support Zone (\~3,296 to 3,303):**
* This area has seen **strong buying** (look at the lower wicks and reversal candles).
* Price has bounced multiple times from this zone — it's acting as a **floor**.
* If price breaks **below this support**, further downside is likely.
---
### 📊 **4. Indicators:**
* **EMA 50 (black line)**: Shows the medium-term trend — it's sloping down, confirming bearish bias.
* **Shorter EMAs (red and blue)** are also above price, indicating pressure from sellers.
---
### 💡 **5. Price Action & Volume Insight:**
* A recent **rejection wick** at support suggests buyers are still active here.
* However, volume is increasing during the latest drop — **bearish momentum** is building.
* Watch how price behaves around 3,302–3,303 — consolidation here could lead to a breakout or breakdown soon.
---
### 🧠 **Trade Setups:**
#### **A. Bearish Scenario (Breakdown Trade):**
* 🔻 *Sell below 3,296 (support break)*
* 🎯 Target: 3,288 or lower
* 🛑 Stop Loss: Above 3,304
#### **B. Bullish Scenario (Bounce Trade):**
* 🔼 *Buy near 3,296–3,303 (support bounce)*
* 🎯 Target: 3,312–3,320 (resistance)
* 🛑 Stop Loss: Below 3,295
---
### ✅ **Summary:**
* Market is **bearish**, but currently **testing strong support**.
* Watch closely for a breakout below support or a pullback to resistance.
* Best strategy: **Sell the breakdown or sell the pullback to resistance.**
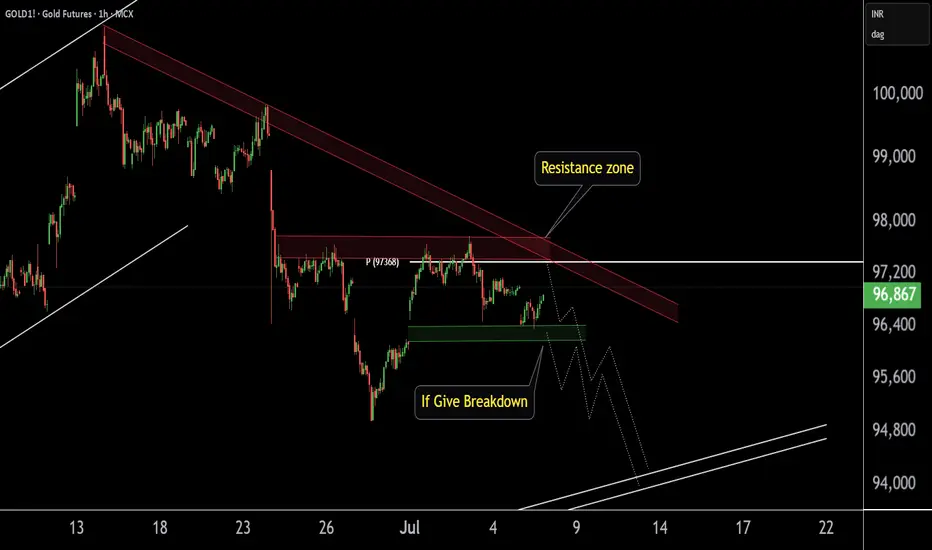
GOLD1! Best Key Level !!This is the 1 hour Chart of Gold!.
Gold is forming a bearish structure and is consistently respecting the resistance zone, leading to a downward move. The key resistance area is between 97,800 and 97,400..
Gold is finding support in the 96,250 – 96,330 zone on the short time frame.
A breakdown below this level may trigger aggressive selling pressure.
Thank you !!
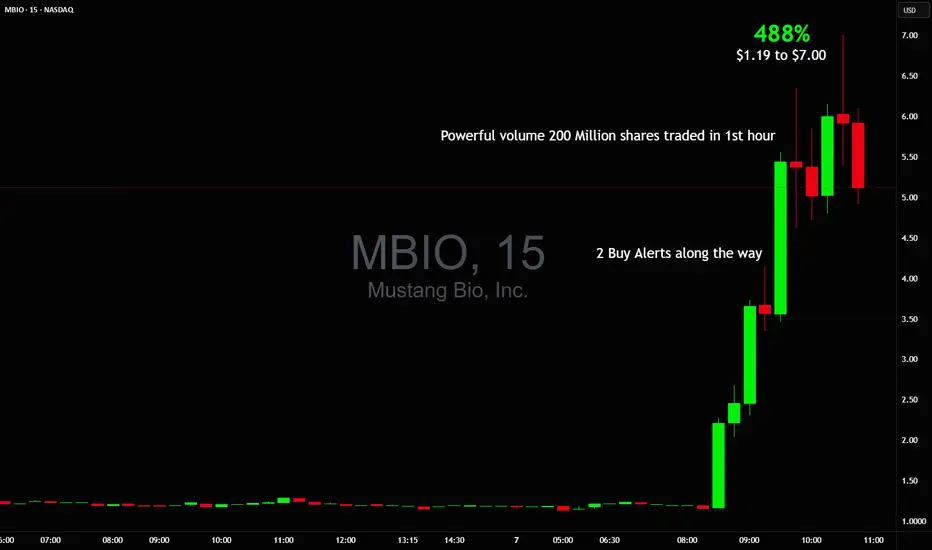
$1 to $7 in minutes +488% vertical $MBIO$1 to $7 in minutes 🚀🤑
Week barely started, already sitting on +30% realized profit from 3 sniper trades NASDAQ:MBIO 2x and NYSE:WOLF
Gold Recovers After Two-Week DeclineGold Recovers After Two-Week Decline
Gold rose slightly to around $3,330 on Friday, set for a weekly gain as US deficit worries and tariff uncertainties increased safe-haven demand. The House passed Trump’s tax and spending cuts, expected to add over $3 trillion to the deficit in ten years. Trump also said he would begin issuing formal tariff notices Friday. Gold’s gains were capped by strong US jobs data, with 147,000 jobs added in June and unemployment falling to 4.1%, supporting the Fed’s current rate stance.
Gold is on track to end the week up over 1%, recovering after two weeks of declines.
Resistance is at $3,365, while support holds at $3,300.

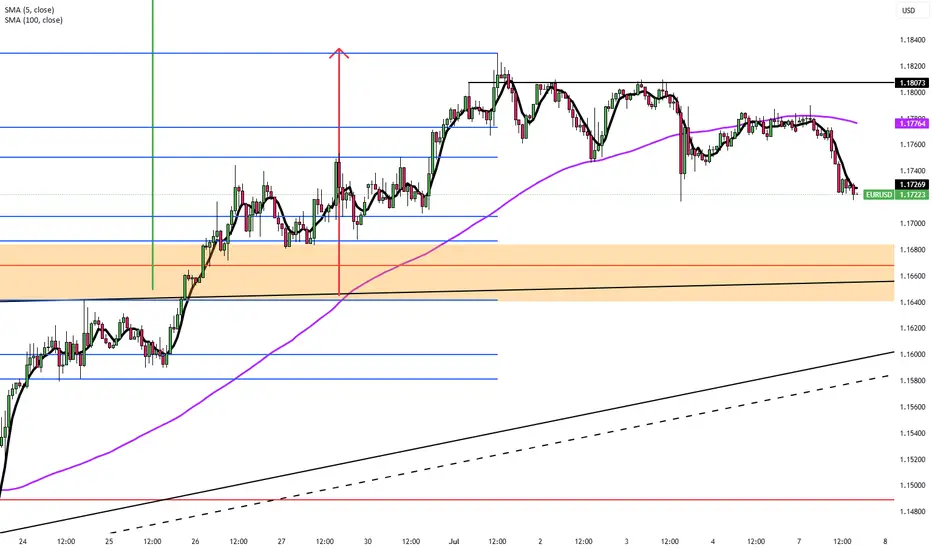
US Jobs Data Supports Fed Dovish SignalsThe EUR/USD stayed in a narrow range around 1.1760 during Friday’s Asian session, with limited movement as US markets were closed for Independence Day.
The US dollar gained modestly after Thursday’s NFP data showed 147,000 new jobs in June, beating the expected 110,000.
However, private sector job growth slowed, adding only 74,000 jobs in June versus a three-month average of 115,000. This trend supports Fed officials like Vice Chair Bowman, who recently called for rate cuts due to labor market risks.
Resistance for the pair is at 1.1830, while support is at 1.1730.
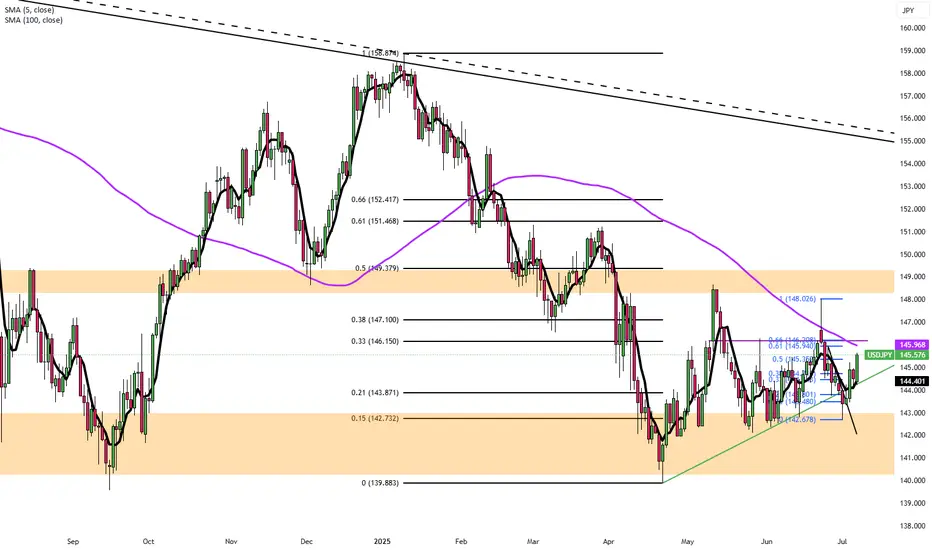
Japan Seeks US Deal as Tariff Deadline NearsThe yen hovered around 145 per dollar Friday after a nearly 1% drop in the previous session, pressured by trade uncertainties as Tokyo seeks a deal with Washington before next week’s deadline. Trump may announce new tariffs or extend deadlines today, having previously threatened tariffs up to 35% on Japanese goods over low US rice and car imports.
The yen also weakened as a stronger US dollar followed a better June jobs report, easing recession fears and reducing near-term Fed cut chances. In Japan, May household spending grew more than forecast, supported by government efforts to increase demand.
The key resistance is at $145.35, meanwhile the major support is located at $143.55.
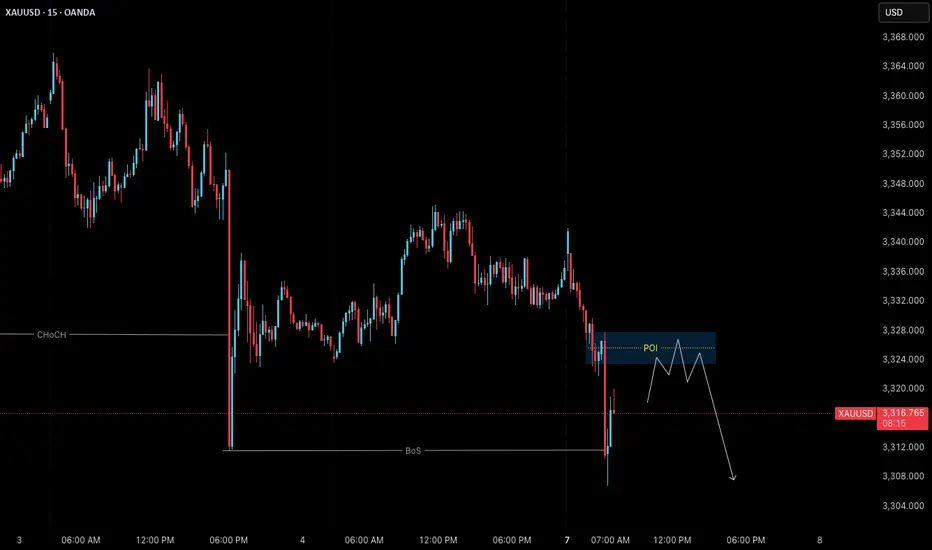
Gold (XAUUSD) – July 7 | Watching 3326 POI for Short Setup🟡 Gold (XAUUSD) – July 7 Bias | Short Setup Developing at 3326 POI
The Gold market remains in a pullback phase on the H4 timeframe , and price may still revisit the 3280 H4 order block before resuming its broader uptrend.
On the M15 timeframe, structure has now shifted clearly.
After an initial Change of Character (ChoCh) , we’ve seen a confirmed Break of Structure (BoS) , placing M15 officially in a downtrend .
✅ Why This Matters:
With both ChoCh and BoS complete, we no longer treat this move as a potential liquidity grab — it now reflects a valid structural reversal in the short term.
But instead of reacting impulsively, we study this shift as a live example of structure-based price action — and how entry zones form after confirmation.
🔍 M15 Order Block in Focus:
• 3323.500 – 3327.800 → Valid M15 POI for short setups
→ This is where we expect price might retrace before resuming its move
→ We’ll observe this zone for M1 confirmation (ChoCh + micro BoS) before taking any action
🎯 Target Zone:
• 3280 – H4 Demand
→ A clean structure-based target aligned with higher timeframe pullback
→ Our model requires minimum 1:3 RR , anchored to price structure
🔁 Key Takeaways:
• H4: Pullback phase remains intact
• M15: Downtrend confirmed (ChoCh + BoS complete)
• Execution plan: Observe 3326 POI; respond only if structure confirms again on M1
• No anticipation. No prediction. Just process.
📖 This is structure-based learning in real time.
We don’t chase setups — we observe shifts.
Let structure teach you. Let price confirm it.
The chart is the mirror.
📘 Shared by @ChartIsMirror
Rising Institutional Buying
Rising Institutional buying has been seen in this stock. This quarter is full of their accumulation it seems. It'll be interesting to see whether it holds 80-90 level.
Chart is for educational purpose, not a Buy/Sell Reco.

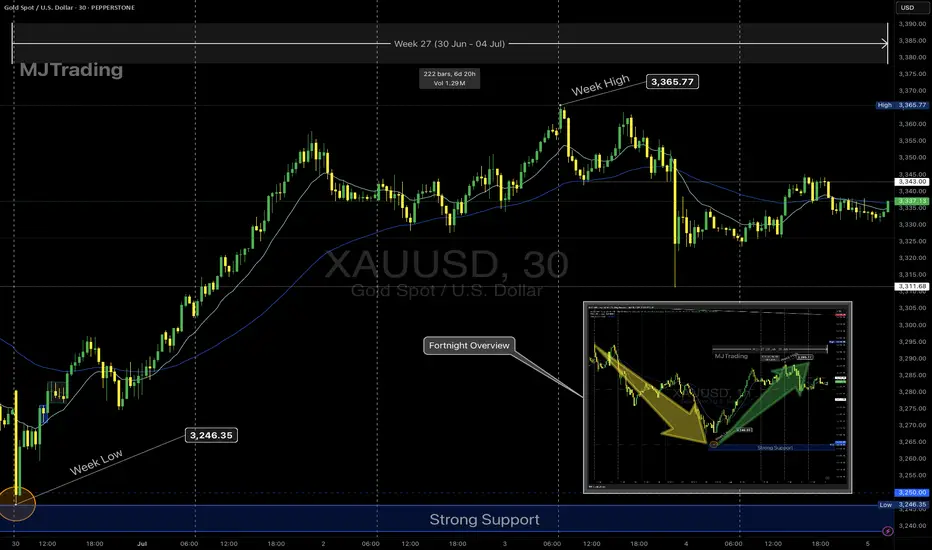
Gold Weekly Recap – Week 27 (30 Jun – 04 Jul)🟡 XAUUSD | MJTrading
Overview
Gold (XAUUSD) staged a significant recovery this week after retesting a critical support zone. Price action reflected strong buying interest at lower levels, followed by consolidation near mid-range resistance.
🔹 Key Levels:
Strong Support Zone: 3,246 – 3,250
Weekly Low: 3,246.35 (30 June)
Weekly High: 3,365.77 (3 July)
Closing Price: ~3,343
🔹 Price Action Summary:
✅ Early Week Retest & Reversal
After the prior week’s decline, gold opened the week near the major support area around 3,246. This zone acted as a strong demand pocket, triggering a swift rejection and initiating a bullish reversal.
✅ Sustained Rally to Resistance
Price climbed steadily, riding the 15-period EMA to reach the weekly high of 3,365.77 on 3 July. This move represented a nearly 4% recovery off the lows, fueled by renewed safe-haven flows and short covering.
✅ Midweek Consolidation
Following the rally, gold entered a sideways consolidation phase between 3,340 and 3,365. EMA flattening reflected a pause in momentum as traders assessed the next directional catalyst.
✅ Late-Week Pullback
Toward the end of the week, price tested the 3,310–3,320 area before modestly bouncing into the Friday close. Overall, the market maintained a cautiously bullish tone while holding above the prior support.
🔹 Technical Perspective:
🔸 Bias: Cautiously Bullish
Price defended the strong support and printed a higher low structure.
Sustained closes above 3,300 maintain the bullish outlook.
🔸 Near-Term Resistance:
3,365–3,390 remains the immediate supply zone to monitor for breakout attempts.
🔸 Key Support:
The 3,246–3,250 area continues to be the primary downside line in the sand.
🔹 Special Note – 4th July US Bank Holiday
Trading volumes were notably lighter on Thursday, 4th July, due to the US Independence Day holiday. This contributed to reduced liquidity and muted volatility, with many traders and institutions off desks. The thinner market conditions likely influenced the late-week pullback and consolidation, as participation was limited heading into the weekend.
🔹 Sentiment & Outlook
The decisive rebound from support suggests that buyers are defending value zones aggressively. However, failure to close the week above 3,365 leaves gold vulnerable to another retest of mid-range levels if fresh catalysts don’t emerge.
Traders should watch for:
A clean breakout above 3,365 to confirm continuation higher.
Any sustained weakness below 3,300 as a signal of fading bullish momentum.
🧭 Next Week’s Focus:
Monitoring whether the consolidation evolves into accumulation or distribution.
Watching for a breakout or deeper pullback
Reactions to upcoming economic data
EMA alignment: If the 15 EMA continues to track above the 60 EMA, it supports a bullish bias.
Chart Notes:
The main chart highlights this week’s action, while the inset provides a fortnight overview of the broader decline and recovery for context.
Thank you for your time and your support...
🚀🚀Boost it if you like it (Thanks)🚀🚀
#Gold #XAUUSD #GoldTrading #Forex #Commodities #TechnicalAnalysis #PriceAction #TradingRecap #MJTrading #GoldForecast #MarketReview #WeeklyRecap #TradingView