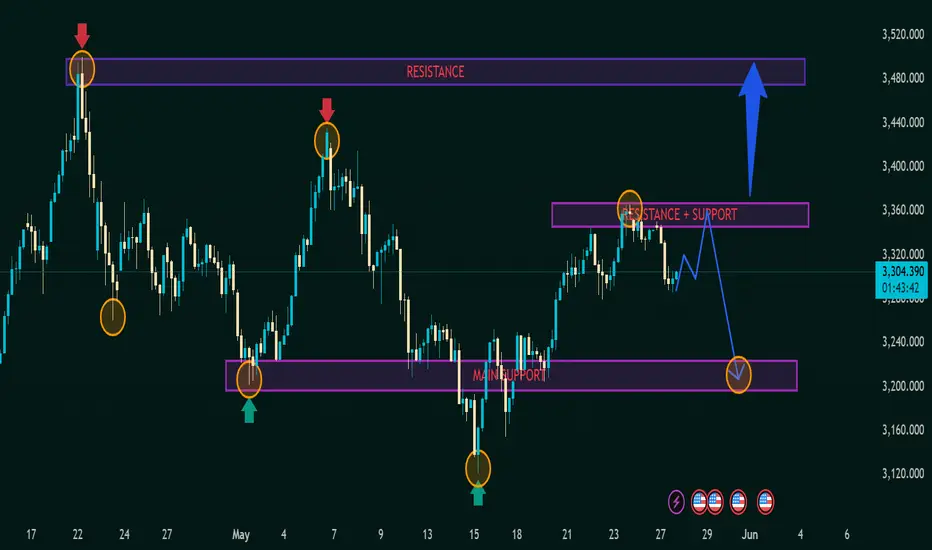
Technical Analysis: XAU/USD (Gold) Price Action📊 Technical Analysis: XAU/USD (Gold) Price Action
🕒 Timeframe: 4H (Based on candlestick structure)
📅 Published: May 27, 2025
💰 Current Price: 3,303.860
🔴 Major Resistance Zone
📍 3,480 – 3,500
📌 Seen with red arrows and price rejections.
📉 Strong selling pressure has occurred twice from this level (double top-like behavior).
❗ Until price breaks above this, bulls face a major hurdle.
🟣 Key Mid-Level Zone (S/R Flip)
📍 3,340 – 3,360
🔄 This area has flipped between support and resistance.
🔸 Price tested this level recently and pulled back (orange circle), suggesting sellers are active.
🔮 This is the pivot zone – watch for break/rejection to determine next trend leg.
🟪 Main Support Zone
📍 3,180 – 3,220
✅ Multiple bounce reactions visible (green arrows and circles).
💪 This zone has held strong; indicates solid buyer interest.
📉 If price returns here and breaks below, we could see further downside to 3,120 or lower.
🧭 Market Structure Summary
🔁 The market is in a range-bound structure between 3,220 – 3,360, with spikes towards 3,480.
🔃 The recent higher low followed by rejection at mid-resistance suggests potential distribution.
🧠 Forecast Scenarios
🔵 Bullish Scenario (Blue Path)
Break above 3,360 → Retest as support → 📈 Potential rally to 3,480
📍 Target: 3,480+
🟢 Confirmation: Strong bullish engulfing candle + volume surge
🔻 Bearish Scenario (Blue-Arrow + Orange Circle)
Rejection at current resistance → Drop toward 3,220
📍 Target: Main Support zone
❗ Watch for bearish candle pattern confirmation at 3,340
⚖️ Trading Strategy Tips
🔍 Wait for confirmation at the mid-resistance before entering.
🛡️ Place stops below support zones for long positions.
💥 Aggressive short sellers may look to enter near 3,340 with tight stops above.
🧩 Conclusion
The asset is in a critical decision zone. Whether it breaks higher toward the resistance or retraces to support will shape the next directional move. Traders should remain cautious, and let price action confirm bias before committing.
Chartaptterns
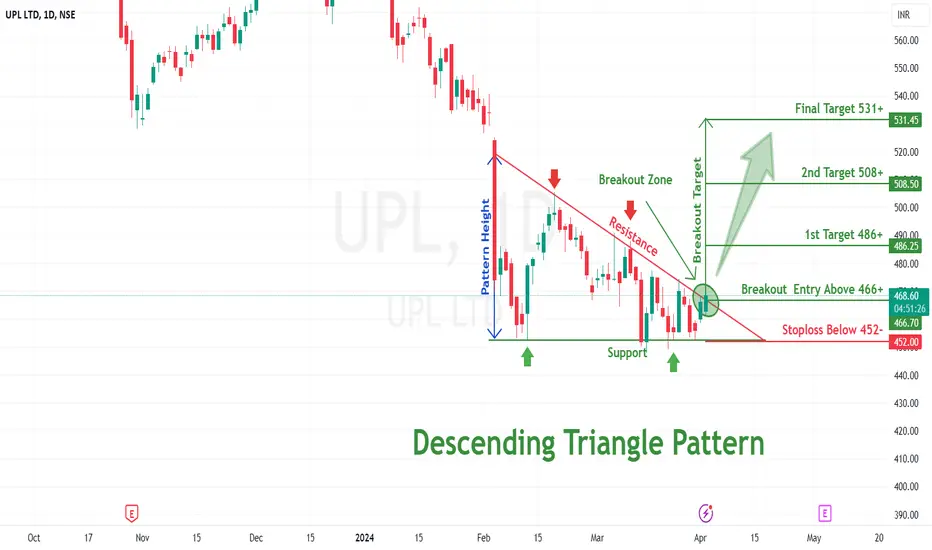
Descending Triangle pattern breakout in UPLUPL LTD
Key highlights: 💡⚡
✅On 1 Day Time Frame Stock Showing Breakout of Descending Triangle Pattern.
✅Strong Bullish Candlestick Form on this timeframe.
✅It can give movement up to the Breakout target of 531+.
✅Can Go Long in this Stock by placing a stop loss below 452-.
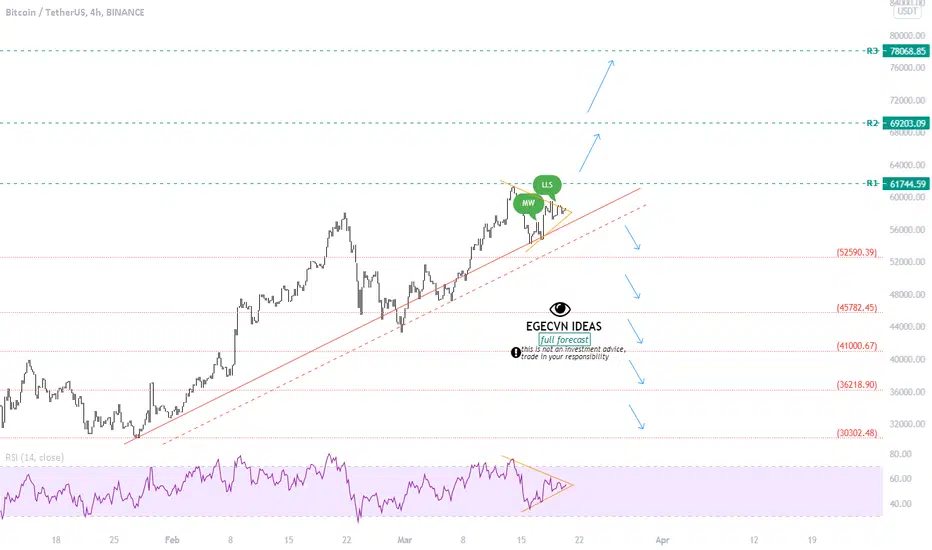
BTCUSDT Full Forecast
Bitcoin is still looking for bullish. It is supported by triangle breaks and bullish formations. So, it is so strong signal for buy for short term gainings. Also it is following base on up trend way and I don't think it is going to break down. And while Bitcoin is a fomo material, we will see strong buyers in short term.
I will share SL and TP zones in another only-short-term forecast.
As it is in the short-term, while above the trend, we will not see a bearish soon. Actually this price line, under the 61k is very good buy zone for mid-term traders. Keep following because nobody can know what will happen if it breaks below.
I'm one of thinkers Bitcoin will rise over $250k. If you are going to buy in spot, you can; always actually. But this is not a good spot for leveraged long term buyings. I would suggest you to buy and follow the trend so close, because above the trend, we can't go anymore lower.
Of course use a stop-loss in short and mid term transactions, because this is high volatility insturment and any news, as like banning cryptos in India, can make a strong push below the trend.